Good morning … bond yields UP (on supply concerns / indigestion) bad for stocks. Bond yields DOWN on global macro / econ developments yesterday (not as important as today) and … bad for stocks. Go figure…
Welp, the ink wasn’t dryyesterday when all of a sudden, Team Rate CUT got some run support which soothed / stoked fears / hopes …
CalculatedRISK: Q1 GDP Growth Revised Down to 1.3% Annual Rate
ZH: Q1 GDPRevised Lower To Just 1.3%, Lowest In Two Years As Consumption Slows
… AND the rest is, as they say, history … bonds caught a BID (ahead of week and MONTH END — ie rebalancing needs, detailed HERE) …
#GotBONDS? … Want some? Momentum IS overSOLD but the UPTREND remains in tact and so, see whatever it is you’d want to see on the DAILY charts. I will HOPEFULLY (weather permitting) check back over the weekend with a longer term look of the updated WEEKLY / MONTHLY charts to see what, if anything, has changed but for now, some other input from yesterday …
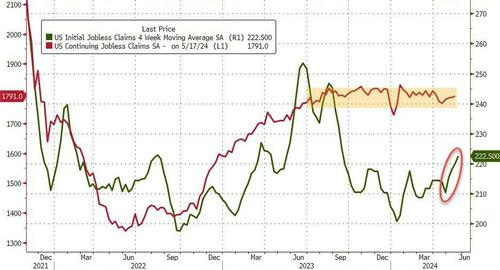
ZH: Initial Jobless Claims Rise Near 8-Month Highs, But...
Another week, another government-sponsored jobless claims print to mock…
… Continuing claims was basically flat just below 1.8 million Americans...again... but we do note that the 'trend' for claims is up (4-week MA at 8 month highs)...
… While WARNs and job cut announcements (not provided by the government) are notably elevated...
… AND with this bit of ‘run support’ (and bond BID) in play, when the dust settled …
ZH: Bad Macro, Worse Micro, But Biden Batters Big Caps As Bitcoin, Bonds & Bullion Rip
… here is a snapshot OF USTs as of 705a:
… HEREis what this shop says be behind the price action overnight…
… WHILE YOU SLEPT Treasuries are slightly lower and flatter after EU CPI proved marginally hotter than expected, with 5y Bunds underperforming (+5bps) and EURUSD +0.2%. Flows have tilted towards steepening interest from systematic accounts and some light demand in the long-end, possibly in anticipation of month end. The UST curve is ~2bps flatter in 2s/30s, while real yields are leading the nominal back-up. APAC equities remained mixed overnight (SHCOMP -0.3%, NKY +1.1%), while the DAX is -0.2%, and S&P e-minis are -0.3%. Crude is flat, and copper is -0.6%. UST volumes are running ~85% the 30d ave.
… and for some MORE of the news you might be able to use…
NEWSQUAWK: US Market Open: US equity futures modestly softer, Dollar contained ahead of US PCE, EGBs pressured post HICP … Bonds are pressured and EGBs more-so after hotter EZ HICP metrics, downside which has been pared slightly … USTs are slightly softer as Thursday's bounce runs out of steam and hot Tokyo headline CPI, but with price action fairly contained ahead of the key US PCE figure later today. USTs are at lows of 108-12 having dipped from Thursday's 108-19+ peak but currently remain comfortably above the WTD base at 107-31.
Downward revisions to PCE subtracted 0.3pp from the initial GDP growth estimate, placing Q1 growth at 1.3% q/q saar. As with the initial estimates, the softening relative to Q4's 3.4% q/q saar mainly reflects volatile components that are unlikely to persist, with only modest deceleration in the bellwether PDFP component.
BARCAP: Strong April goods imports reinforce resilient domestic demand picture
The goods trade deficit widened by $7.1bn to $99.4 in April on the back of a strong increase in imports driven by automotive vehicles and capital goods. Exports showed a more modest gain on the month.
BARCAP China: May PMIs point to slowing growth momentum
The May official PMIs painted a picture of gloomier growth fundamentals, with a contractionary manufacturing PMI and visible decline in the construction PMI, while services edged up. The NBS PMI also suggests the labour market deteriorated further and industrial profits remain under mounting pressure.
BARCAPMay employment preview: Payrolls to strengthen (next weeks news this week? Team Rate Cut to hop on to this one at time of print …?)
We expect a 200k increase in nonfarm payroll employment in May, slightly faster than April's 175k gain, with average hourly earnings rising 0.3% m/m (3.9% y/y). On the household side, we look for the unemployment rate to remain at 3.9%.
BMO: GDP Revised Lower, Core-PCE 3.6%, Claims Uptick
It was a bond-friendly round of data to start the session. Q1 real GDP was revised to 1.3% vs. the initial estimate of 1.6%. Within the details, we see Personal Consumption at 2.0% vs. 2.5% prior and the 2.2% consensus. The price deflator unexpectedly moved lower to 3.0% vs. 3.1% prior/forecasted. Core-PCE similarly dropped by 0.1 pp to 3.6% compared to the 3.7% initial read and consensus. Final Sales to domestic purchasers moved lower to 2.5% vs. 2.8% prior -- the lowest since 2Q 2023. Advanced goods trade dipped to -$99.4 bn in April vs. -$92.3 bn Mar and -$92.4 bn projected -- a marginal detractor from Q2's growth estimates. Initial Jobless Claims during the week ended May 25 rose to 219k vs. 217k expected and 216k prior. This brings the 4-week moving average up to 222.5k for the highest since September 2023. Continuing Claims during the week ended May 18 printed below the 1796k consensus at 1791k (6-week high) and 1794k prior was revised down to 1787k…
10y UST briefly challenged the 200-DMA earlier this month forming interim low near 4.30%. It has staged a brief up move after this test. Recent pivot high at 4.53% is first layer of resistance. Break above this resistance would be essential to confirm extension in up move. In such a scenario, ongoing up move could persist towards next potential hurdles near 4.63% and April high of 4.69%/4.73%.
Defence of the 200-DMA near 4.33%/4.30% is crucial for averting deeper down move.
BOND MARKET POSITIONING UPDATE: BETTER CPI DATA, BUT SHORT BIAS STILL PRESENT
Bond market positioning remains slightly short of neutral. Improved inflation doesn’t appear to be driving an increase in bullish sentiment, outside of 10 year options on futures skews.
As of Friday’s close, 2, 5, 10, and 30 year Treasury futures open interest were well above the 90th percentile from 2021-present.
Changes in open interest, similar to what we’re currently seeing, have coincided with Treasury yield movement for much of the past 4 years.
The sentiment implied by put/call ratios has remained largely unchanged in recent weeks. Data indicates bullish sentiment for 2s (0.49 open interest ratio), bullish-to-neutral sentiment for 10s (0.84) and 30s (0.71), and neutral sentiment for 5s (1.1).
Option skews suggest a long call bias for 2s and 5s, which we still suspect to be a hedge against short positions. Skews now suggest a short bias for 10s and 30s.
The narrow SOFR/FFR spread indicates room for shorts to run as well.
Inflation, and economic data broadly speaking, remain the primary drivers of bond market activity, with a data-dependent Fed on pause. Current positioning data tells us recent improvements haven’t been enough to move expectations. With risks remaining, and room to run, we expect shorts will continue to grow.
… 2 & 5 YEAR TREASURY FUTURES OPEN INTEREST RISING, WATCHING TO SEE IF YIELDS CREEP HIGHER AS WELL
Futures open interest, specifically for 5 year Treasuries, have jumped recently. With open interest increases coinciding with past selloffs, it’s clear that shorts are big drivers of this activity.
We get fresh evidence on the hedonism of the US consumer, with personal income and spending numbers. The personal consumer expenditure deflator will be the markets’ focus. This is less influenced by the nonsense of owners’ equivalent rent than is consumer price data. There are other notable differences (like motor insurance). Overall, the inflation data is expected to stay steady…
Wells Fargo: Revisions to Consumer Goods Spending Behind Lowered GDP Growth
Summary Revisions to first quarter GDP took the headline growth rate down to 1.3% from 1.6% previously, with a sharply lower profile for consumer goods spending accounting for most of the adjustment. Corporate profits slipped, but the decline overstates recent weakness…
… The bottom line: the contraction in goods spending subtracted 0.42 percentage points from headline GDP growth in the first quarter (chart), that's a much bigger bite that the 0.09 PP drag in the first estimate. With offsets in other components, today's downward revision in GDP growth can be blamed upon these revisions to goods spending…
… And from Global Wall Street inbox TO the WWW,
AllStarCharts: The Bond Market Knives Come Out (wait, what? I thought bonds were crashing … oh, wait, when you read this it’s just a DEFENSE piece after rates dropped not 12hrs after they wrote about bonds crashing …? )
No matter how you slice it, bonds are stuck in a downtrend.
Perhaps bonds are carving out a tradeable low. If so, we have our levels to trade against. But price is fallingaway from our entry orders, heading in the opposite direction.
You just can’t buy long-dated U.S. Treasuries right now…
Check out the U.S. T-Bond ETF $TLT:
TLT is trading beneath a downward-sloping long-term (forty-week) moving average and a yearlong downtrend line. Long-term averages and trendlines epitomize the Keep It Simple Stupid (KISS) approach to trend analysis because they work.
We can also add a well-defined bearish momentum regime on the 14-week RSI to our bearish data point list. The lackadaisical bid for bonds reminds us that it’s far easier for an asset to fall on weak demand than to rise on dwindling supply.
During last week’s Portfolio Accelerator in Sonoma, we discussed easing demand for long-duration U.S. Treasuries. Like most good conversations, questions outweighed answers.
Meanwhile, the bond market crash continues. Nobody wants to buy U.S. Treasuries further out on the curve as the eight-week T-Bill yields 5.27%.
That could change, of course. But buying bonds has proven to be a painful endeavor as buyers limp to the side.
I prefer to spend time and energy on better opportunities…
Bloomberg: It Won't Be A Shock To See Another Bank Fail Soon
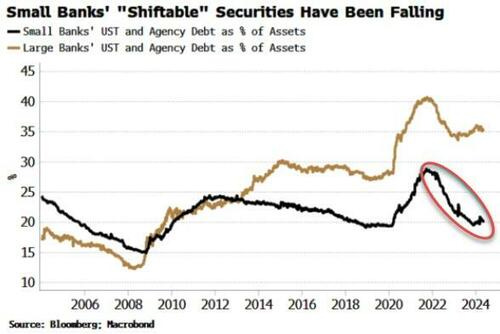
… If another bank goes to the wall, the market will look to the Fed to restore stability. The BTFP was a major part of the initiative after SVB, allowing banks to swap USTs, agency debt and other high-quality collateral at par for loans of up to one year. The Fed stopped issuing new BTFP loans in March as it was being used mainly as an arbitrage.
Either way, the reintroduction of such a facility in the wake of another bank failure or failures rests on the banks having a sufficient ownership of “shiftable” securities the Fed is willing to accept. But smaller banks’ proportion of USTs and agency debt to total assets has continued fall, in contrast to large banks.
Einstein’s definition of insanity was doing the same thing over and over again and expecting a different outcome. Smaller banks in the US continue to lose money on commercial real estate, face heavy losses on securities portfolios as yields push higher, and are just as exposed in the aggregate to bank runs from uninsured deposits. Sanity thus demands being ready for more bank failures.
Cutting Edges Closer Bond investors have had a nervous week as signs of sticky inflation disrupted expectations for rapid easing across most major economies.
Treasury yields approached the year-to-date highs reached in April on the back of some wretched US government bond offerings and there were plenty of hawkish cries from Federal Reserve officials to keep investors on edge.
Top of mind, is whether the central bank will deliver any of the interest-rate cuts they’ve been talking about. Fed Minneapolis President Neel Kashkari even mentioned hiking as a possibility! That was likely music to the ears of one top-performing quant fund that’s been shorting five- to 10-year US Treasuries on bets the Fed won’t cut in 2024.
Bloomberg
Markets got a lot calmer after Thursday’s reading on the US economy showed it slowing as expected, and New York Fed President John Williams signaled “restrictive” policy settings are doing their job. Rates traders boosted their bets on cuts this year — they remain certain of at least one — but are effectively seeing only about a one-in-three chance of a second reduction.
The prospect of higher interest rates for longer was cited as a concern by Treasury Secretary Janet Yellen, who said it heightens the importance of boosting revenue. This year’s US elections are also focusing minds on the the case for higher yields. Piper Sandler & Co. strategists calculate 10-year yields could rise about 12 basis points if President Joe Biden wins reelection. Bill Gross, meantime, told the Financial Times a Donald Trump victory would be more disruptive for bond markets than a Biden win…
Bloomberg: Yellen Pivot Is Fading: Liquidity Drains From The System As Treasury Issues Fewer Bills
Real gross domestic product (GDP) grew at a 1.3% annualized rate in the first quarter of 2024. The four-quarter growth rate for 2023 was 2.9%, which is well above our 1.7% estimate of trend growth. Given the restrictive stance of monetary policy, we expect real GDP growth to slow towards trend over the forecast horizon.
The labor market remains strong. Payroll employment grew by 175,000 jobs in April 2024, which is somewhat lower than the previous several months. Nonetheless, it indicates solid job growth that exceeds the number needed to keep pace with normal labor force growth. The unemployment rate ticked up to 3.9% in April but remains at a level consistent with a tight labor market.
The 12-month headline personal consumption expenditures (PCE) inflation rate was 2.7% in March 2024, while the 12-month core PCE inflation rate, which removes volatile food and energy categories, was 2.8%.
Inflation data in recent months have been mixed, and progress towards the Federal Reserve’s 2% longer-run goal may have slowed. Monthly PCE inflation readings for the first three months of 2024 suggest that inflation may be increasing from levels observed towards the end of 2023. The three-month annualized change in the PCE price index in March was 4.4%, up from 0.6% in December 2023. However, April inflation readings measured by the consumer price index suggest that the elevated inflation readings in the first quarter might not continue into the current quarter, raising the possibility of renewed declines in headline and core PCE inflation in coming months …
Hedgopia: On Back Of Soft Demand For Treasury Auction, 10-Year T-Yield Rallies To Upper End Of Symmetrical Triangle
ING Rates Spark: Higher PCE inflation would keep the 10yr target at 5%
Today, we see the final April reading for US inflation, which is shaping up for confirmation of 0.3% month-on-month as a central outcome. That's too high for (Fed) comfort. Treasuries really need a 0.2% MoM reading, otherwise the path remains in place for a move towards 5% on the 10yr
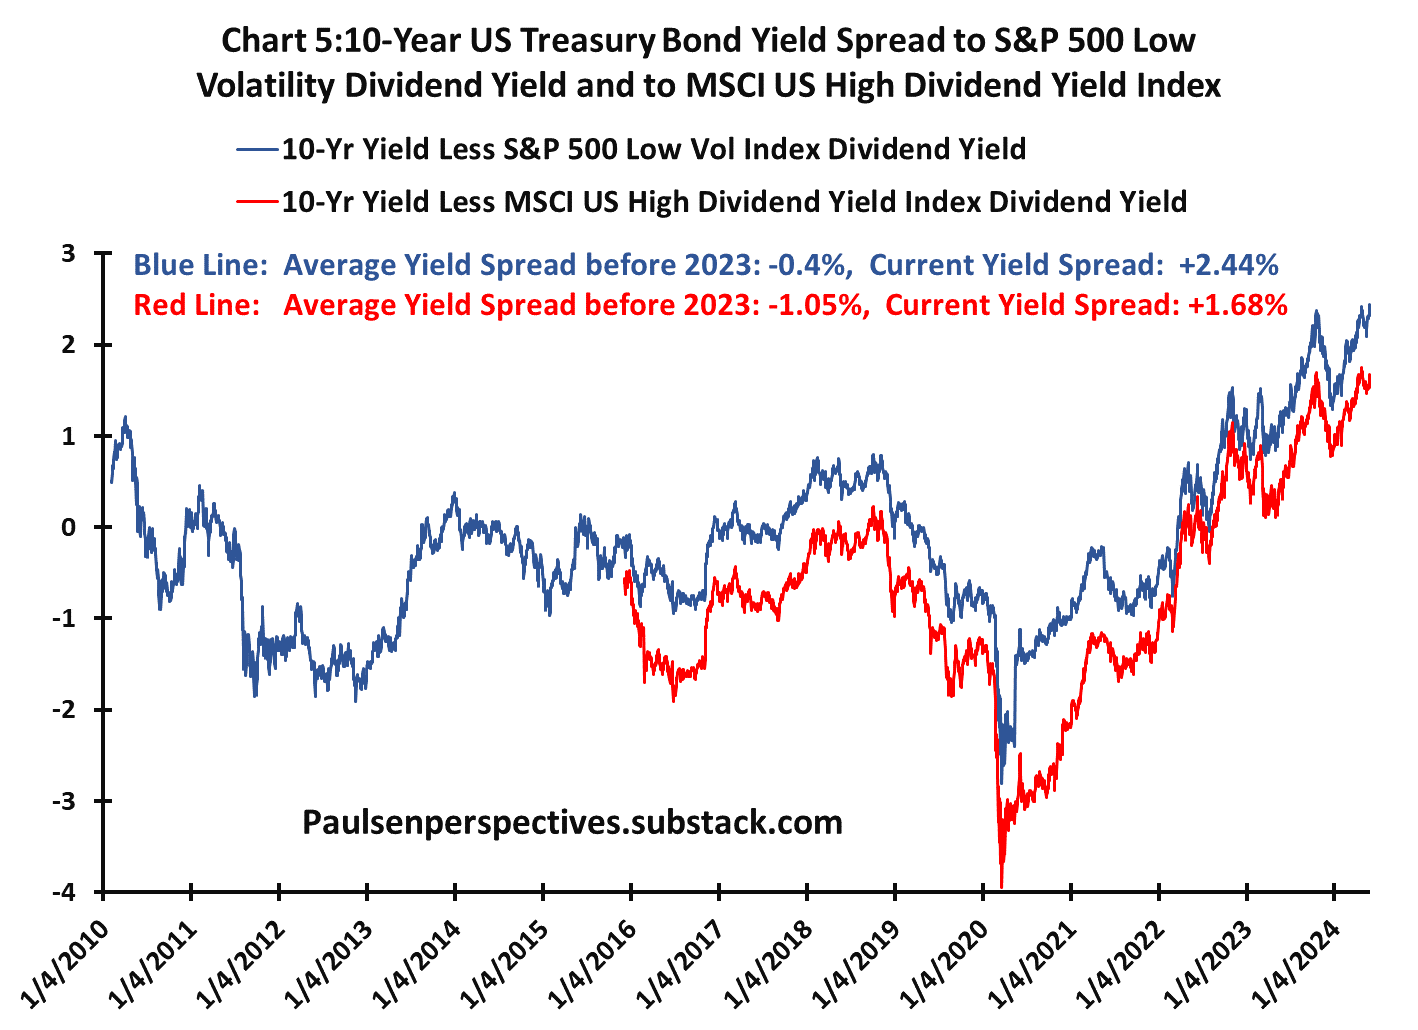
One way to judge the level of bond yields is to compare them to the yield offerings of alternative investments. Chart 5 compares the difference in the 10-year yield to the yield available on two popular substitute alternative investments – the S&P Low Volatility Index and the MSCI U.S. High Dividend Yield Index.
Investors buy a Treasury Bond when they seek a decent return with relatively low risk. This investment choice is often compared to low-risk equity investments like Low volatility or high dividend offerings. As demonstrated, the current 10-year bond yield at about 4.6% is much higher than normal compared to Low-Vol or High-Dividend equity offerings. Indeed, prior to 2023, these two equity dividend yields were typically “higher” than the 10-year Treasury yield. Prior to 2023, the 10-year Treasury yield traded at a discount of -0.4% relative to the Low-Vol dividend yield but currently the Treasury yield is 2.44% higher. Similarly, prior to 2023, the Treausry yield on average was -1.05% below the High-Div equity index yield, but currently it is +1.68% higher.
These are simply two examples where the U.S. 10-year Treasury bond yield looks too high.
…Technical Setup The S&P 500 rallied above March highs earlier this month and notched its 24th record high of the year. The advance was largely driven by a handful of mega cap stocks that rallied on strong earnings. In fact, chipmaker NVIDIA (NVDA) has contributed to just over one-third of the S&P 500’s gain this month alone.
From a technical perspective, the breakout to new highs this month was a little underwhelming. Participation in the rally was relatively narrow, with fewer constituents making new 52-week highs and trading above their 200-day moving averages (dma) than back in March. Furthermore, the lack of overbought conditions amid the rally created a negative divergence between momentum and price action. For example, the S&P 500’s Relative Strength Index (RSI) — a momentum oscillator used to measure the velocity of price action to determine trend strength — failed to reach overbought territory or levels commensurate with prior highs registered earlier this year.
Important to note, narrow participation in breakouts above key resistance has been characteristic of this bull market (generals lead, soldiers follow). For example, the breakout to new highs in January saw fewer stocks trading above their 200-dma or making new highs than in December, while the RSI had also formed a divergence from price action during this period. Rotational forces outside the mega cap space kept the rally going.
Gotta tell y’all the Jim Bianco podcast nailed it and to think one or the other at end of the day … gonna spend 6tcpmes down to something else … and guessing between now and Labor Day gonna be few more ‘surprises’ (sentencing and conventions, Hi yer trial this week??) ugh


See you all after PCE rounding exercise folks
Gotta tell y’all the Jim Bianco podcast nailed it and to think one or the other at end of the day … gonna spend 6tcpmes down to something else … and guessing between now and Labor Day gonna be few more ‘surprises’ (sentencing and conventions, Hi yer trial this week??) ugh