Tomorrow morning you are likely to find a visual of 20s ahead of tomorrow afternoons auction and so today I’ll cut to the chase and take a quick peek at 2yy because …
The US dollar climbed to a one-month high as Treasury yields rose and Asia equities declined after hawkish ECB comments pushed back against bets on early and extensive rate cuts. (Bloomberg)
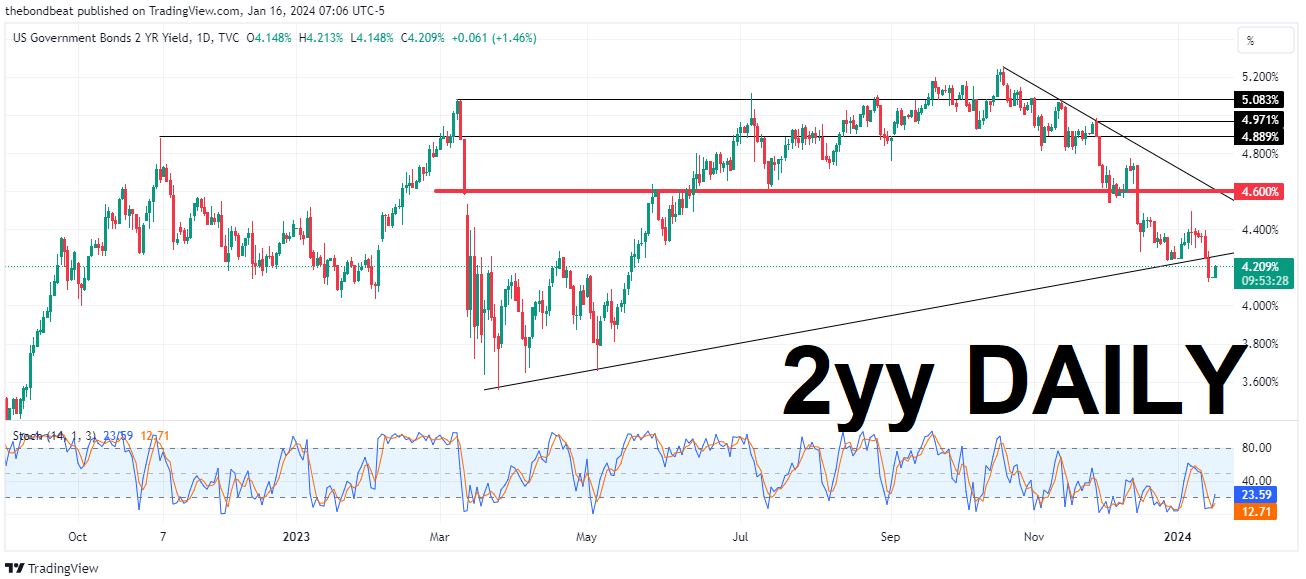
… where I’d note we’ve been down so long they look UP a touch TODAY BUT … before getting to wound up on today’s move I would ADD momentum does appear to be supportive OF a grind higher and at the same time, there are plenty of levels readily available to support a buy on dip mentality for those in the 6 rate cut camp…for more on 2s, see DB below as to WHAT has driven yields lower and even further below, on the PIVOT PARTY … for now, though … here is a snapshot OF USTs as of 705a:
… HEREis what this shop says be behind the price action overnight…
… WHILE YOU SLEPT Treasuries are lower with the curve little changed as pushback grows against rate cut pricing here and in Europe. DXY is higher (+0.75%) while front WTI futures are little changed (+0.3%). Asian stocks were mostly lower, EU and UK share markets are all lower (SX5E -0.35%) while ES futures are -0.4% here at 7am. Our overnight US rates flows saw a weak trade in Treasuries during Asian hours with 10yr rates back to ~4% by the London crossover. We saw better selling in the long-end from fast$ names though volume is intermediates was notably elevated. During London's AM hours, selling in 10' to 30's from real$ names was a feature this morning though flows in the front-end were cited as more constructive with real$ interest offsetting fast$ selling there. Overnight Treasury volume was about average overall with 5yrs (136%) seeing some relatively elevated average turnover overnight…
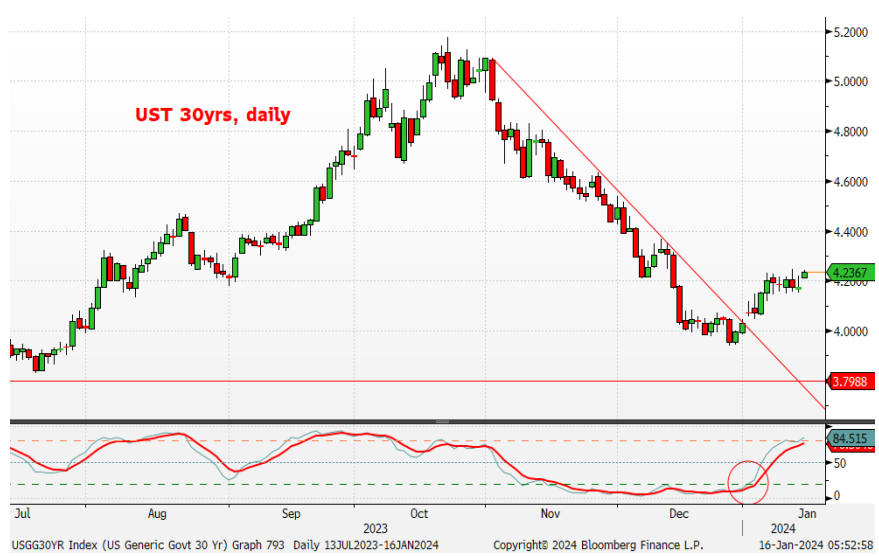
… Treasury 30yr yields, shown next in a daily chart, appear to be breaking bearishly out of last week's tight sideways range, perhaps beginning a new leg cheaper (looks like bear trend continuation pattern) over the near-term.
… and for some MORE of the news you can use » The Morning Hark - 16 Jan 2024 and IGMs Press Picks (who CONTINUES to be sportin’ that new, fresh look) in effort to to help weed thru the noise (some of which can be found over here at Finviz).
Before moving along TO Global Wall Street inbox, a story from IGM this morning caught MY attention …
Nikkei Asia: China 10-year yield near record low on deflation fears – Speculation of easing persists even as medium-term rate kept steady.
… This as yields here are UP a touch today … interesting? Prolly not …
Moving from some of the news to some of THE VIEWS you might be able to use (in addition to THESE UPDATED WEEKLY VIEWS brought to you over the weekend HERE ) … SOME of what Global Wall St is sayin’ … some of which was from the weekend (and hit AFTER I sent THIS … with an updated look at WEEKLY OBVSERVATIONS)
Recent inflation data and Fedspeak give us more confidence in our core positions: curve steepeners and short USD.
We believe that markets are underestimating the potential extent of rate cuts across LatAm in the current cycle. We have entered into spread receivers in Brazil and Mexico.
Into a quieter week on the data front, we like FX strategies that blend carry with value.
CitiFX: The struggle is real (from MLK day while most of the US was not payin’ attention but rather, payin’ homage … to the man with a dream which was NOT about realz)
US 10y real yields: A weekly close below the 55w MA on a weekly basis (for the first time since March 2022) has initiated a 55-200w MA setup.
Why it matters: The setup means we could see ~148bps of downside (formation indicated). However, we note that the close below 55w MA was marginal. Hence, we prefer to be cautious and wait for a weekly close below Dec lows at 1.6178% as well.
Technical indicators:
Close below 55w MA setup for the first time since March 2022.
This level has been the key support since mid-Dec as well as on 2 other occasions in 2023.
The close below initiates a 55-200w MA setup. However, we prefer to wait for a close below 1.6178% (Dec lows) as well
Charts
DB: Inflation, Waller, and the front-end (move lower on ‘flation)
Today’s chart shows the 2y Treasury yield since the broad peak in rates last October. Over this period, the 2y has fallen roughly 90bp, to 4.14% last Friday.
What’s driven the move?
As reflected in the chart, two things: softer inflation data and dovish Fed communications, including Governor Waller’s 11/28 remarks in which he expressed optimism around a soft landing and pointed to possible rate cuts as soon as the next several months. Altogether, the 2y yield fell 87bp in 24-hour windows surrounding CPI, PPI, the FOMC and Waller, meaning the moves across this handful of days account for essentially all the net decline…
DB: Mapping Markets: How today looks increasingly like the late-1960s (for better or worse …)
1. Labour markets are tight and unemployment is at low levels by historical standards.
2. The late 1960s were a time of heightened geopolitical risks. 3. Despite low levels of unemployment, governments ran larger deficits in the late 1960s than they had before…
… Nevertheless, the parallels between the late 1960s and today are instructive, and the risks of premature easing over the 1960s and 1970s is clearly a lesson that policymakers are seeking to avoid. Moreover, with tight labour markets and several geopolitical risks on the horizon today, history shows how inflation can quickly move higher again in that sort of environment.
Goldilocks: Global Views: Cuts Are Coming (not IF but when …)
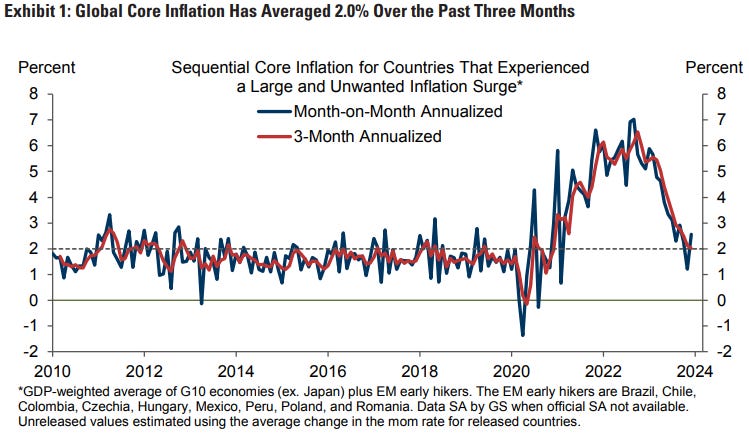
1. Global core inflation—averaged across the G10 ex Japan plus the EM early hikers—picked up to an estimated 1-month annualized rate of 2.6% in December from the rock-bottom 1.2% reading in November. This has triggered a renewed round of concerns that the disinflation of 2023 may not last, with some arguing that it was due to a one-off improvement in goods supply—and thus a one-off decline in the level of goods prices—alongside entrenched service inflation. We continue to take a more optimistic view. First, the trend is still improving, as the 3-month annualized rate fell further to an estimated 2.0% in December. Second, the adjustment in core goods prices is far from complete—for example, US used cars have only unwound 31% of their covid-related price increase. And third, we expect both service inflation and wage growth to continue slowing gradually in a lagged response to the improved supply/demand balance across the global economy.
2. The US has fully shared in the global disinflation trend… 3. Despite low jobless claims, an unchanged 3.7% unemployment rate, and a 216k nonfarm payroll increase in December, the US labor market continues to rebalance… 4. These signals leave us comfortable with our forecast that the Fed will start cutting the funds rate soon, most likely in March… 5. There is still a good conceptual case for a growth pickup in Europe this year on the back of rising real household income and easier financial conditions, and some forward-looking activity indicators such as the ZEW expectations measure are showing a modest improvement.. 6. Our BoE call for late 2024/early 2025 is also below market pricing… 7. The case for macroeconomic easing is even stronger in China than in the advanced economies… 8. Our economic forecasts should be friendly for risk asset markets, especially in the US where the move toward Fed easing is occurring alongside continued solid growth…
Goldilocks: 10 Growth Risks for 2024 and Why We Worry Less (so on the one hand CUTS ARE COMIN’ and on the other hand 10 reasons to worry and why they aren’t worried add all up and no matter WHAT happens, Goldilocks to markets: I TOLD YA SO and hence why we’re all muppets?)
We expect much stronger GDP growth in 2024 than consensus and see a much lower risk of recession. What are other forecasters worried about that we aren’t? This Analyst looks at 10 risks for 2024 that are often highlighted by other forecasters and explains why we worry less.
Risk 1: A consumer slowdown looks unlikely because real income should grow about 3% and household balance sheets are strong… Risk 2: Rising consumer delinquency and default rates … Risk 3: A sharper deterioration in the labor market… n Risk 4: The narrow breadth of job growth is not indicative of either a mismatch problem or weak labor demand in most sectors … Risk 5: Rising corporate bankruptcies… Risk 6: The corporate debt maturity wall… Risk 7: Commercial real estate… Risk 8: A bank credit crunch… Risk 9: Something finally “breaking” due to higher interest rates is unlikely at this point because the peak growth hit from higher rates and tighter financial conditions is well behind us. Moreover, with inflation lower, the FOMC is at liberty to cut the funds rate more aggressively if necessary.
Risk 10: Fading fiscal support…
MS Sunday Start | What's Next in Global Macro: March Out of Step (JUNE > march)
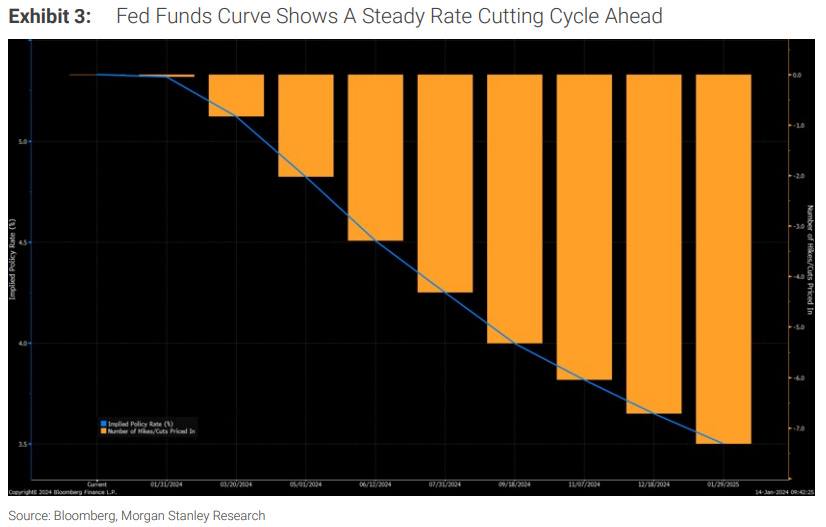
The impressive rally in US duration that began in November is continuing, while the market-implied probability of a rate cut at the March FOMC meeting hovers around 80%. Market pricing notwithstanding, our economists continue to view the June meeting as their modal expectation for the start of cuts. They see the risk of an earlier start to rate cuts skewed to May versus March. In today’s Start, we dig into recent key macro data and Fedspeak to frame our stance on the timing of Fed policy on rate cuts. Both the numbers and Fedspeak support our views …
… To sum up, nothing in recent data nor in Fedspeak makes a compelling case for bringing our rate cut expectation forward to March. As Seth Carpenter, our chief global economist, has noted, “It would take either some serious stress in financial markets or notable downside surprises to inflation, jobs, or both to get a rate cut in March.” Clearly, December jobs and inflation data as well as commentary from Fed officials do not presage such downside surprises and provide no impetus for us to bring the timing of rate cuts forward, market pricing notwithstanding.
MS US Equity Strategy: Weekly Warm-up: Bond Market Still in Charge (music to a former bond market participants ears)
With macro forecasts remaining in a narrow range, we believe interest rate volatility is an important consideration for equity investors. Meanwhile, dispersion of equity fundamentals is likely to pick up as earnings season progresses, putting the focus on stock picking.
Bond Market Still in Charge...Over the past 6 months, interest rates have been the most important determinant of equity index performance, in our view. We see this continuing in the near term, and believe interest rate volatility is an important consideration for equity investors, particularly as economic forecasts have centered around a narrow range of outcomes. We also think it's worth exploring the differences between how the bond market and the equity market price the future path of the Fed Funds Rate.
The risks of an earlier cut by the ECB and the BoE are higher than for the Fed as the risks to downside surprises in the data are greater, and the starting point for the real economy is weaker.
Last week, we reiterated our baseline view that the Fed cuts in June, albeit with some risks to a May cut. Thursday’s US CPI data and Friday's PPI emphasized the risks to an earlier start. This week, we consider our call for a June ECB cut and a May cut from the BoE. The general story, that it will take downside surprises in the data relative to our forecast, is much like in the US. But while we place a low probability that US data will lead the Fed to cut in March, the risks of an earlier rate cut are higher in Europe because the risks to downside surprise in the data are greater, and the starting point for the real economy is weaker…
UBS: US Equity Strategy - Increasing S&P 500 Target to 5150 (and…another target bites the dust…year-ahead outlooks becoming so passe)
Upside Case Becomes Base Case On December 11, we published S&P 500 to 4850 by YE 2024, Risks to the Upside. The upside referenced above was predicated on robust earnings, falling inflation, easier monetary policy, and more favorable economics. Given the Fed's recent pivot, subsequent decline in rate expectations, and above-trend 2024 EPS revisions, we now embrace this upside scenario as our base case.
Target from 4850 to 5150, 2024E EPS from $225 to $235 We are increasing our 2024 S&P 500 target from 4850 to 5150. This new target represents 7.7% upside. We are also increasing our 2024-25 EPS estimates from $225 to $235, and $246 to $250. Importantly, our growth estimates of 6.3% and 6.4% over the next 2 years are below the consensus of 11.4% and 12.8%. While earnings should drive 2024 returns, falling interest rates should support incrementally higher multiples.
UBS (Donovan): Muted effects from strikes on shipping (lets HOPE he’s right)
A container ship has been struck by a missile in the Gulf of Aden, without sustaining serious damage. The economics of the threat to shipping remain muted. There are still ships sailing through the Red Sea. European gas prices are at the lowest level since last August, so concerns about energy prices should be limited. The additional nine days it takes to ship cargo around the Cape of Good Hope is unlikely to result in shortages, and shipping costs are a tiny part of the price consumers pay for goods….
… And from Global Wall Street inbox TO the WWW,
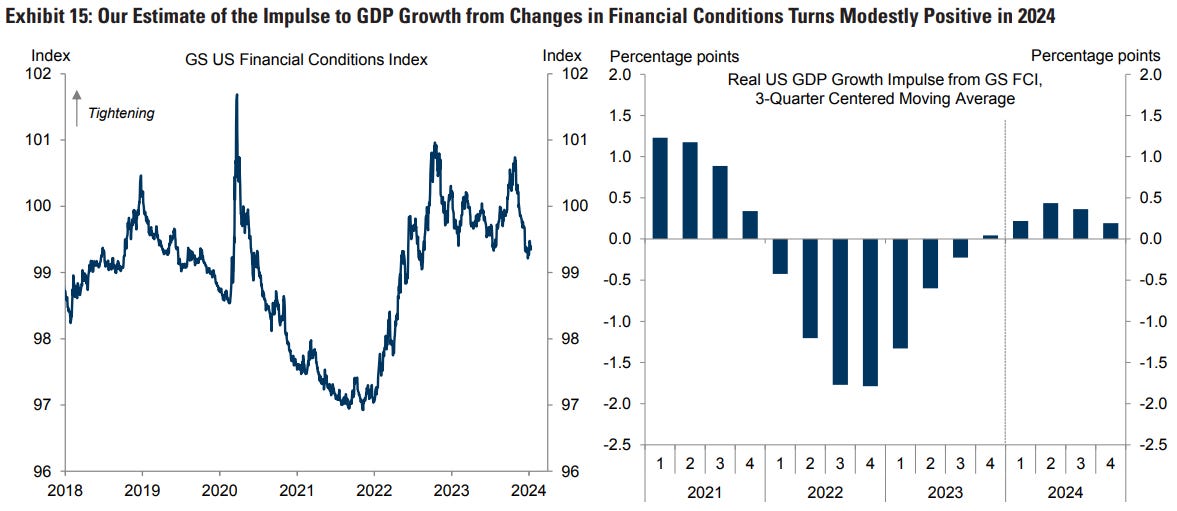
Apollo: Pivot Party Continues (‘nuff said? easier fincon means fewer rate cuts, amIright?)
The ongoing easing of financial conditions continues to point to a reacceleration in growth over the coming months, see chart below.
Apollo: $6 Trillion on the Sidelines in Money Market Funds ($$ on the sidelines…going to stocks or bonds? hey, here’s an idea … maybe it’s going to both? ever hear of 60/40?)
Since the Fed started raising rates in March 2022, the amount of money in money market funds has increased from $4.5 trillion to $6 trillion, see chart below.
With the Fed cutting rates over the coming quarters, we will likely see some of the $6 trillion leave overnight risk-free fixed income and flow into other asset classes such as equities, credit, and duration.
The record-high $6 trillion in money market accounts is likely a tailwind to equities, credit, and rates, and ultimately the economy—in particular hiring, housing, and inflation.
Apollo: S&P 500 Very Expensive Relative to International Equities (self explanatory)
Bloomberg: Bond Bulls Fixated on Fed-Rate Cuts Risk Getting Smacked Around
Swap traders are resolute on bets for big 2024 Fed reductions
10-year Treasury yields find center of gravity at key 4% markv
Bloomberg: Sticky US Inflation Will Wrongfoot Fed Rate Bets, BlackRock’s Hildebrand Says
Former SNB chief warns that services inflation is still high
Investor optimism is ‘probably overdone,’ he says in Davos
LongTermTrends: Quarterly Chart Brief (…while 1st topic on the recession that never came, funTERtaining, some of the RATE VISUALS excerpted)
…M2 yoy growth bottomed at -4.78% after it hit 26.81% in 2021. CPI Inflation peaked in June 2022 at 9.06% and has been somewhat stable at around 3.2% since May 2023.
The Real Interest Rate is once again positive at 1.69% with CPI Inflation at 3.3% and the nominal interest rate of a 1-year US Treasury bond at 4.82%.
Topdown Charts: 12 Charts to Watch in 2024 (excerpting a couple caught MY — bond - eyes)
… 5. Yield Curving: These 3 lines all measure the same thing – the maturity of the business cycle (**and turning points**). On all 3 counts they say the cycle is long in the tooth, and turning.
6. Bond Bargain: As such, and while things have moved a lot since the brief 5% reading for the US 10-year treasury yield in October last year, government bond valuations are still cheap, and the macro downside risk scenario I outline here is bond bullish. It won’t be a straight line, but bonds likely see further upside in the coming year following one of their worst bear markets in recent history.
Stocks are a different matter though…
ZH: "It's All Over": Powell's WSJ Mouthpiece And JPMorgan Confirm Imminent End Of QT
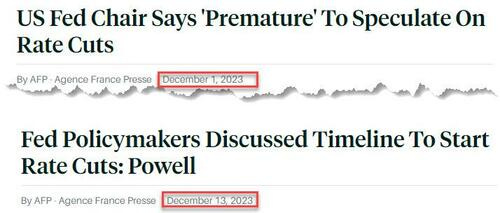
On December 13 the financial world was stunned when, just two weeks after Jerome Powell had said he it was "premature" to speculate on rate cuts, the Federal Reserve did a shocking U-turn and pivoted dovishly, ending the Fed's hiking cycle with inflation still running at double the Fed's target of 2%, and said that it had in fact discussed the start of rate cuts, contrary to what Powell said just two weeks earlier.
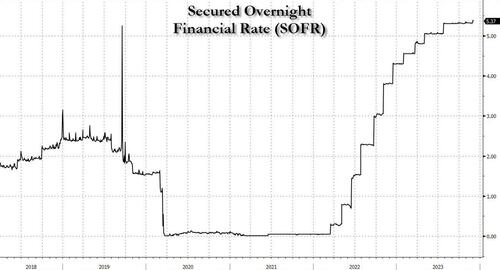
Or rather, we should say "the financial world that had not read Zero Hedge was stunned" because just one week ahead of the Fed's December FOMC meeting, we correctly predicted the Fed's pivot due to one simple reason: as we laid out in "The Canary Just Died: Sudden Spike In SOFR Hints At Mounting Reserve Shortage, Early Restart Of QE", the Fed no longer had a choice and was forced to pursue a dovish pivot because the liquidity in the all-important systemic and interbank plumbing had hit dangerously low levels, resulting in the highest SOFR print on record, and the biggest spike since the last time there was a repo market crisis in March 2020.


A fascinating read !!!