ZH: Soft Landing? Initial Jobless Claims Plunges Near 54-Year-Low
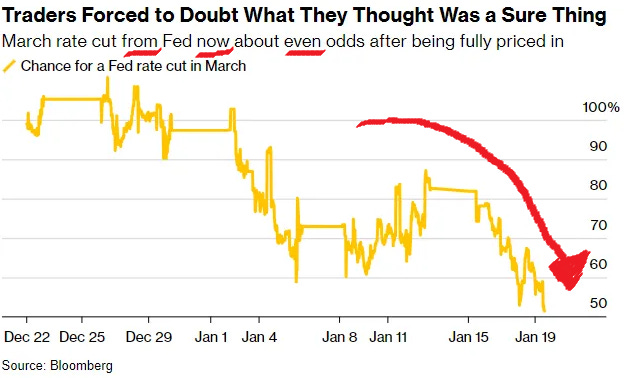
… and so, rate CUTS are slowly being priced out and thanks to a visual from Bloomberg (context below), you can see …
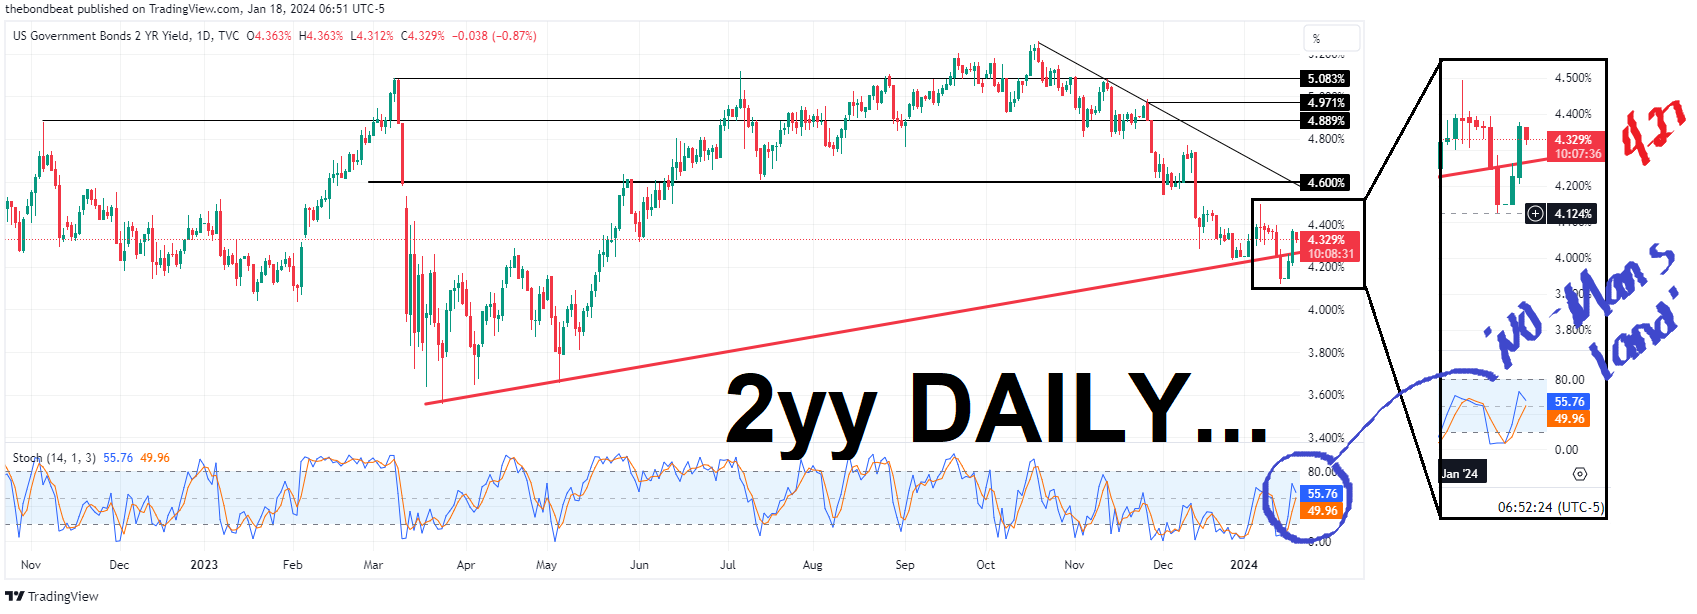
… and as these rate CUT ODDS have declined YTD, here’s a look at what 5yy (belly, so a proxy and in light of having already noted 2yyYEST) have done …
… SO a cutting in half of rate CUT ODDS — now still ‘even money’ — equates roughly TO about 20bp on the 5yy. Perhaps good to know IF, for example, data were to continue to NOT cooperate (ie GOOD news is BAD) and rate CUT ODDS were forced to continue rethink, yields likely to go up.
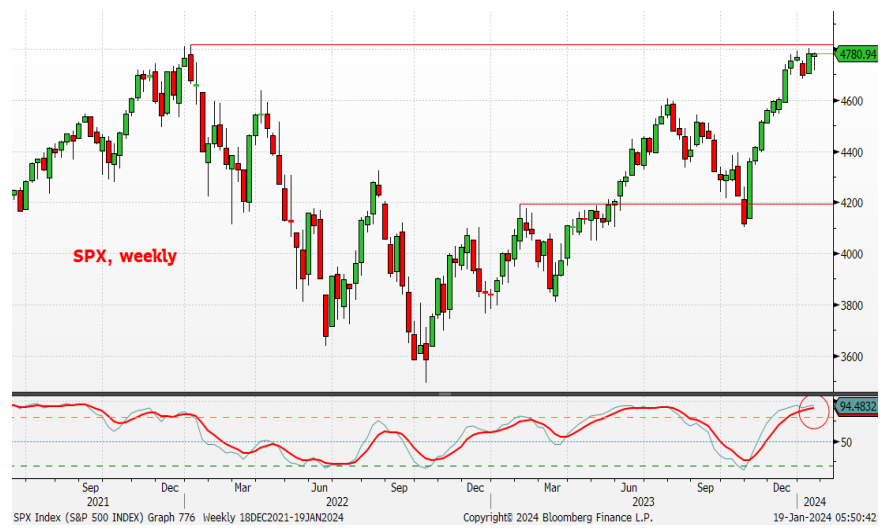
IF, on the other hand, you are looking solely at technicals, one MIGHT view this as a DIPortunity where momentum (stochastics, bottom panel) have gone from overBOUGHT to now overSOLD (on verge of a bullish cross on the DAILY charts, anyways) and so, one might suggest using this ‘dip’ as a chance to get long.
I’ll have some sorta snowed-in weekend update and attempt to take a look at somewhat bigger picture / context (weekly) charts but for now … here is a snapshot OF USTs as of 705a:
… HEREis what this shop says be behind the price action overnight…
… WHILE YOU SLEPT The Treasury curve has pivoted around 1.5bp flatter off a sharply unchanged 2yr Treasury yield overnight. DXY is lower (-0.2%) while front WTI futures are little changed. Asian stocks were generally higher outside of China, EU and UK share markets are little changed and ES futures are +0.45% here at 7:15am. Our overnight US rates flows saw better buying in the long-end during Asian hours as Treasuries reacted poorly/bearishly to a slightly hotter headline inflation reading in Japan. In London hours, our flows were more mixed with the desk adding that momentum buying has given way to level-sensitive interest there. Overnight Treasury volume was ~70% of average overall.
…S&P futures (SPX) are doing what yield curves are doing right now: pressing up against (but so far respecting) key range resistance levels. SPX does look predictably 'overbought' (see weekly momentum lower panel) here at resistance and it will be interesting to see how this tension is broken/resolved.
… and for some MORE of the news you can use » The Morning Hark - 19 Jan 2024 and IGMs Press Picks (who CONTINUES to be sportin’ that new, fresh look) in effort to to help weed thru the noise (some of which can be found over here at Finviz).
Moving from some of the news to some of THE VIEWS you might be able to use… here’s SOME of what Global Wall St is sayin’ …
BARCAP US Economics: Outlook change: Resilient consumer provides more support to growth (facts change they change, what do you do, sir … etc… see visual above and context below re rate CUTS slowly leaving the building…)
Recent data suggest that consumer spending was more resilient to close out 2023 than we had previously thought. This leads us to revise upward our GDP growth estimate for Q4 23 and our outlook for 2024.
… We maintain our rate call trajectory, with risks skewing toward fewer cuts With the FOMC having downplayed GDP growth as a factor driving its thinking about the path of monetary policy, citing improvements in potential output, we maintain our call for incremental every-other-meeting cuts to the funds rate starting in March 2024. As before, these cuts are mainly predicated on the monthly core PCE price inflation continuing to come in very soft in January and February, which would allow for some recalibration of the policy rate to reflect lower inflation.
We continue to regard the March meeting as a very close call, with risks that the Fed will remain on hold if the FOMC is unconvinced that core PCE price inflation is on course for a sustained return to 2% in light of eased financial conditions, developments with labor supply, and spending momentum. Communications by FOMC participants in the past week – including Waller, Bostic, and Mester – highlight this risk.
BloombergBNP: US Q4 GDP preview: More strength beneath the surface
KEY MESSAGES
We estimate annualized real GDP growth of 1.8% in Q4 2023, a pace that may understate economic momentum nearly as much as reported Q3 growth at 4.9% overstated it. We project final demand (GDP ex. inventories and trade) – a better measure of underlying growth – advanced 2.7% in Q4, down from the prior 3.6% pace.
Solid consumer spending is set to be the main driver, while business investment stalled. Robust holiday spending, which boosted retail sales at the end of 2023, puts consumption on a solid trajectory heading into January. Resilient household spending, which makes up two-thirds of the economy, is expected to support overall growth too, going into early 2024.
Large fluctuations in inventory investment have added volatility to GDP post-pandemic, and uncertainty about the economic outlook has made it more difficult for companies to estimate the optimal level of stocks.
Though the report represents a slowdown from the outsized Q3 pace of growth, we expect it to show sturdy momentum at year-end, giving little support to near-term rate-cut expectations.
… Lower mortgage rates to keep residential investment afloat: In Q3, residential investment rebounded after nine consecutive quarters of contraction, contributing 0.3pp to growth. Q4 may see another modest gain. Construction activity accelerated recently as homebuilders kept supply coming on line in an environment of high prices and limited existing home inventory for sale. A 1-percentage-point decline in mortgage rates boosted homebuying activity, which will translate to growth in brokers’ commissions in the GDP accounts.
… Our valuation models for the US show that 10yr breakevens are trading close to fair value while 10yr Treasuries are trading 44bps cheaper than fair value.The model is at odds with our US rates forecast which calls for 10yr yields to rise further, a difference that is primarily driven by TP pricing. In the EU, our 10y HICP model remains in highly negative territory with a residual of -42bps. Our TP valuation models show that EUR 5s10s and 10s30s term premia remain too low by 18bps and 35bps respectively, dislocations that follow our macro framework and are expressed in our macro portfolio…
… Liquidity in Treasury markets remained smooth over the past month, with order book depth and bid-ask spreads mostly unchanged. Treasury spline errors point toward a slight improvement in aggregate liquidity for couponbearing USTs, with most of this improvement coming from the 2-5yr and 10yr+ sectors.
Goldilocks: Philly Fed Manufacturing Index Below Expectations; Housing Starts Above Expectations; Jobless Claims Fall Further
BOTTOM LINE: The Philadelphia Fed manufacturing index increased by less than expected in January. The composition was strong, however, with increases in the new orders, employment, and shipments components. Housing starts decreased in December, above consensus expectations for a larger decline, and the November growth rate was revised down. Building permits increased in December, somewhat above expectations for a smaller increase. Initial claims declined against consensus expectations for an increase. Following today’s data, we left our Q4 GDP tracking unchanged at +1.8% (qoq ar) and our Q4 domestic final sales growth forecast also unchanged at +2.5% (qoq ar).
Fed communication has put QT in the spotlight. We look for Fed discussions at upcoming meetings resulting in a June start to taper, earlier than our previous expectation. But the market narrative that the end of QT is coming soon has been overdone. Earlier start will be paired with a slower taper.
Key Takeaways
The Fed will start discussing tapering QT soon, but will not end QT soon. Recent Fed communication has stirred market discussion about the end of QT. That narrative is overdone. We see the Fed discussing QT at upcoming meetings, likely announcing the parameters of a taper to QT in May and initiating the taper in June.
Our baseline is that the Fed will cut the pace of QT in half for Treasuries, to $30bn/month, but leave MBS to run off with prepayments. If we are wrong, it is more likely the taper pace will be slower, not faster.
We discuss mechanics of our projections, but we expect the SOMA portfolio to fall about $750bn from the current level. We see the RRP facility falling to roughly $0, and QT ending in early 2025 when reserves are about $3.2tn.
Enormous uncertainty surrounds the ultimate size of the balance sheet and the end of QT. The Fed has clearly said it will monitor market conditions to determine when to stop. Two key parameters stand out among many that the Fed will monitor. If the SOFR-IORB spread goes to zero or turns positive, it will be important. If the standing repo facility (SRF) is used in size, it will also be a meaningful signal.
Although markets will pay close attention to the Fed's balance sheet, we see the implications for fixed income markets as limited. The shift in supply of Treasuries relative to expectations will likely not be substantial, and the effects will be most noticeable in the front end and swap spreads, rather than longer-dated yields. MBS spreads will consequently be little affected, but marginal passthrough from funding conditions could arise from time to time. And likewise, we think credit markets are not meaningfully affected for all of the above reasons.
One key misconception is that QT necessarily means destruction in bank deposits. Indeed, over the past couple of quarters as the Fed's balance sheet has contracted, deposits have moved mostly sideways but have also actually edged up.
… As front-end markets continue to come into balance, SOFR has started to gradually climb above the RRP rate over the past year. In our view, the eventual depletion of the RRP is what will ultimately allow SOFR to come in consistently at or slightly above IORB as banks become the marginal lenders of cash (right now, dealers can meet surges in demand for repo financing by bidding up MMF cash in the RRP, earning the fixed rate of 5.3%). Current conditions remain consistent with abundant reserves (Exhibit 7).
UBS: December starts retrace the November surge, claims surprise on the downside
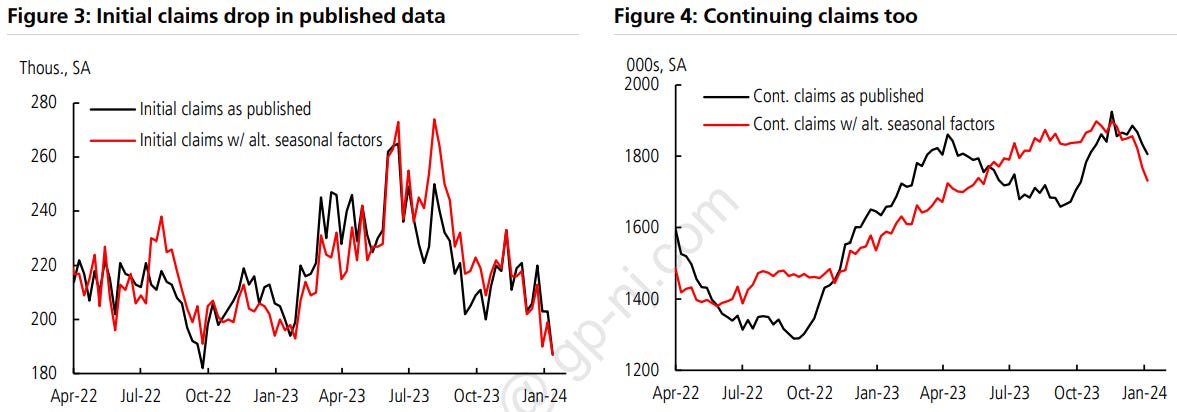
…Initial claims for unemployment insurance unexpectedly plunge to 187K Initial claims for unemployment insurance fell 16K to 187K in the week ending January 13, below all estimates in the Bloomberg survey. Our (208K) and consensus (205K) expectations called for a fairly flat reading. The figure was also the lowest since September 2022. The gap the past few weeks between pre-Covid and post-Covid seasonality had been relatively large the past two weeks as shown in Figure 1 below, but closed entirely this week, as claims dropped 12K using our alternative seasonal adjustment. Smoothing through the weekly volatility in the published data, the 4-week moving average dropped to a low 203K, below the prior trough of 206K in the week ending October 14.
Continuing claims for unemployment insurance fell again, paring back 26K to 1806K in the week ending January 6. The reading was also below our (1850K) and consensus (1840K) estimates. Using our alternative seasonal adjustment, the general upward trend of continuing claims continued through year-end of 2023, consistent with hiring slowing and the stock of benefit recipients growing, but the recent weeks have seen improvement. As we show in the chart below comparing the series with our pre-Covid seasonality with the current published data, the published series trended higher in the final months of 2023, as it did in 2022. With our estimates of pre-Covid seasonality, initial claims dropped to 187K, while continuing claims declined to 1731K. We clarify the coming effects of alternative seasonal adjustment in our latest weekly …
… And from Global Wall Street inbox TO the WWW,
Apollo: Fed Pivot Has Restarted the Hunt for Yield
The Fed pivot has restarted the hunt for yield, see chart below. The question for markets is whether the associated rebound in housing, hiring, and capital markets activity will trigger a rebound in inflation.
… Fed Atlanta President Raphael Bostic urged caution given the potential economic impact of unpredictable events ranging from elections at home to conflicts around the world. That came after Fed Governor Christopher Waller — who helped open the door to rate-cut speculation last year — stressed the need for a gradual approach. Bankers at Davos got the message, including BlackRock Inc. Vice Chairman Philipp Hildebrand, who underscored concerns that inflation may be stickier than expected.
Bloomberg: Traders Dust Off 2000s Options Playbook to Cash In on Higher Rates
Strategy uses deep in-the-money puts to make low-risk cash
Cboe says the trade is twice as common as it was 3 years ago
Citigroup Inc.’s option volume was light on a recent Wednesday, until the session’s last 90 minutes when a wave of trades hit. These weren’t bets on the shares moving — rather, they were part of a long-dormant strategy that’s back in vogue thanks to the Federal Reserve’s interest rate hikes.
The trade involves selling large volumes of put options that allow the holder to offload shares far above the current market level, and collecting interest on the premium received. It was pointless back when interest rates were near zero. But now, with Treasury yields at 5% or more, the strategy is suddenly worthwhile.
“Nobody did this for 20 years because there wasn’t any interest rates,” said Joe Mazzola, director of trading and education at Charles Schwab & Co. “Interest rates are back. It makes sense.”
The strategy is largely used by large institutional players “trading thousands at a time to make half a penny,” Mazzola said. “Mom and Pop don’t do this.”
According to data from Cboe Global Markets Inc., these financing trades are taking place twice as often as they did just three years ago. The exchange operator pointed to repeated rate tightening as one reason traders have dusted off their old playbooks…
Bloomberg: Seismic Bond Shift Has Traders Watching Yield Curve’s Every Move
Market has priced big rate cuts and curve remains inverted
Gross and Bassman are calling for a steeper yield curve
… That’s a world away from last July, when two-year Treasury yields exceeded 10-year ones by more than a full percentage point. It was the sort of deeply inverted yield curve last seen in the early 1980s, a side effect of the Federal Reserve’s series of rate hikes aimed at fighting inflation. The campaign, it was feared, risked tipping the economy into recession.
Veteran investor Bill Gross, the co-founder of Pacific Investment Management Co., and Harley Bassman, a long-time bond expert who invented the MOVE Index of Treasury market volatility, are among those predicting that chapter will soon end. What is the subject of fierce debate is what propels the pivot, and the answer means money for some and losses for others…
… Key to how any steepening unfolds is the timing of Fed rate cuts. After central bankers signaled a shift toward easing late last year, investors ramped up rate-cut bets and piled into Fed-policy-sensitive two-year notes, driving yields to the lowest since May earlier this month and below yields on US 30-year bonds. Traders have since tempered their wagers as US economic data continued to show resilience and Fed officials emphasized they want to ensure inflation is tamed before embarking on any cuts.
Two-year yields remained a hair above those on 30-year bonds as of Friday morning in Singapore, though still about 0.2 percentage point higher than yields on 10-year US debt. As for Fed cuts, markets are now pricing in about 1.4 percentage points of reductions this year, compared with expectations of as much as 1.7 percentage points of easing as recently as last week. Meanwhile, March rate cuts that were largely baked into the market are now seen as more of a toss-up.
Bloomberg: Second thoughts on rates, but not on Bitcoin ETFs (Authers OpED)
Markets are coming to grips with the idea that the Fed won’t be cutting as fast as they thought. In contrast, the new Bitcoin vehicles are charging out of the gate.
… Meanwhile, higher bond yields haven’t led to a major stock market selloff, with the US moving roughly sideways for the year. That means that asset allocators who thought bonds were due a period of outperforming stocks (including many who answered BofA’s survey) have been proved wrong so far. Stocks’ driving outperformance of bonds, an almost permanent feature of the post-pandemic landscape, is back on track. The following chart compares SPY, the main ETF tracking the S&P 500, with TLT, which follows Bloomberg’s index of Treasury bonds of 20 years or more. The trend of stock outperformance appeared at last to be over; now it’s back again.
Why are the bets on cuts still so strong? Much of it derives from a reading of the Fed and its political motivations. The central bank is supposed to be independent. But let’s assume (as many do) that it’s driven by an urge to help Joe Biden retain the presidency, even though Chair Jerome Powell and influential governor Christopher Waller are registered Republicans. Early rate cuts might help their man, although it’s unlikely the effects would be felt much by voters this side of the election.
Any monetary easing at any point this year is going to run into accusations of political maneuvering from Donald Trump. Nobody wants to get on the end of Trumpian opprobrium. Announcing a pivot toward rate cuts last month arguably makes it easier for Powell torelax conditions while denying ulterior motives. But the stronger the economy remains, the harder that will be.
Even after the ructions in the first weeks of this year, futures still predict a 3.75% fed funds rate by January of 2025, down from the current effective rate of 5.33%. Without some significant deterioration in the economic data, that estimate still needs to be revised upward.
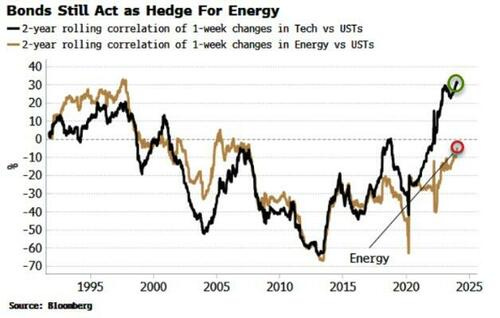
Bloomberg (via ZH): Stock Duration More Vulnerable As Inflation Risks Bristle
Higher-duration equity sectors are exposed to a resurgence in inflation. Sectors of lower duration such as energy are more resilient to price growth, are less overbought and – unlike tech-focused sectors - continue to act as a hedge for bonds.
After a brief hiatus in 2020/21, investors have been happy to look through inflation risks and sit on duration-heavy portfolios. But this could be the year that that strategy faces a reckoning if, as multiple leading indicators anticipate, inflation returns.
Over the last 12 months, higher-duration sectors have vastly outperformed their lower-duration counterparts.
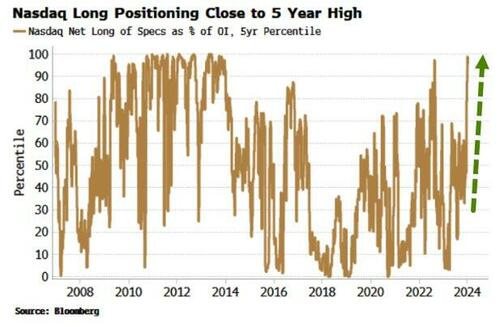
Moreover, in recent weeks, there has been a surge in inflows to the tech sector, which have become an even-more consensus trade in the wake of the Federal Reserve’s pivot.
However, each Fed cut does not reduce risks - it increases them through stoking an eventual larger rise in inflation. Portfolios that see duration incrementally fall – rather than rise, which might be the temptation – will be more resilient to an increase in price growth.
Equity portfolios with slimmed down duration profiles confer another advantage: they will have a lower - or even still-negative - correlation with bonds. Stocks overall have been negatively correlated with bonds for decades. But in this cycle they have become positively correlated, meaning bonds now reinforce losses from stocks rather than acting as a hedge.
Tech’s correlation with bonds has risen far into positive territory. The energy sector, however, is still negatively correlated with bonds, while in general low-duration sectors are less correlated with fixed-income than high-duration ones.
As well as providing a better risk-adjusted return for multi-asset strategies, lower-duration equity portfolios are cheaper, less prone to a correction, and better placed to weather a recrudescence in inflation.
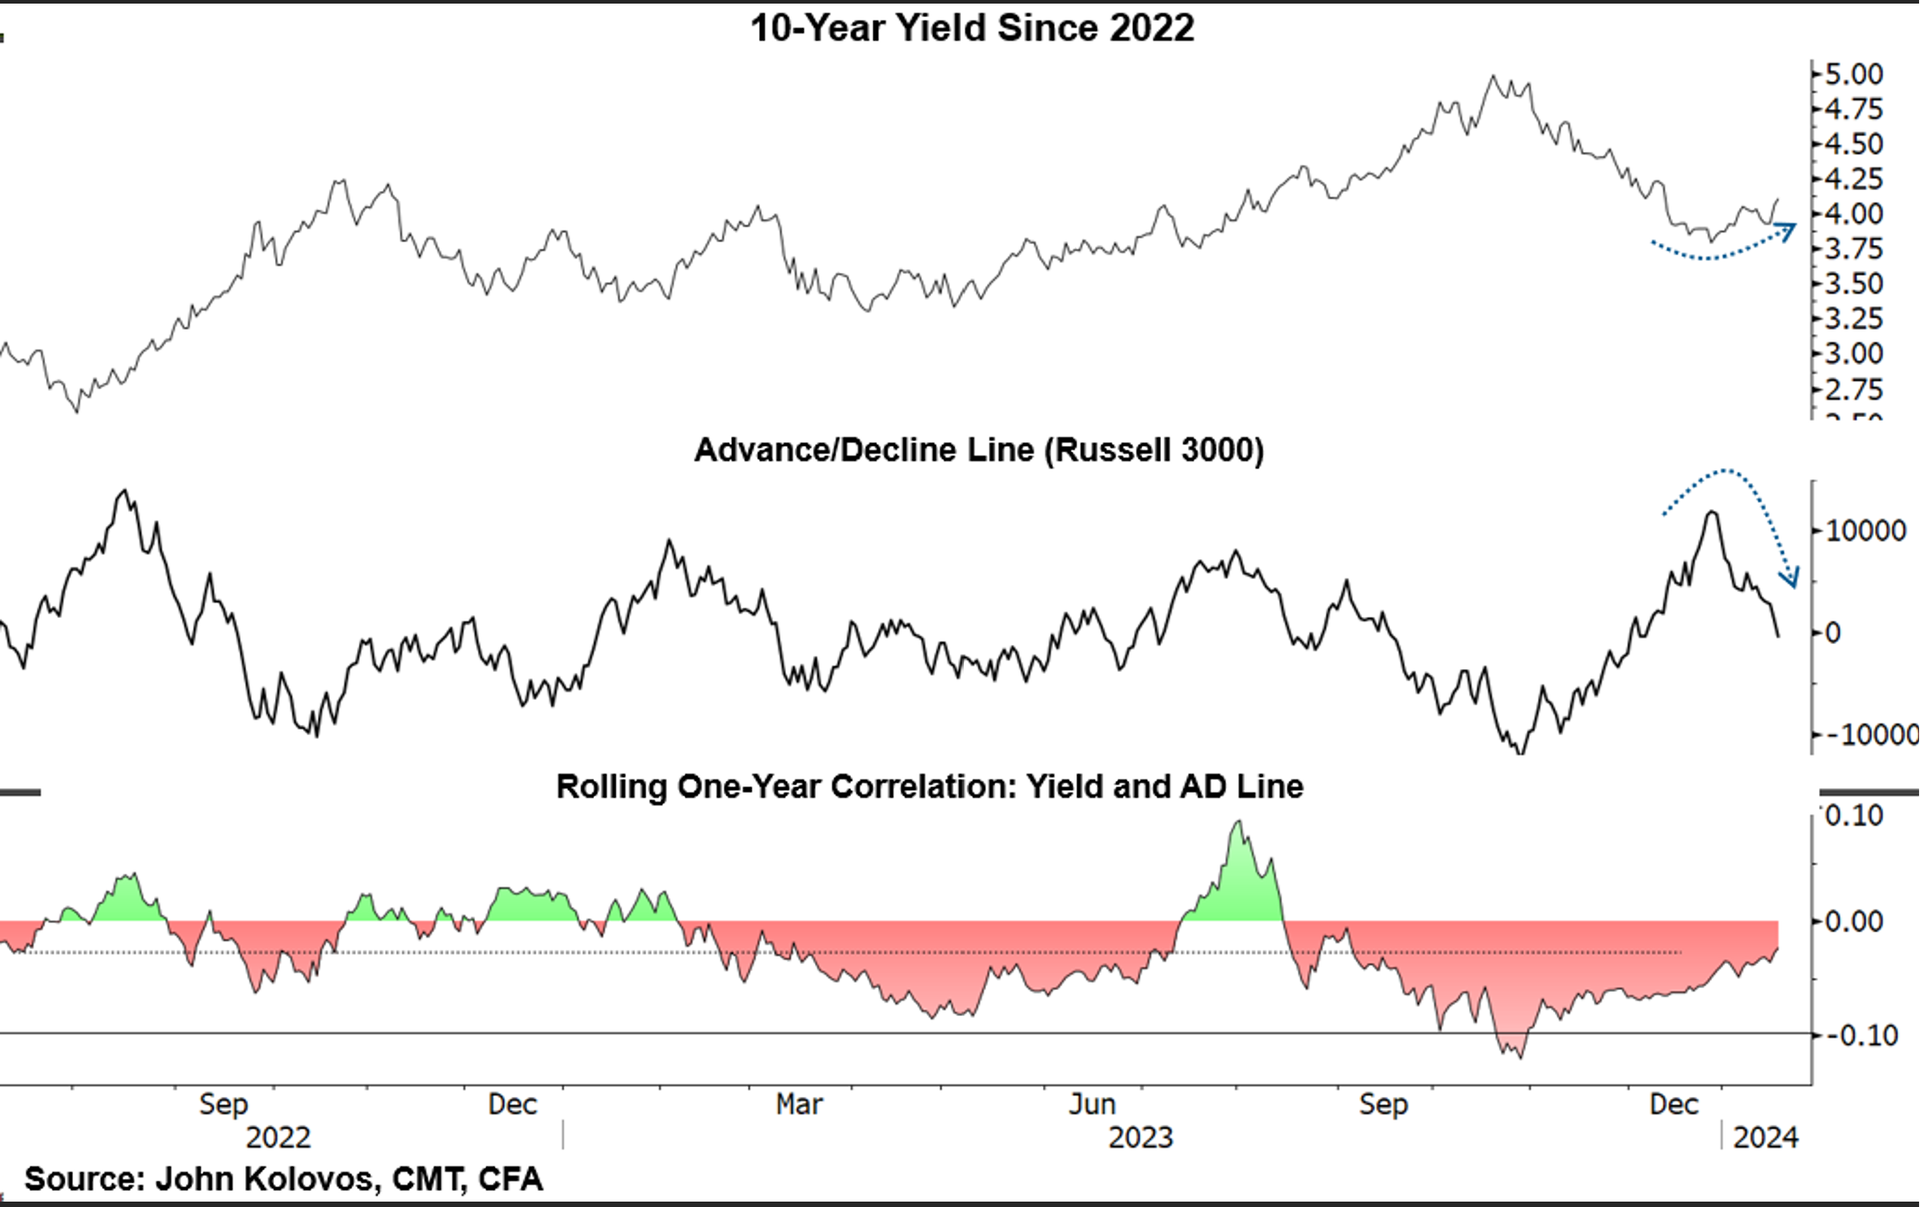
… 2/ Breadth and Rates Are Linked We are being reminded again as we were for all of 2023, that interest rates and breadth are inversely related. Chart 2 shows the rolling correlation between the US 10-year Yield and the Russell 3000 AD Line. The broadening of the equity market in Q4 was based on a major Fed pivot that now appears to be in the process of being reevaluated. In turn, yields have bounced, and breadth has weakened. Safety is being sought at the mega-cap growth complex, and risk is being reduced in the part of the market that is most sensitive to inflation, rates, and a recession.
In what was supposed to be the “year of fixed income,” 2023 proved to be an OK year, but not a generational one. The Bloomberg US Aggregate Index returned 5.5%, right in line with the historical average return for the market. Perhaps most surprising, the bulk of the return didn’t come from falling rates, as most expected, but rather coupon clipping combined with a decent return in spread products like corporate credit and agency mortgages.
As we shift gears into 2024, spreads are tight, rates are low, and the market is pricing in a whopping six interest rate cuts before year-end. Four of those are expected by August with the first priced to come in March. We believe this sets up the market for another volatile year, one where surprises could lurk around every corner.
…How RBA is Positioned In our view, investors need to look for alternative ways to manage fixed income over the next several quarters. This contrasts with owning the market and hoping for falling rates or spreads not to widen. Investors also need to be nimble enough to take advantage of opportunities when they present themselves this year.
Instead of blindly owning the investment grade corporate bond market, for example, RBA has targeted market segments where a supportive growth backdrop has not been priced, such as preferred securities and AAA CLOs. By barbelling AAA CLOs with long term treasuries, we have also been able to synthetically create the same yield and duration characteristics of the investment grade corporate market with far less credit risk. Our view is that making a bold call on Treasury yields at near neutral levels won’t deliver alpha. Instead, we own yield curve positions through options, which can benefit from interest rate volatility as well as bull and bear steepening. For 2024, we also think it is wiser to own Treasury Inflation Protected Securities (TIPS) and 2y notes than the belly of the nominal yield curve, as these instruments deliver attractive yield and protect the portfolio from higher-thanexpected inflation.
2024 will likely play out very differently than investors currently expect. Though we are excited by the opportunities that could present themselves, we also believe now is not the time to be a hero …
More over the weekend (including latest from HIMCO) but … THAT is all for now. Off to the day job…


Great work !!!!
Flat Interest Rates......the New Normal.....not all bad...
Stock market and the US economy have adjusted to this level of Rates....
Unless something dramatically changes in the economy...Rate Cuts will continue to be pushed off
"Steady as she goes", Admiral Powell.....
IGM link doesnt work :-( but im sure it is still sporting that new look :)