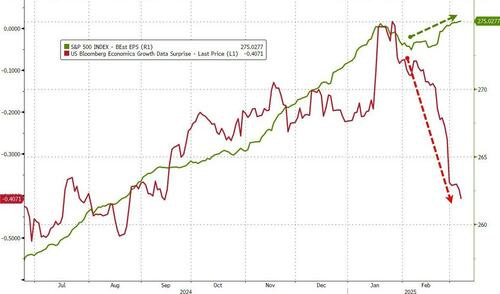
Good morning … #GotBONDS? Want some? This morning starts with today’s $58bb 3yr …
3yy DAILY: TLINE breaks, draw another (red) line in the sand … ‘resistance’ around 3.85% …
… while momentum remains overBOUGHT, ripe for a turn (or time at a price and bonds remain ‘rich’ … relatively speaking, though, perhaps they are the best lookin horse in the glue factory … technical term there …)
For another CURRENT look at some reasoning / sound funDUHmentals behind bid for bonds, well, latest sentiment survey …
NFIB SURVEY: Small Business Optimism Recedes in February
WASHINGTON, D.C. (March 11, 2025) – The NFIB Small Business Optimism Index fell by 2.1 points in February to 100.7. This is the fourth consecutive month above the 51-year average of 98 and is 4.4 points below its most recent peak of 105.1 in December. The Uncertainty Index rose four points to 104 – the second highest recorded reading…
… The Uncertainty Index rose 4 points to 104, the second highest reading. The Optimism Index moderated in February while their level of uncertainty spiked. Small business owners have experienced uncertainty whiplash over the last four months with the Index falling from October’s 110 reading to 86 in December and then back up to 104.
To any / all those writing off bonds and 60/40 for dead, well bonds are NOT DEAD YET …
… Said another way …
… now I’ve clearly been on the side of less economic weakness, doom and gloom, to be sure. Not so much on the Team Rate CUT and to be honest, am not sure much has changed. If anything, the ‘flation remains sticky with slower ‘ish ‘ing growth, well, spells a yuuuuge problem for all sorts of folks. The Fed and fiscal policy makers to name a couple.
On the bright side of things, well … money’s gonna cost Uncle Sam less than, say, a couple / few weeks ago … Starting with today’s $58bb 3yr … for better or worse, lower yields are — for this funding purpose — a good thing.
Some other factoids along with equity prices, helping make up the price action …
ZH: US Consumers Inflation Expectations Barely Budge In Latest Rebuke To UMich Farce Monday, Mar 10, 2025 - 08:40 PM
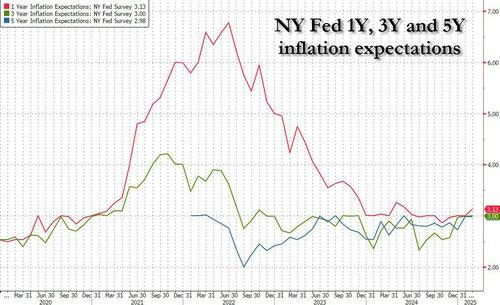
… So fast forward one month to today, when this time we didn't even bother to dunk on the ridiculously useless and politicized UMich "data", and instead we knew that the latest NY Fed numbers would show continued normalization, and that's precisely what happened, when according to the New York Fed’s survey of consumer expectations, inflation expectations at the one-year horizon were just barely higher at 3.1% in Feb. from the previous month’s 3.00%. At the same time, both 3Y and 5Y inflation expectations were unchanged! So much for some imaginary surge in inflation.
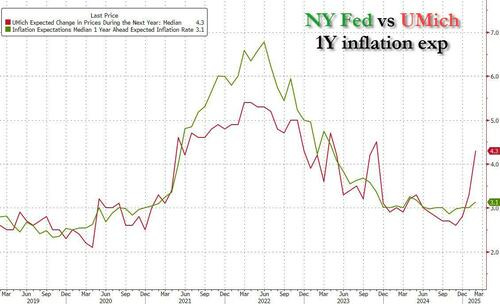
As a result, the gap in 1 Year inflation expectations between the NY Fed survey and the UMich survey - which will deliver its latest pile of steaming horse shit "data" later this week - has exploded so wide...
... even WSJ Fed mouthpiece Nikileaks Timiraos was compelled to comment on it for the second month in a row (and mock it).
And for those who claim that this is all due to confusion by the respondents, the NY Fed dunked on that as well, reporting that the the measure of disagreement across respondents (the difference between the 75th and 25th percentile of inflation expectations) decreased at the one-year horizon and was unchanged at the three- and five-year horizons.
The report also showed that Americans now see faster price growth for gas, food, medical care and rent. Taking a closer look at the composition, year-ahead commodity price expectations increased for all commodities. Median expected price growth increased by 1.1 percentage points for gas to 3.7% (its highest level since June 2024), 0.5 percentage point for food to 5.1% (its highest level since May 2024), 0.4 percentage point for the cost of medical care to 7.2%, 1.0% percentage point for the cost of a college degree to 6.9%, and 0.7 percentage point for rent to 6.7%…
… which then culminated in …
ZH: Economic 'Detox/Transition' Fears Spark Largest Mag7 Market Cap Loss On Record, Bonds Bid Monday, Mar 10, 2025 - 08:00 PM
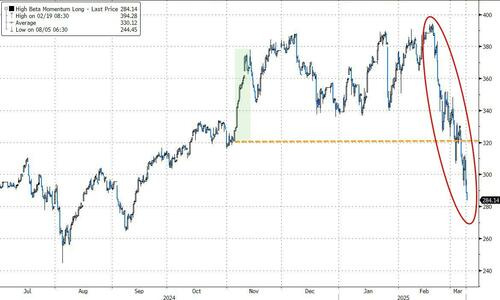
Stocks were monkeyhammered today as all key technical levels have broken with Momentum once again ground zero for pain and (the lack of) liquidity exacerbating the broader market moves.
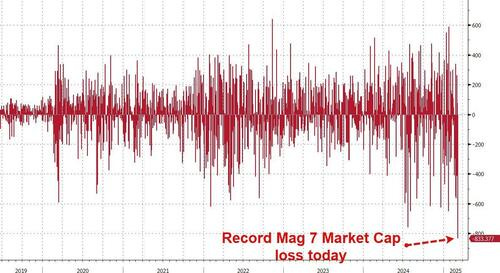
…The bigger they are the harder it is for CNBC to believe they will fall... but Mag7 stocks suffered their biggest single-day market cap loss ever today (over $830BN)...
… There is nothing to point to specifically for why Friday afternoon's rally failed to carry over to Monday. But despite the occasional rally we have seen over the past 3 weeks, the general direction for stocks has been lower as markets recalibrate how much growth they want to price into stocks today...
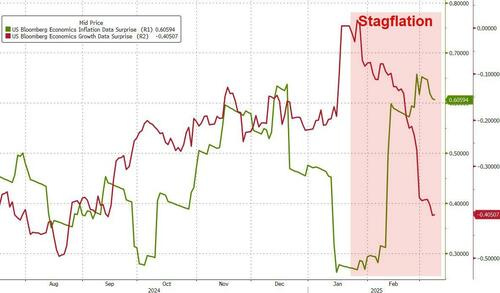
…And don't expect The Fed to come to the rescue yet as the situation is not just a growth scare but the Stagflation monster is back and screaming loud, putting Powell and his pals in a precarious position...
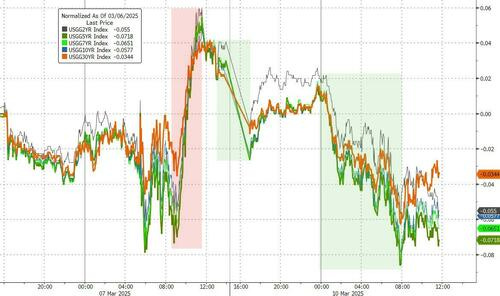
…On the bright side, Treasury yields tumbled today (down 7-10bps across the curve), erasing all of Friday's payrolls spike higher...
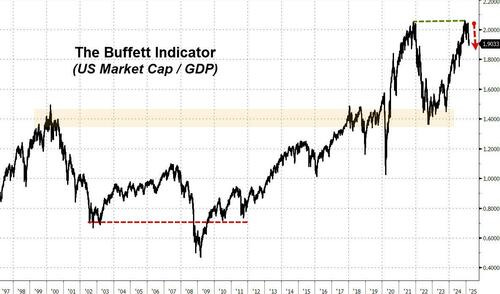
… Finally, the so-called Buffett Indicator has reversed lower from its record high above 2.0x (Market Cap / GDP)
… here is a snapshot OF USTs as of 718a:
… HEREis what this shop says be behind the price action overnight…
… WHILE YOU SLEPT Treasuries initially saw a sharp carry-over bid overnight with 10s testing 4.16%, while S&P futures tested 5560. The desk noted broad participation from both regional and offshore buyers. However, a bear-flattening fade commenced into the late APAC session, with regional sellers stepping in to force a retrace despite a clear catalyst. Despite a softer NFIB print in early US hours, the weakness has continued with the front-end leading the weakness, while USTs outperform cheaper bunds (5y differential at +133.5bps). S&P futures are showing +0.4%, WTI +1.1%, Gold +0.8%, DXY -0.3%, and Copper +1.0% here at 7am.
… for somewhat MORE of the news you might be able to use … a few more curated links for your dining and dancing pleasure …
NEWSQUAWK US Market Open: Sentiment improves modestly after Monday’s hefty losses, and DXY hits fresh YTD low awaiting further Trump updates … USTs hold near unchanged while Bunds slump on the latest fiscal updates … USTs are essentially flat, but do hold a downward bias, as sentiment continues to incrementally improve in today's session, and in tandem with the pressure seen in Bunds (see below). Focus for traders today will be on US JOLTS Job Openings, remarks from US White House Press Secretary Leavitt and then President Trump thereafter. But before those remarks, a 3yr auction; as a reminder, the prior outing was strong, which stopped through the when issued by 1.3bps. USTs currently trading towards the lower end of a 111-11 to 111-25 range. If the pullback continues then USTs have a little bit of clean air until the 111-00 mark.
Finviz (for everything else I might have overlooked …)
Moving from some of the news to some of THE VIEWS you might be able to use… here’s some of what Global Wall St is sayin’ …
First up, an answer to a question. As always, am reminded that narratives ALWAYS follows price and this is NO different. Sorry. Not sorry…
ABN AMRO Macro Watch - What is the macro impact of all this uncertainty? 10 March 2025
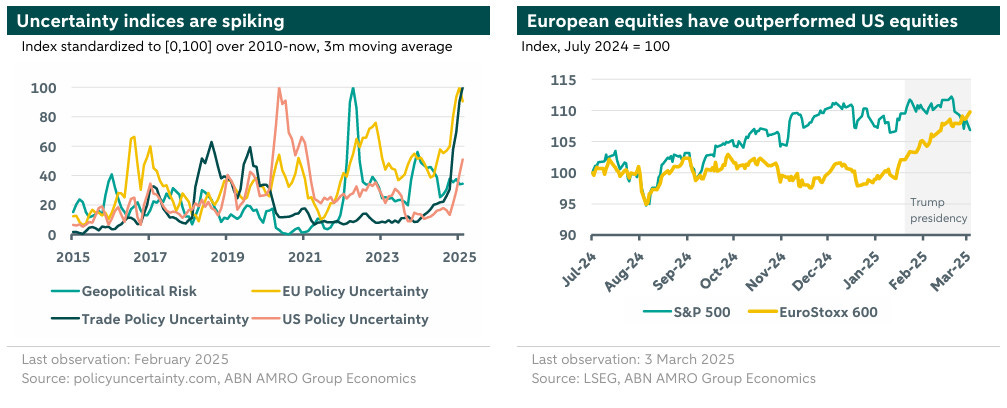
Uncertainty negatively impacts the macroeconomy, even without any actual policy changes. Households consume less and firms invest less, putting a further drag on future growth. The US is expected to face the biggest impact on economic activity, with the partial relocation of investment to the eurozone dampening the negative effects for the single-currency area.
…The academic literature has produced a variety of uncertainty indices on the basis of text analysis. In this piece we consider four of these indices, which best reflect the current environment[1]. The chart below normalizes these indices such that 0 is its lowest, and 100 is its highest value since 2010. The values represent no absolute amount of risk and are not comparable across the indices, merely within.
Unsurprisingly, trade policy uncertainty shows the most remarkable increase since Trump was elected, reaching levels more than one-and-a-half times the maximum uncertainty during his first presidency, which reflects the various tariffs that have been threatened and recently implemented. US and EU policy uncertainty is seeing a drastic rise in uncertainty since the start of Trump’s presidency, with EU policy uncertainty effectively doubling, while US policy uncertainty even quadrupled. US policy uncertainty is still rapidly increasing. EU uncertainty is near all-time highs, on the back of elections, defense and budget issues, already elevated after Russia’s invasion of Ukraine. Geopolitical risk peaked after that invasion, and has not substantially increased, though it is marginally higher compared to the middle of last year…
… There has also been a transition back into a ‘risk-on, risk-off’ environment. It has been some time since we’ve seen the local correlation of lower equity valuations leading Treasuries higher. For much of the cycle, the relationship had been that spikes in nominal yields would lead to a selloff in stocks as investors were sensitive to the potential fallout on firms from higher borrowing costs (and higher discount factors). In large part, this was a function of elevated inflation which effectively left the Fed with the ‘single’ mandate of reestablishing price stability. While inflation hasn’t reached the Fed’s objective yet, it is well off the highs and, in general terms, appears to be at least trending in the right direction. The journey back to the FOMC’s target might be taking longer than preferred, but cooler consumer inflation (alongside pockets of concerns on the labor front) have brought the employment component of the Fed’s dual mandate back into focus. With this backdrop, equity market selloffs are being interpreted as a barometer for the real economy, not as responding to higher rates …
… With ‘risk-on, risk-off’ as the operating narrative at the moment, we’ll dust off another idiom and suggest that the next stage will be when “bad news becomes good” for stocks. The futures market is currently pricing in 82 bp of cuts this year in a clear indication that investors have confidence in the Fed’s resumption of the journey back toward neutral rates. If the realized data paints a more troubling picture of the economic landscape, odds for lower rates will increase, and equities would presumably benefit, maybe …
France weighin’ in with a weekly look at quantum physics …
BNP: Quant trades of the week: Cautiously risk constructive: Long WTI, Nikkei 10/03/2025
KEY MESSAGES Market themes
Heightened volatility and equities underperformance over the last couple of weeks have led our US financial conditions index to re-tighten.
However, looser financial conditions at the beginning of the year could keep activity data strength supported over the next couple of weeks, according to our model projections.
Our global risk premium indicator continues to hover around neutral territory, failing to provide a strong indication of the short-term bias for overall market risk sentiment.
At the same time our MarFA™ framework suggests that some risky assets are starting to appear oversold, opening up scope for a short-term risk recovery. We initiate long Nikkei and long WTI.
…Trade ideas: Rates Highlighting US 2s10s flattener: Following a recent bear steepening in the US curve, MarFA Macro highlights US 2s10s at 7bp (0.9 z-scores) too steep. Meanwhile, US backend curves have continued to bull steepen, with USD 5s30s now showing as 8bp (1.5 zscores) too steep.
In No coupon increases through 2027? US rates insights, dated 7 March, we highlight that 2s10s steepening could have been driven by cross-market effects, specifically by German debt brake changes and fiscal plans. Given that the US curve remains quite steep relative to the current level of activity and inflation data, we find it attractive to fade recent steepening and enter into 2s10s flatteners.
This next note is from expert tetchAmentalists and when privy, always worth a look …
CitiFX Techs - US equities: 15% dip no longer unfathomable Mar 11, 2025, 4:20
US stocks have seen a dip over the past 4 weeks that have broken through multiple support levels. We are now testing a very key level of the 55w MA in both S&P e-minis as well as Nasdaq 100 futures. A weekly close below opens up the possibility of 55-200w MA setups, which would suggest >15% losses. While this is not our base case, it is an increasing risk scenario, especially when looked through from a technical lens. We discuss more below:
… Nasdaq100 futures (NQ1) A very similar picture in Nasdaq 100 futures. We have already broken below the 200d MA decisively, and are currently trading below the 55w MA at 19872. The picture remains bearish for NQ1, having already broken below the neckline of a quadruple top formation, while weekly slow stochastics continues to tick lower.
Short term: Techs for NQ1 are slightly less bearish than S&P e-minis, having already hit the 19337 target of the double top formation. Nevertheless, we still see scope for a move towards 18340 (September low) in the short term.
The risk case: Like S&P e-minis we are on track to close weekly below the 55w MA at 19872. IF we do see a weekly confirmation (though preferably multi-week or monthly, with supporting fundamentals as well), it would initiate a 55-200w MA setup, which suggests a ~19% move towards the 200w MA.
Like S&P e-minis, we are short-term bearish. Longer term, we are more neutral, and waiting for additional signals.
Germany’s fan favorite’ist stratEgerist on the day that was / will be. Context …
… On a serious note, you wouldn't want to watch a re-run of yesterday's session as the risk-off move showed no sign of abating with the S&P 500 (-2.70%) posting its worst day YTD for the third time in six sessions while the NASDAQ (-4.00%) saw its worst day since 2022. The moves cascaded across global markets, and the Magnificent 7 (-5.41%) even moved into bear market territory, having now shed more than -20% since its peak back in December. Even before the tariff news escalated this month, the Mag-7 had been underperforming. In February when the S&P 500 was down -1.42% the Mag-7 declined -8.77%. I think the Deep Seek news was much bigger than people gave credit for after the initial attention calmed down …
… While big tech led the losses, the slump broadened as the session went on, with cyclical stocks underperforming. The small cap Russell 2000 (-2.72%) closed at its lowest level since last June and the S&P 500 growth index (-3.80%) had its worst day since September 2022, with investors seemingly more wary on the risks of a downturn after Trump's comments over the weekend. In turn, volatility continued to escalate, with the VIX index (+4.49pts) closing at a new 2025 high of 27.86pts. Current losses for the S&P 500 (-8.62% from the peak) have now surpassed the moves last summer, when the index fell -8.49% from peak-to-trough. This now makes it the largest selloff for the S&P since 2023. And unlike last summer, yesterday did see the S&P 500 close beneath its 200-day moving average, which is the first time that’s happened since 2023 as well. This morning US futures initially fell a further percentage point but have subsequently rallied back with the S&P 500 and NASDAQ futures trading +0.26% and +0.15% higher respectively as I type.
With US equities losing ground yesterday and growth concerns mounting, that saw investors pour into US Treasuries with the 10yr yield falling -8.8bps to 4.21% and trading another -3.8bps lower in Asia this morning. Meanwhile, the 2yr yield (-11.6bps to 3.88%) yesterday saw its largest decline since the vol shock last August. This has come as investors have dialled up the chance of Fed rate cuts again, pricing in 84bps by the December meeting as I type, with a +12.6bps increase yesterday followed by another +1.2bps overnight.
Yesterday's bond rally was helped by the New York Fed’s latest consumer survey, which added to evidence of deteriorating US consumer sentiment. For instance, the share of households expecting a worse financial situation one year from now rose to 27.4%, the highest since November 2023. On the other hand, the survey's inflation expectations signal was broadly steady in February, with the 1yr measure up just a tenth to 3.1%, and the 3yr and 5yr measures unchanged at 3.0%. So it didn’t repeat the huge surge in the University of Michigan’s survey, providing some reassurance against fears that inflation expectations are becoming unanchored and suggesting that growth concerns are now dominating over inflation ones. On a related topic, our US economists yesterday published a timely report (link here) discussing the hawkish and dovish considerations that are likely to influence the Fed's response to the evolving policy mix and upcoming dataflow…
Germany asking HOW (while I’m asking IF) …
DB: How should the Fed respond to an economy in "transition"? 10 March 2025
Motivated by the emergence of recession fears, the market has shifted to pricing a significantly more dovish Fed path this year. As we contemplate how the Fed is likely to respond to the evolving policy mix and upcoming dataflow – a period of “transition” according to President Trump – we recently noted that, while our baseline remains for steady rates this year, mounting downside risks to the economy could lead to Fed rate cuts (see “Tariff they neighbor”).
This note discusses a variety of considerations for the near-term Fed outlook, both hawkish and dovish. Among the issues we discuss: the difficulty disentangling tariff effects from organic price pressures; the potential for non-linear dynamics in the labor market; why the slowdown in growth could also be transitory; and the adverse effects of uncertainty on the economy and markets.
… and same firm with a weekly update ...
DB: Capital Markets Blog - The sell-off is not the double whammy it appears 11 March 2025
On the face of it, last night’s sell-off in US equity markets represents a double whammy for 2025. First, corporate investment and expansion activity tends to move with equity markets. Thus, the sell-off will have certainly caused some CEOs to become more hesitant about large investment or M&A projects. Second, the sell-off was catalysed by recession fears which, themselves, are an additional negative for corporates if consumers tighten their belts.
The upshot is that while the US equity market sell-off will undoubtedly make many CEOs nervous, it does not have the hallmarks of prior sell-offs that were actually associated with a material dip in corporate and 'uncontrollable' economic factors.
We run the numbers and show that the majority of companies have been relatively resilient in the market this year. So, even though the market is legitimately worried about very high levels of economic uncertainty at present, it is premature to predict an extended pause in corporate expansion activity and we continue to expect this to pick up materially in H2 of 2025.
… The upshot is that although the US equity market sell-off will undoubtedly make many CEOs nervous, it does not have the hallmarks of prior sell-offs that were actually associated with a serious dip in corporate and economic activity. Consider that projected earnings remain strong, credit is plentiful, and private capital backstops the market. And although economic uncertainty is very high, it is a ‘controllable’ factor for the economy – ie. It is controlled by government policymakers (predominantly Trump). That contrasts with ‘uncontrollable’ factors such as the subprime loan crisis or contagion over fears about sovereign debt.
While there are signs of weakness in the US economy, it is too early to be discussing a recession of any material consequence. As such, we continue to forecast that US corporate and capital markets activity will jump meaningfully in H2 of 2025 after the new Trump administration beds down the bulk of its policies in H1 and delivers corporates greater certainty – in whatever form that eventually takes.
… This next note reiterates that ‘ITS’ not all ‘bout tariffs … please define “IT” …
First Trust: Monday Morning Outlook - It's Not All About Tariffs March 10, 2025
It is true that tariffs are a tax. It is also true that tariff policies have been volatile…on and off again…different carve outs…different countries…phone calls that change things. All of this clearly has an impact on the market. So, we are not surprised to see stock market volatility.
However, it isn’t all about tariffs. Many major models of overall stock market valuation show that the market is expensive. The so-called Buffett Indicator, which measures the market cap of the S&P 500 as a percent of GDP, says the market is overvalued. The Shiller CAPE PE Ratio, which measures stock prices compared to trailing 10-year inflation-adjusted earnings, shows the market is overvalued. In other words, compared to history, stock prices are on the high side.
Some argue that it’s different this time. That AI, and technology in general are moving so fast, and so powerfully, that historical measures don’t work. One way to deal with this is to compare stock values and earnings to a discount rate…in other words compare the stock market to the bond market.
The Fed Model, which compares the earnings yield of the S&P 500 (the inverse of the PE ratio) to the 10-year Treasury yield or to a corporate bond yield, shows that stock returns relative to bond returns are the lowest since 2000 – the dot-com bubble…
…Back on January 6th, we published our forecast for 2025. Our expectation was for the S&P 500 to finish this year around 5,200. We have not changed our forecast. For the record, unless earnings grow much faster than the consensus expects (around 10% this year), or the 10-year Treasury falls to 3% or below, even at 5,200 the market would remain over-valued.
… oh yea, right. This very same shop helped define IT HERE last week. STOCKS were / are RICH …
Moving on, then and looking offshore for answers …
Germany's fiscal plans have hit first stumbling blocks, but markets assume the change in the German fiscal attitude sticks. The front end of the EUR curve is held up by tariff uncertainty, but the path is to a 3% handle for 10y Bunds. US Treasuries are not reacting to this, but to elevated domestic angst on a complex policy prescription laced with uncertainty
US Treasuries remain enamored by 4% as a target for the 10yr Severe risk-off and elevated volatility characterised a rough day for US markets. No Monday crash here, but certainly a slow-grind move south, extending from preliminary weakness last week. Only one way to go for US Treasureis on the back of this, as the 10yr homed in on the 4.2% area. The dominant driver here is a self-harming process coming from the complex policy prescription being shown to the markets, and the back story is one of a resurgent Europe versus a more isolated United States, or the perception thereof. Whether this sticks remains to be seen, but it's a theme that's likely to persist a bit until or unless negated by events or new information.
For the US 10yr yield, there is a natural tendency for the 4% area to be aimed for, especially given the latest mood music. Room is gradually being made for a test lower as the Fed funds future strip continues to edge lower. At the beginning of the day the terminal rate was in the 3.5% area. It's now approaching 3.25%. At the same time the 10yr swap spread has been on a re-widening tendency, acting to limit the full feed-through of the deeper rate cut expectation on the 10yr yield. This, plus the new found resilience out of Europe, is dampening the extent of movement in the 10yr yield to the downside.
For the 10yr yield to get and stay through 4%, there would need to be an even deeper rate cut discount, one that verges on outright recession. We're not quite on that wavelength yet, but watching it carefully…
… here’s a(nother)note on stocks and the over-arching impact on other asset classes …
MS Municipal Strategy: Tactics This Week: When Stocks Sneeze... March 10, 2025
...munis catch a cold. That much is old news. What's new this time? Well, as any student of the Masters can tell you: par 4s are hard. And right now, there are too many in the market. As supply stays busy, we think SIFMA is set to widen, and the 4s-5s spread may, too.
Key takeaways
Expect a busy calendar – we forecast $30bn over the next three weeks (bear/bull range of $25-33bn).
Odd-lot & SMA demand is better, but may not break through $250mm/day in the near term.
Though new issues cleaned up better, that may come at the expense of secondary offers.
The good news? Spreads are starting to widen, both in primary and secondary.
4s could finally get to a better entry point, ex-housing. Until then, we prefer a mix of 3s and 5s.
…Global equity sell-off amid recession fears; flight-to-quality supports USTs; NOK gains after stronger-than-expected inflation; miss in China CPI; JGBs bear-steepen; ECB maintains optionality; DXY at 103.96 (+0.1%); US 10y at 4.213% (-8.8bp)
A risk-off environment continued to overtake macro markets as concerns around the US economic outlook weighed on growth expectations. Recession fears grew amid comments from President Trump that the US economy faces "a period of transition." Across the globe, equity volatility continued, with most major equity indices ending Monday’s session with losses. China deflation, outsized losses in the technology industry, and uncertainty around how policy changes will impact growth all supported the equity sell-off. Accordingly, flight-to-quality bids sent UST and European government bond yields lower.
The UST curve bull-steepened amid the ongoing growth fears. Price action was little impacted by the New York Fed Consumer Expectations survey, which showed that 1y inflation expectations ticked up to 3.1% (P: 3.0%), while 3y and 5y inflation expectations remained firm at 3.0%. That said, the report also contained some worrying signs regarding growth expectations. Consumers’ year-ahead expectations about their households’ financial situations deteriorated considerably in February. The share of households expecting a worse financial situation one year from now rose to 27.4% (P: 21.0%), the highest level since November 2023. Additionally, the mean probability that the US unemployment rate will be higher one year from now rose sharply to 39.4% (P: 34.0%), its highest reading since September 2023.
With the Fed in its blackout period ahead of its March meeting and limited data releases, recession fears and equity flows seemingly dominated Treasury price action. USTs continued to bull-steepen throughout the New York session, as additional Fed easing was priced in. Ultimately, 2y yields and the belly of the curve fell ~11bp d/d, while 30y yields fell 6bp.
Though the equity sell-off overtook international markets, US equities had the worst performance. The S&P 500 fell 2.7% led by declines in the technology industry as market participants seemingly rotated out of risk-on assets into what they may consider safer areas of the stock market, or into safe-haven assets such as Treasuries. The tech-heavy Nasdaq index fell 4.0%, the largest daily decline since 2022. Brent crude oil futures also declined, falling 1.7% as recession fears and trade uncertainty weighed on demand…
Can almost sense the celebration in these words … maybe it’s just me, dunno why … generally speaking, though, am not sure economics EVER take over but …
Equity markets are not just about economics (equity analysts do not always listen to economists). However, shifting perceptions of economic risk seem to be behind recent US equity market moves. 2025 started with solid economic foundations in the US and other developed economies. The imbalances that typically trigger recessions were not evident. Consumers had low fear of unemployment and most consumer balance sheets were not under pressure.
Those fundamentals are still intact, but risks have risen. US consumers and companies are less certain about the future. The NFIB small business sentiment survey is due today. This is traditionally a Republican leaning survey, so any deterioration in sentiment would be a troubling sign (as having overcome partisan bias). There is also uncertainty about whether market moves might persuade US President Trump to change policy direction…
… same shop, different (dare I say, more adult-like) economist …
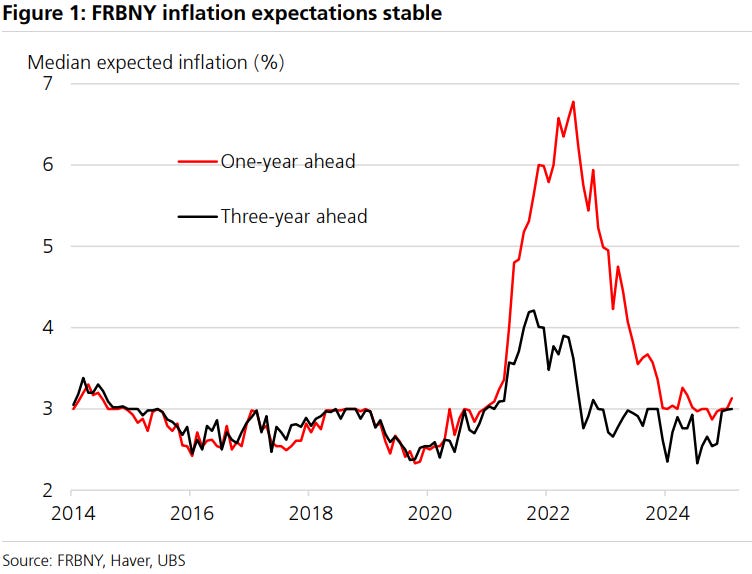
UBS: FRBNY inflation expectations hold steady 10 March 2025
All eyes on inflation expectations We are all watching inflation expectations for signs of becoming unanchored after the high inflation episode of the pandemic, recent stickiness in core inflation, and the runup in tariff threats. Long-term expectations in the University of Michigan survey increased 0.2 pp from January to 3.5% in the final February data, the highest reading for the series since April 1995. Year-ahead inflation expectations from the University of Michigan jumped 1 pp to 4.3% from January to February. FOMC members, including Chair Powell in his remarks on Friday, have nodded to the recent rise in short-term expectations, but generally maintain that long-term expectations are stable and consistent with the 2 percent inflation goal.
Today, we received another measure of survey-based inflation expectations, and this suggested stability over February. In the FRB of New York Survey of Consumer Expectations for February, at the three-year and five-year horizons, median inflation expectations were each unchanged at 3.0%. Meanwhile, the year-ahead measure rose 0.1 pp to 3.1%, within the tight range it has occupied for most of the past year. That said, median inflation uncertainty — essentially the interquartile range in inflation expectations — increased at all three horizons…
Finally, Dr BOND vigilante with a few choice words on yesterday …
Yardeni: Stock Market Vigilantes On The Warpath Mar 10, 2025
The Stock Market Vigilantes have spoken. They don't like tariffs, and they don't like mass firings of federal workers. That's because they don't like stagflation, and they fear that Trump 2.0's focus on these measures could cause a recession with higher inflation.
They really didn't like President Donald Trump's message on Sunday during an interview with Maria Bartiromo on Fox News, as evidenced by today's extreme selloff, which caused the S&P 500 to fall below its 200-day moving average (chart). He indicated that tariffs are here to stay. Only a few weeks ago, it was widely assumed (by us and others) that Trump would use tariffs as a temporary negotiating tool that would result in freer trade and a more level playing field for American exporters.
While the plunge in stock prices since mid-February is widely blamed on confusion about the implementation of tariffs, it is actually becoming clearer that Trump intends to use tariffs as a permanent weapon to force companies to produce in the United States, especially goods that he views as essential to national security, including steel, aluminum, pharmaceuticals, and semiconductors.
The result so far is a trade war with China and Canada that is likely to widen on April 2, when the Trump administration is scheduled to announce reciprocal tariffs around the world including on Europe and India. That has incited the Stock Market Vigilantes to go on the warpath, especially after Trump told Bartiromo: "What I have to do is build a strong country. You can’t really watch the stock market." Silly us: We expected him to look for positive reinforcement of his policies from the stock market.
Yesterday, we acknowledged that we can't rule out that a bear market started on February 20. The risk now is that if the selloff continues, the negative wealth effect will increase the odds of a recession, which would widen the federal budget deficit and increase the debt-to-GDP ratio. Trump has proudly observed that bond yields have declined since he took office. However, he risks inciting the Bond Vigilantes too if a stagflationary scenario gets in the way of fashioning a long-term plan to narrow the federal deficit in Washington…
…What should Trump do differently? He should settle for closing the border with Mexico and lowering oil prices for now. So far, both have been accomplished remarkably quickly. He should allow more time for his Cabinet heads to quietly and slowly pare their departments’ headcounts. Then he could focus on winning larger majorities in both houses of Congress to move forward with his Golden Age agenda….
… And from the Global Wall Street inbox TO the intertubes, a few curated links …
An(other) OpED for your dining, dancing and clicking pleasure …
Bloomberg: For your moving parts list — the selloff, Japan and Carney US stocks take another beating from Japan, while Canada’s new leader needs friends in the White House. March 11, 2025 at 5:01 AM UTC
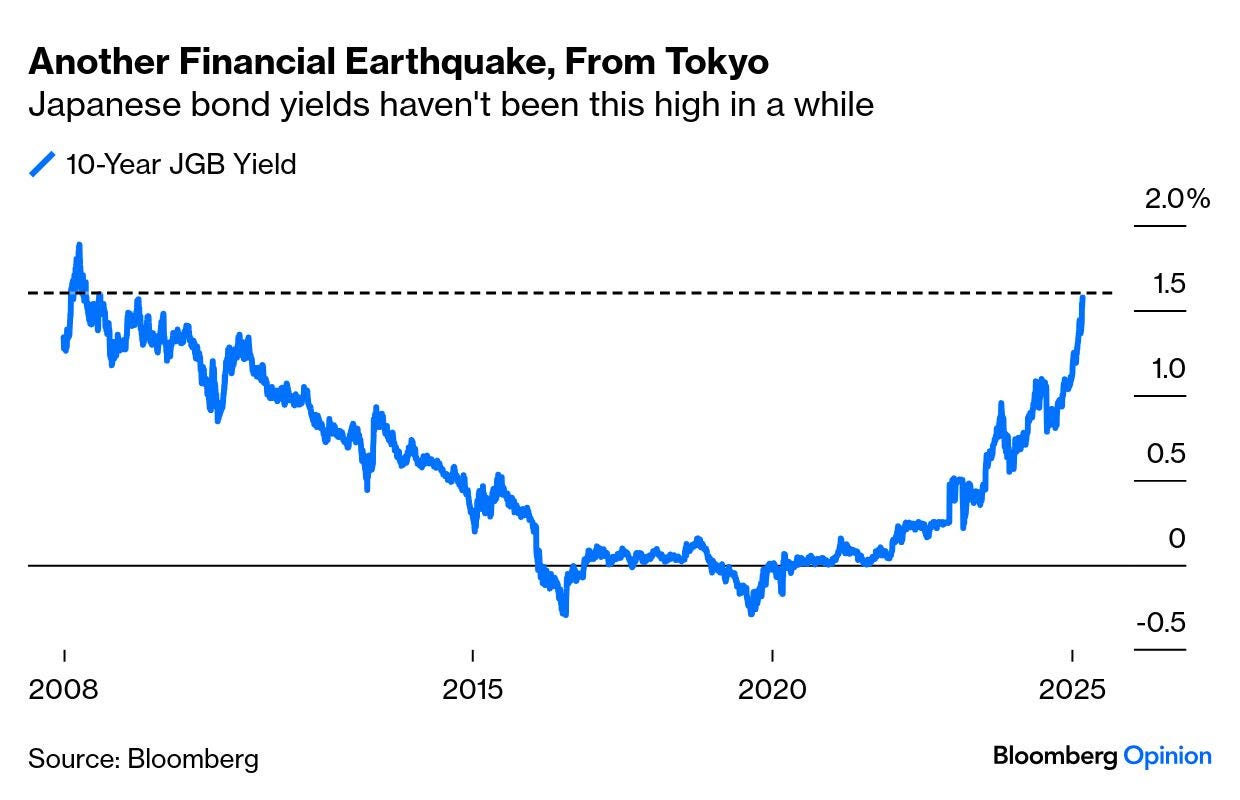
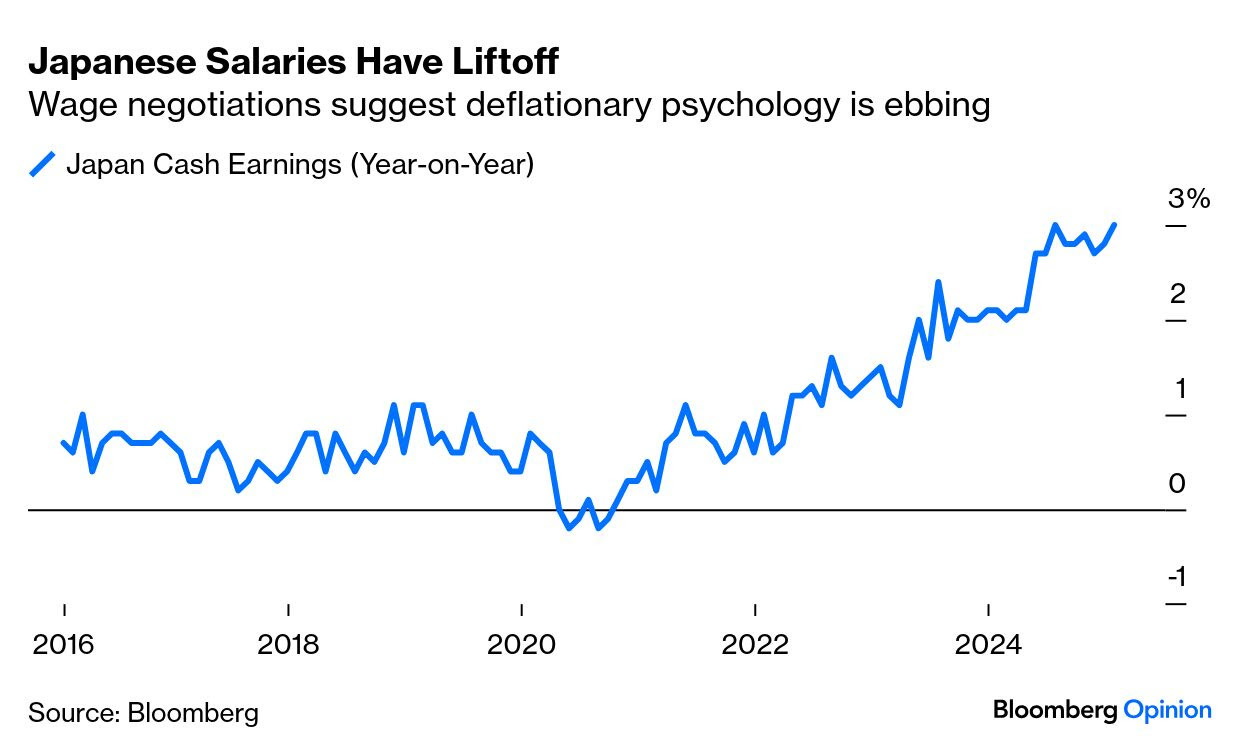
…A Butterfly in Tokyo The tectonic plates of global finance continue to move. Last week, Germany unveiled plans for the most dramatic expansion of fiscal policy since the nation reunified in 1990. Meanwhile, Japan seems to have broken out of a deflationary slump that started that same year — although nobody wants to say this too loudly. The 10-year yield on Japanese government bonds has leapt to 1.6%, its highest since the 2008 Global Financial Crisis:
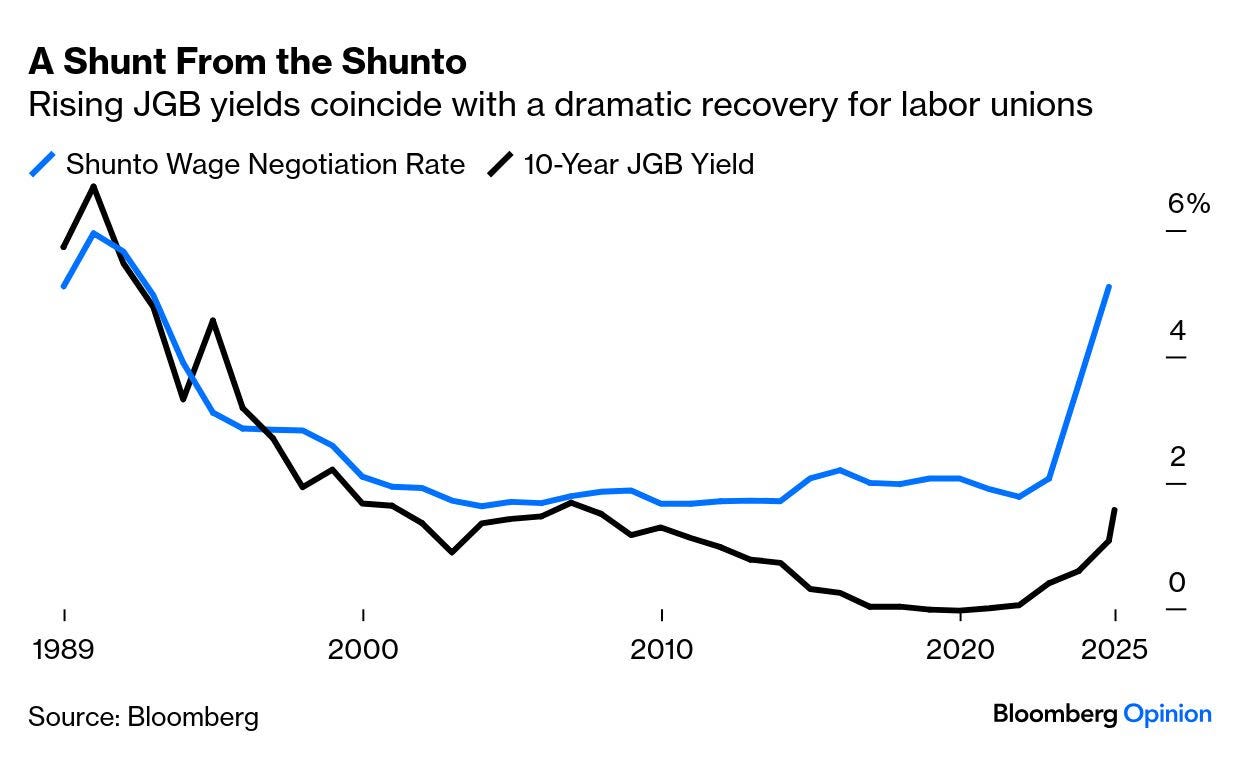
Wage negotiations are driving this. Workers have had paltry increases for a generation. But in the last two years, the annual shunto — the labor negotiations each spring — has brought the highest payrises since the slump took hold 35 years ago. That buoys JGB yields:
The latest numbers on overall increases in cash salaries spurred the latest jump in yields:
With their greaterincomes, Japan’s salarymen are far more likely to buy stuff now, and not leave it until tomorrow. That boosts inflation. It doesn’t mean that deflation is licked for certain. Albert Edwards of Societe Generale SA, known as an inveterate bear on equities, formed his views as an economist working in Japan during the early slump years. He points out that core inflation is calculated by excluding only fresh food, not all food.
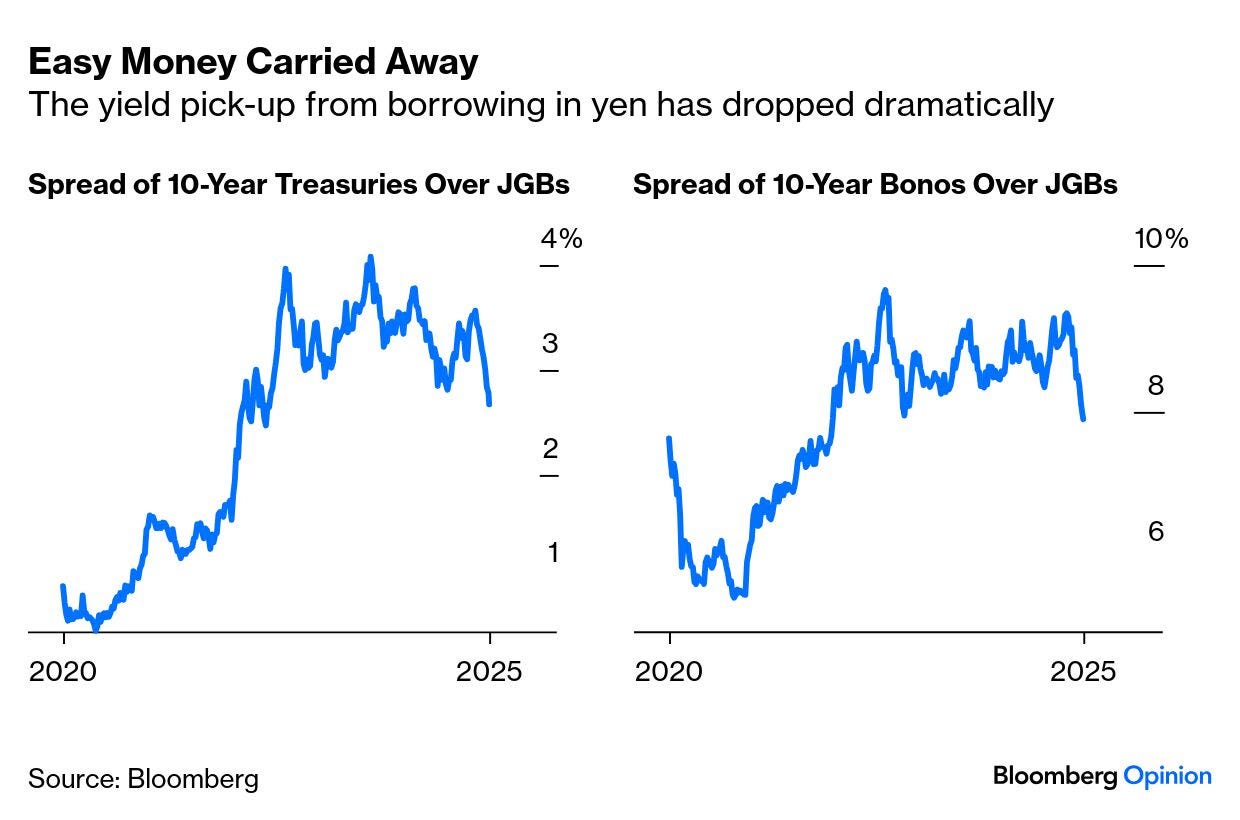
… This shift affects everyone else. Low Japanese bond yields have provided a source of cheap funding for the rest of the world— simply borrow in Japan at negative rates, park in an investment that actually pays a return, and feast on the difference. The rise in JGB yields has narrowed the differentials with other bonds — particularly Mexico, whose high rates made it a popular carry trade destination:
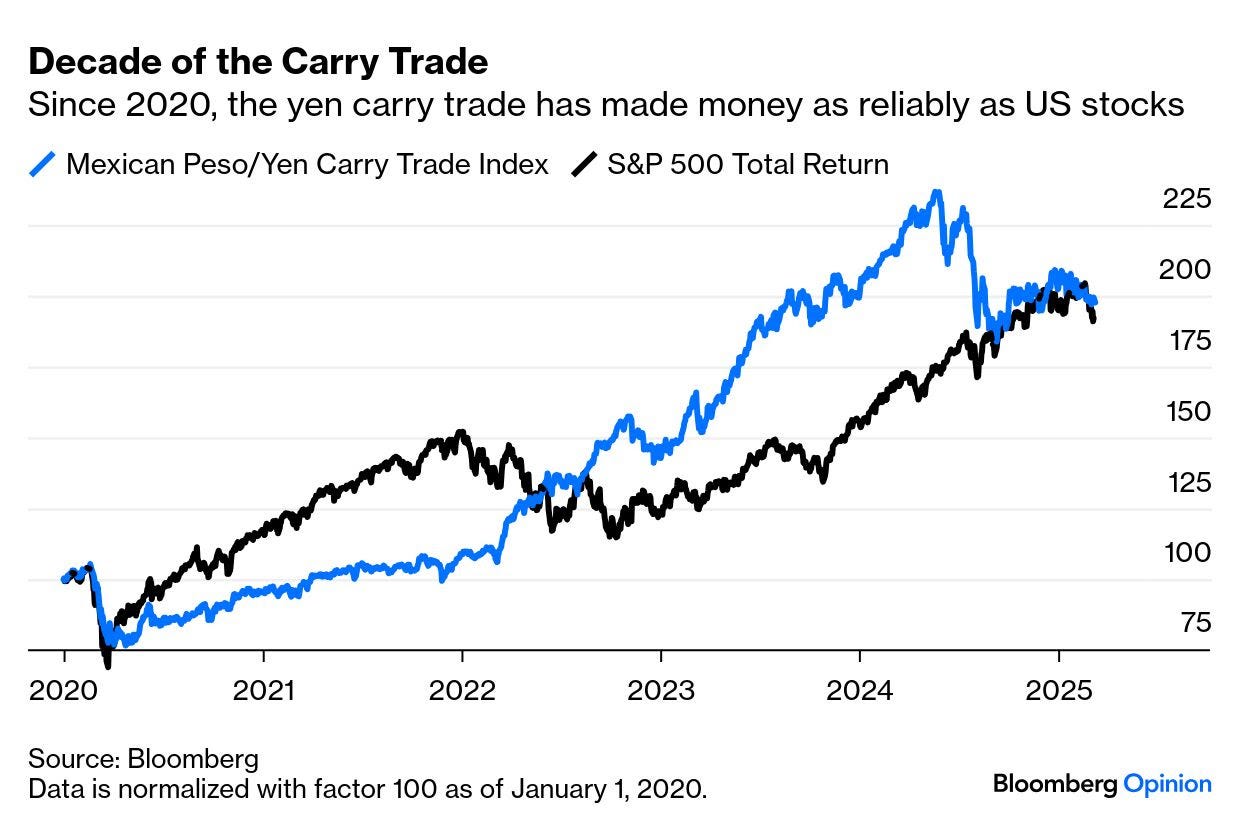
How much does this matter? Circumstantial evidence suggests that the carry trade has been hugely important. Since the turn of the decade, the total return from borrowing in JGBs and parking in Mexico has beaten the total return on the S&P 500. This is true even after the carry trade’s dramatic unwind last August, which triggered volatility across the world:
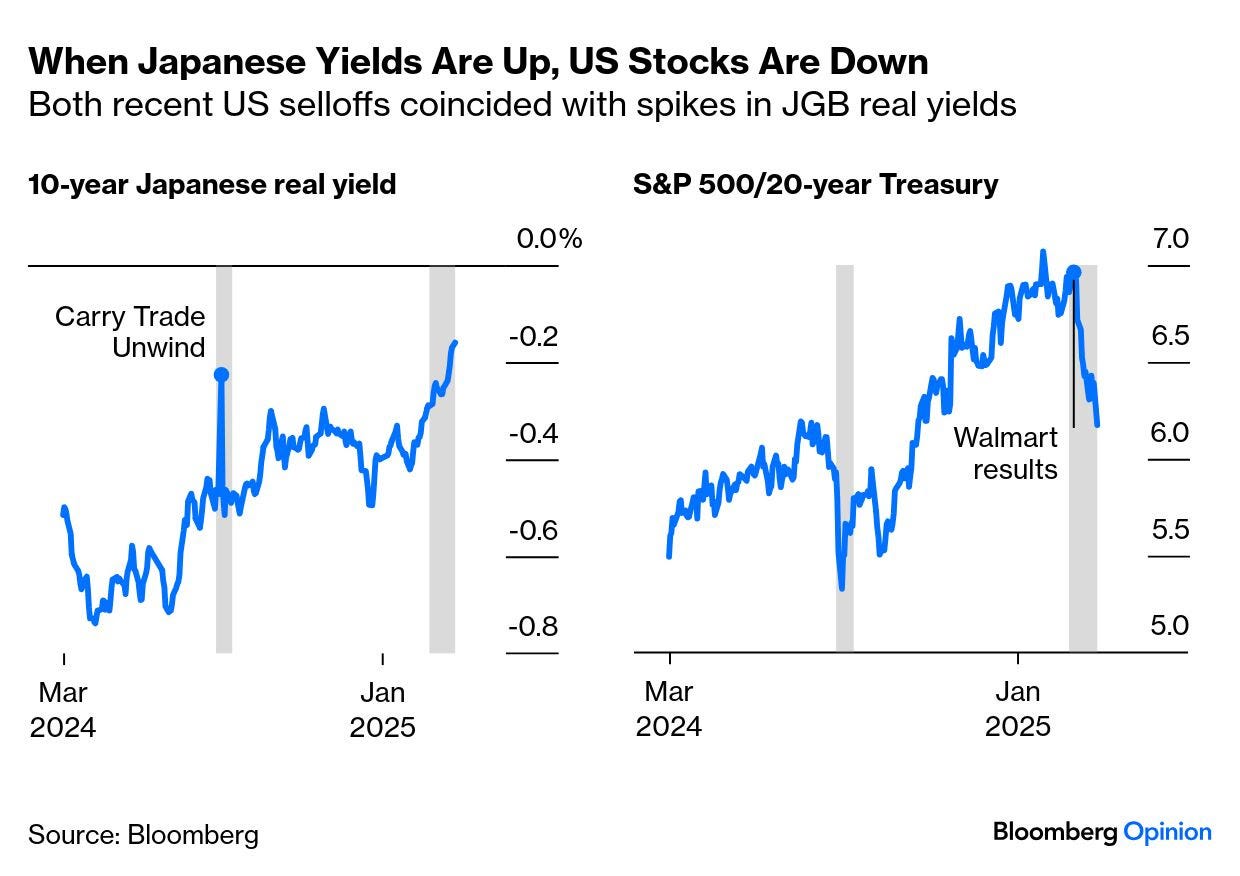
As we’ll cover next, the US stock market is in the grip of a big selloff. Correlation doesn’t prove causation, but it’s noticeable that both US corrections of the last 12 months have overlapped exactly with large rises in Japanese real yields:
That brings us to a dramatic day on Wall Street…
… Bigmouth Strikes Again
US stocks had a terrible day, probably triggered by Donald Trump’s uncharacteristically bearish soundbite over the weekend. Asked if Americans were facing a recession, he replied:
I hate to predict things like that. There is a period of transition because what we’re doing is very big.
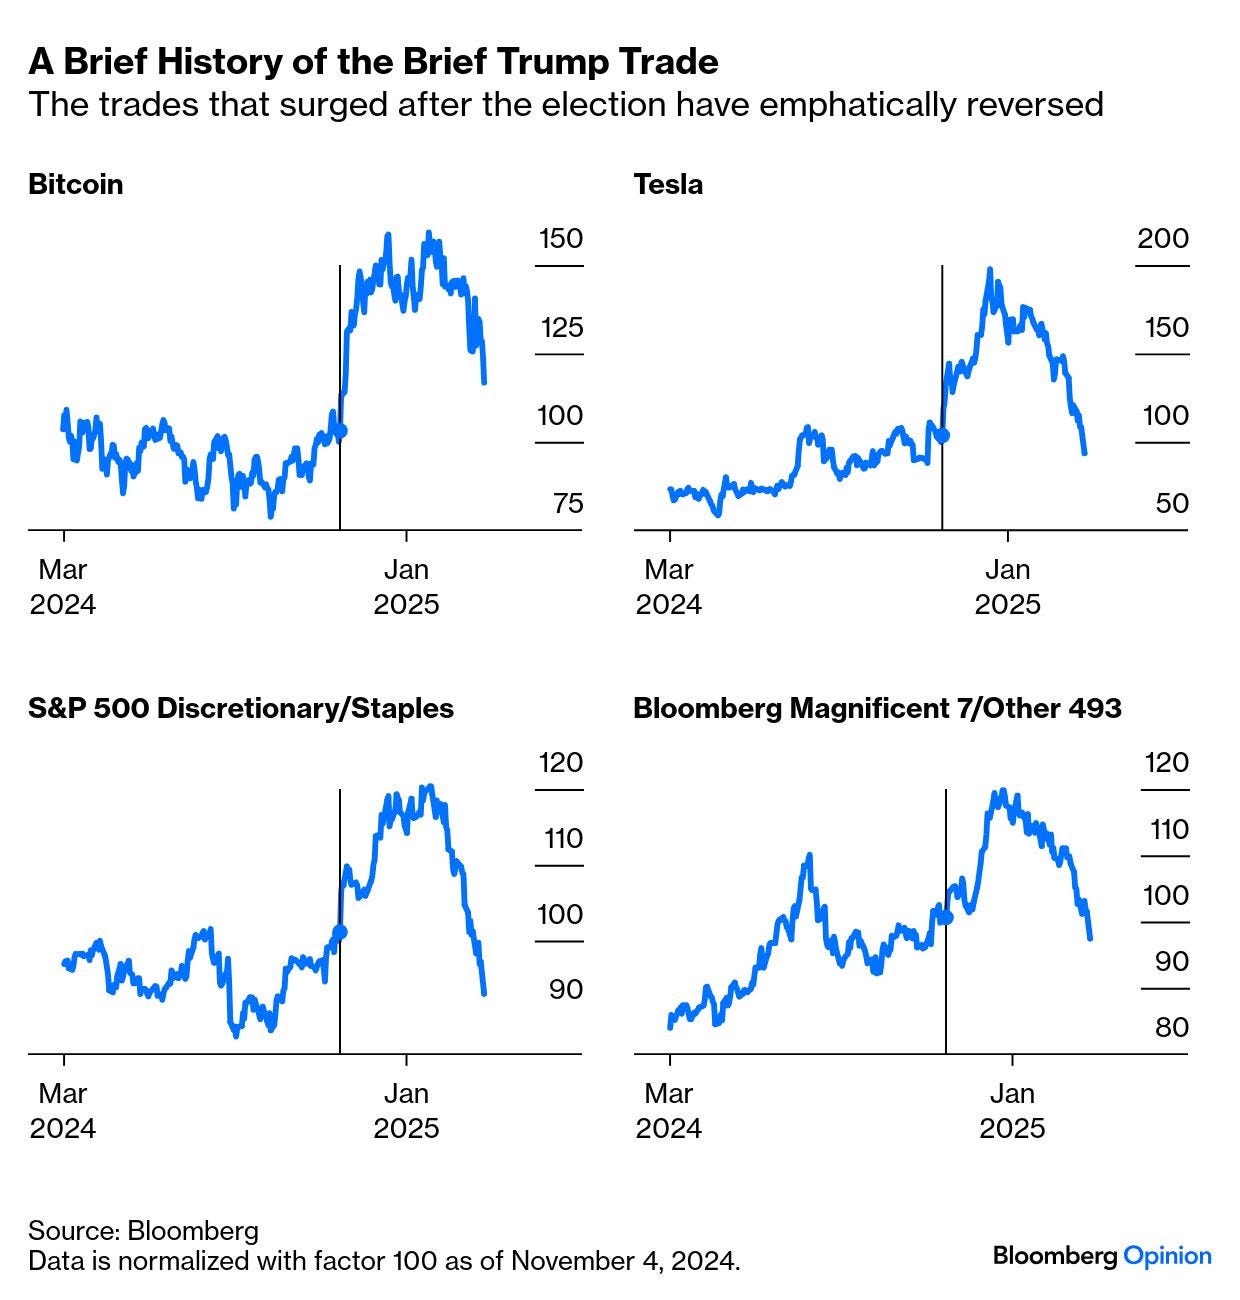
The key implication concerned the so-called Trump Put — the president cares about the stock market, and the belief has been that a selloff would prompt him to reverse unpopular policies. This sounded like he was prepared to weather a market storm — and he even said that “you can’t really watch the stock market.” It’s not what investors in the post-election Trump Trades signed up for, and the result was spectacular:
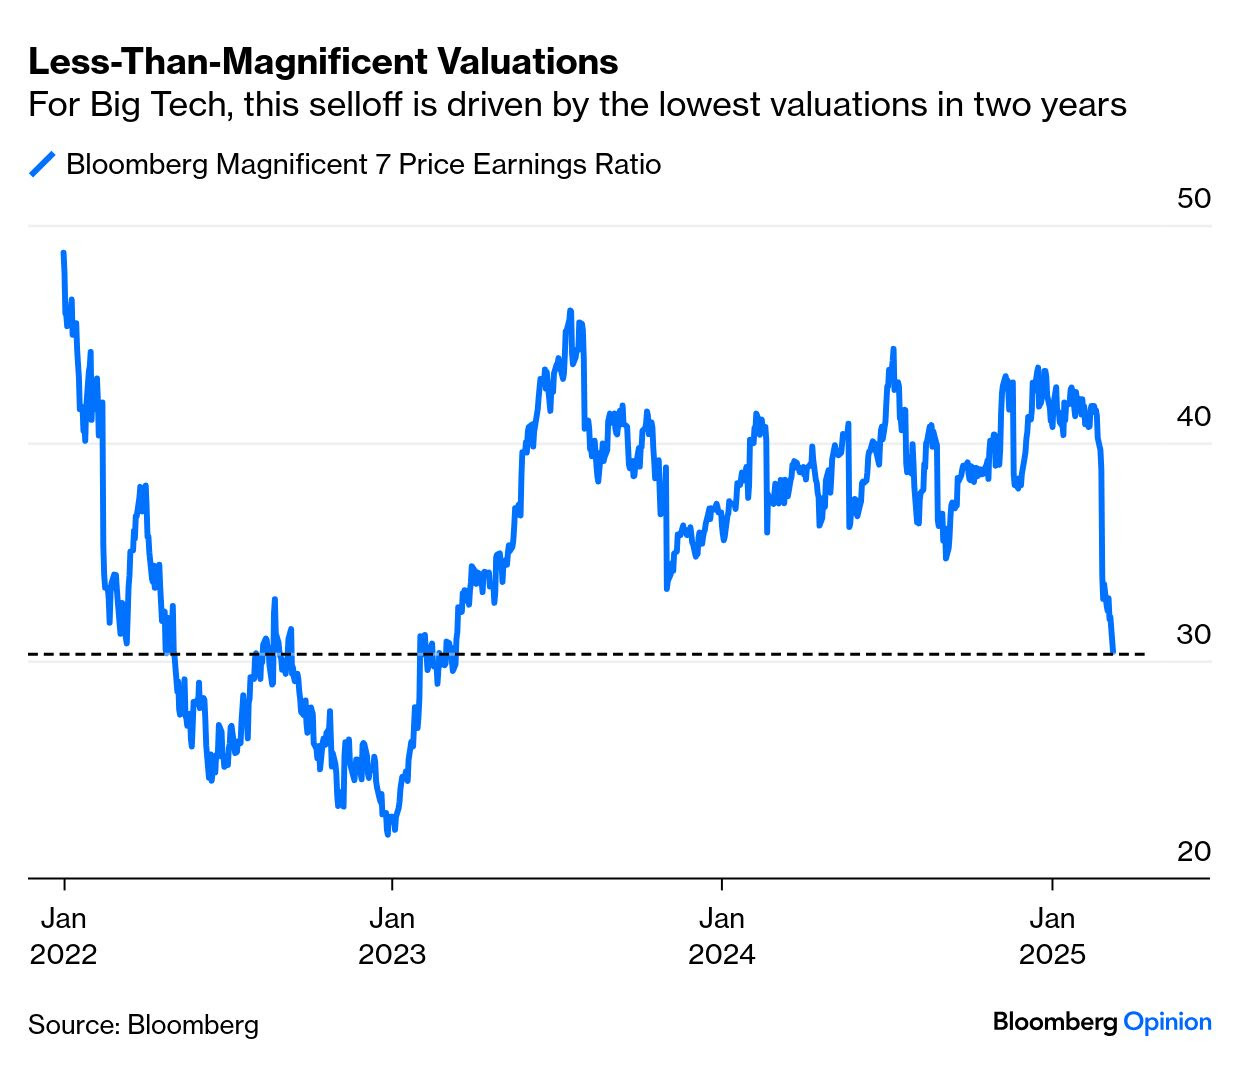
The Bloomberg Magnificent Seven index is now down more than 20% from its recent high, satisfying a popular definition of a bear market. But can this be attributed entirely to Trump, or to bearishness about the economy? The selloff has been driven above all by valuations, as investors have rushed to exit stuff that looks expensive. The Magnificents still trade at a fat multiple of 30 times trailing earnings, but that follows a dramatic fall in the last few days:
The Mag 7 companies are global, but it’s not clear that they stand to lose most from a trade war as their operations are so dispersed. What is clear, however, is that surfing on such strong sentiment, they were acutely vulnerable to a withdrawal of liquidity. That’s what effectively happened as Japanese real yields surged higher. Dhaval Joshi of BCA Research compares the Japanese real yield with the p/e of Microsoft Corp., arguably the least speculative of the Magnificents. For the last few months, they’ve looked like a perfect mirror image, with Microsoft’s multiple declining every time the Japanese real yield rises:
Source: BCA Research
Joshi is clear that causation can move both ways — if investors feel less inspired about the companies pioneering AI, the money they withdraw must go somewhere. And it’s obvious from the way the Trump comments were repeated again and again that they were the trigger for this particular selloff. But even if the tariff drama hogs our attention, it’s quite possible that the epochal shift in Japan matters more…
Are you a “PRO”? CNBC sure hopes to have you as such and so … for all the muppets …
CNBC: Goldman Sachs slashes 2025 GDP forecast on negative tariff impact Published Mon, Mar 10 2025•12:44 PM EDT
Goldman Sachs downgraded its outlook for U.S. economic growth as President Donald Trump’s trade policy has proved to be more aggressive than expected, risking higher prices and tighter financial conditions.
The Wall Street firm slashed its growth forecast on gross domestic product , a measure of all the goods and services produced across the sprawling U.S. economy in 2025, to 1.7% from a 2.4% estimate at the start of the year.
This marks Goldman’s first below-consensus outlook in two and a half years. “The reason for the downgrade is that our trade policy assumptions have become considerably more adverse and the administration is managing expectations towards tariff-induced near-term economic weakness,” Jan Hatzius, Goldman’s chief economist, said in a note to clients Monday….
Moves like yesterday ALWAYS take out key levels and are like bulls (or bears) in a china shop … Some VISUAL context …
The Bears have made a significant move, pushing the S&P 500 below the key level of 5,667, which is the highs from July 2024.
Here’s the chart:
Let's break down what the chart shows:
The black candlesticks in the top panel is the S&P 500 index price.
The green and red line in the bottom panel is the Momentum Regime (Daily RSI).
In a bullish regime, the RSI often exceeds 70 during rallies and finds support around 35-40 during corrections. In a bearish regime, it drops below 30 during sell-offs and doesn't reach overbought levels in counter-trend rallies.
The Takeaway: Over the past few months, I've been sharing my bull market checklist, emphasizing the importance of the 5,667 level in the S&P 500 for the bullish trend. However, after yesterday's trading, the bears have pushed the S&P 500 below this key level.
Not only was this price level breached, but the S&P 500 also fell below its 200-day moving average, and the momentum shifted to a bearish regime. As a result, I conducted an emergency review of my bull market checklist. Unfortunately, the findings are not favorable for the bull market: we lost another two significant components—the S&P 500 price level and momentum regime. This has now reduced the bull market checklist to just 25%.
The bears have taken control.
This environment does not promote risk-seeking behavior. This is concerning for risk assets, as we have now entered a phase where many risk assets have completed or are completing topping formations.
Will we see more selling pressure from the bears this week, or will the bulls finally show up?
… surely this ‘official’ release could NOT have helped …
FRBNY: Medium- and Longer-Term Inflation Expectations Unchanged; Consumers’ Pessimism About Their Future Financial Situations Increases March 10, 2025
February Survey: Short-Term Inflation Expectations Tick Up, Medium- and Longer-Term Expectations Remain Unchanged
Median inflation expectations increased by 0.1 percentage point (ppt) to 3.1 percent at the one-year horizon and were unchanged at 3.0 percent at the three-year- and five-year-ahead horizons.
Consumers’ year-ahead expectations about their households’ financial situations deteriorated considerably in February. The share of households expecting a worse financial situation one year from now rose to 27.4 percent, its highest level since November 2023.
Mean unemployment expectations—or the mean probability that the U.S. unemployment rate will be higher one year from now—jumped up by 5.4 ppt to 39.4 percent in February, its highest reading since September 2023.
The average perceived probability of missing a minimum debt payment over the next three months increased by 1.3 ppt to 14.6 percent, its highest level since April 2020.
… other news and related TO Friday’s NFP, a note and visual on the cost of labor …
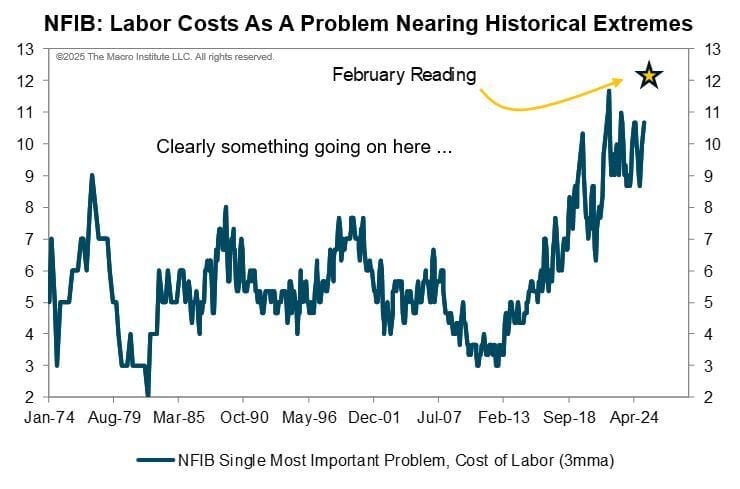
Macro Monday: Record Breaking Labor Costs? March 10, 2025
This week brings us some key puzzle pieces for the inflation picture, with February’s CPI and PPI reports dropping Wednesday and Thursday. On Friday, we’ll get the University of Michigan’s Inflation Expectations data, the same series that spiked to 4.3% in January. Was that a fluke or a real trend? We’ll soon find out.
The real headliner this week? The NFIB Small Business report on Tuesday. Quick reminder: the NFIB releases its employment data early in the month. Here’s a stat from that release that should make you sit up - last Thursday’s data showed small businesses struggling with labor costs at near-record levels. In fact, since 1974, this number has only been higher once in 614 months.
Looking for wisdom, Mr Stocks for the long run …
Wisdom Tree: Professor Siegel Weekly Commentary Markets Struggle for Direction as Uncertainty Mounts March 10, 2025
… Meanwhile, the bond market is flashing signs of caution, with the 10-year Treasury yield dipping to 4.25%—a slight inversion relative to the Fed Funds Rate at 4.33%. This signals two key factors at play: first, investors are seeking refuge in longer-duration assets amid market volatility, and second, there are growing concerns about a potential economic slowdown. While I still see the 10-year yield edging back toward 4.5% unless we see more pronounced economic weakness, the recent drop suggests that investors are going to bonds for their hedging properties.
One area I remain concerned about is the money supply. January data showed virtually no growth, which could indicate a stalling credit environment. While I’m not ready to call this a bearish signal yet, I will be watching February’s numbers closely. A prolonged stagnation in money supply growth could be a headwind for economic activity…
… and one more in the case I haven’t lost you yet …
Finally, as body bags were spotted en route to 11 Wall, NY NY 10005, I’ll leave you with this reminder …
This is bad. Don’t do ‘bad’ … THAT is all for now. Off to the day job…