ZH: Yields Surge After Ugly 2Y Auction As Foreign Demand Tumbles ZH: Ugly 5Y Auction Sends Yields To 2 Week High
… take a victory lap if you were on right side of one / both of those liquidity events … I certainly would NOT have been (decent ‘rental’ he said … !)
And moving on rather quickly so as I can put some time / space between market machinations and my feeble attempt to read charts … and speaking of ‘events’, a couple things from yesterday to consider as you get those bids in for 7yy …
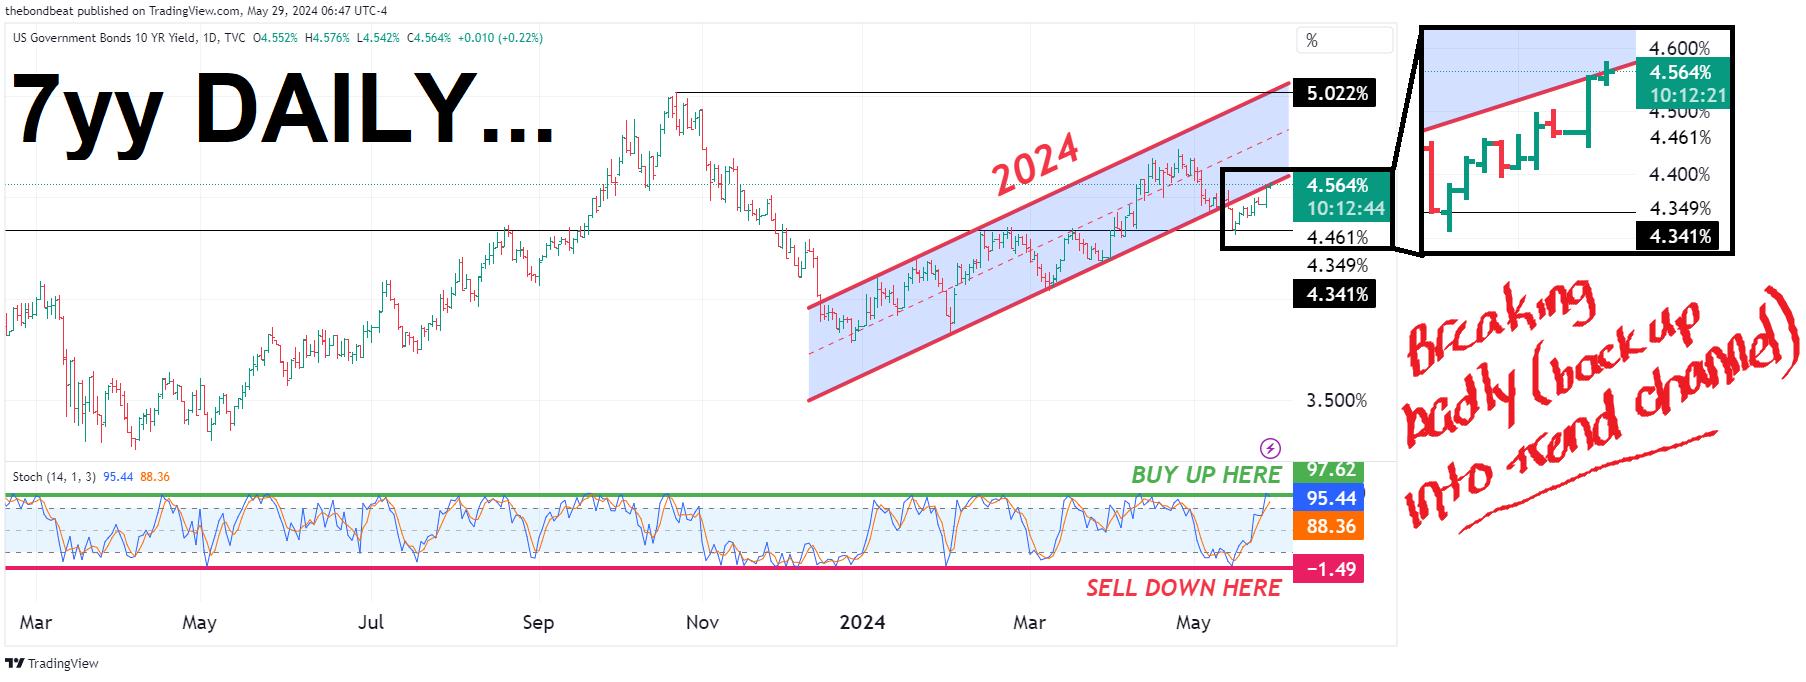
First a visual of where / how they appear setup on ‘the charts’ …
7yy DAILY (momentum overSOLD, s/t BUY signal OR …)
7yy WEEKLY (momentum not AS overSOLD but …)
Some cheapening can be viewed as a concession OR perhaps fewer on Team Rate Cut willing to support trend channel BREAK and bullish turn.
Whatever may / may NOT be the case, kindly and as always, take those charts and any / all commentary for whatever they are worth — specifically NOT MUCH …
… in as far as events which took place and helping create price action AND which you might consider …
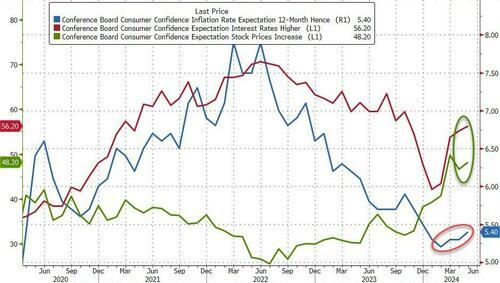
ZH: Conference Board Consumer Confidence Rebounds In May... As Inflation Expectations Hit 2024 Highs
… Conference Board Inflation Expectations (for one year ahead) rose to 5.4% - the highest since Dec 2023...
Source: Bloomberg
Expectations for rates to be higher and stocks to be higher both increased.
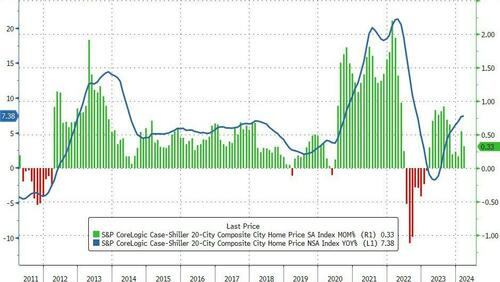
ZH: US Home Prices Reached New Record High In March, Despite Soaring Rates
Home prices in America's 20 largest cities rose for the 13th straight month in March (according to the latest data from S&P CoreLogic - Case Shiller - data today), up 0.33% (more than the expected 0.3%) with the 0.61% MoM gain In Febriary revised down to +0.55% MoM.
...but with rates remaining above 7%, it seems hard to believe prices can continue their advance.
… here is a snapshot OF USTs as of 705a:
… HEREis what this shop says be behind the price action overnight…
… WHILE YOU SLEPT Treasuries are steeper and cheaper despite softer indication of German inflation from regionals, supply pressures in Europe keeping core rates on the back-foot. Decent buying in franchise was seen however, but some fingerprints of exhaustion in the bull-steepener camp were noted (20y outperformance). Mixed APAC equity performance was seen (SHPROP +0.3%, HSI -1.8%, NKY -0.8%), while Crude continues to power higher past $80/bbl, with Copper futures flat overnight. The DAX is softer in early trade -0.8%, with S&P e-minis showing -0.5% here at 7am. UST volumes are running ~105% net of rolls.
… and for some MORE of the news you might be able to use…
NEWSQUAWK: US Market Open: Equities in the red, EUR softer post-German State CPI & Crude continues to rise; Fed speak due … Bonds are softer in a continuation of the prior day’s losses, Bunds pare most of the post-German State CPI upside … USTs are modestly softer, following the prior day's soft 2yr and 5yr outings (7yr later today); Treasuries are off worst levels, in tandem with upticks in Bunds following the German State CPI figures.
Finviz (for everything else I might have overlooked …)
Moving from some of the news to some of THE VIEWS you might be able to use… here’s SOME of what Global Wall St is sayin’ …
BARCAP: March house prices increase amid signs of deceleration (price INCREASE or signs of DECELERATION … tell me what it is YOU see … another report which appears to allow one to choose their own outcome best suited TO a P & L or a view…)
The FHFA and S&P CoreLogic CS 20-City indexes increased in March, growing 0.1% and 0.33% m/m, respectively. Both indexes showed signs of deceleration after strong gains in the prior month.
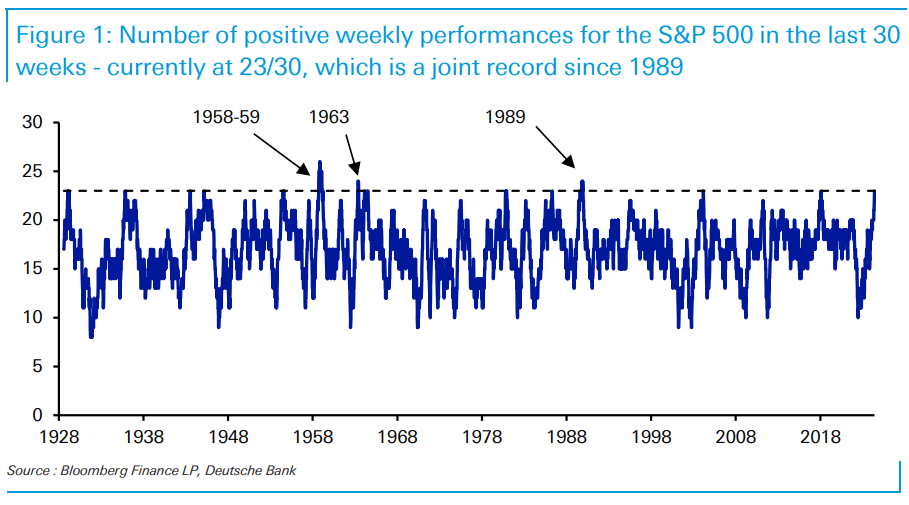
After another run of 5 consecutive weekly gains, the S&P 500 is in rarefied historical territory again. For example, the index is now up for 23 of the last 30 weeks, which is a joint record since 1989. And if this week ahead is positive again, it would mark 24/31 weekly advances, which would be a joint record back to 1963…
…A more concerning theme is that a few of these happen shortly before recessions – a last hurrah for equities if you will. In fact by March 1929, the S&P 500 had gone on a run of 23/30 gains, just like today, yet the Wall Street Crash happened six months later. Likewise in December 1989, it had been on a run of 23/30 gains, but the economy was in recession within the year. It’s the same in March 1945, where the 23/30 weekly rally ended just as a recession was beginning.
So are markets rallying on the lack of a recession, or is this the last gasp before the next recession? Either way, the chart shows that we’re nudging up against what would be the most relentless run of gains in history.
The entertainment from the US Dallas Fed manufacturing survey comments did not disappoint. Several would be met with a disparaging “OK, boomer” if only the TikTok generation read the Dallas Fed manufacturing survey. Today’s anecdotes come in the form of the Federal Reserve’s Beige Book. These comments are indirect quotes, and sanitization reduces entertainment value. Remarks on prices and pricing power are still likely to be investors’ focus…
Wells Fargo: Mixed Messages in Consumer Confidence Report
Summary F. Scott Fitzgerald famously observed "the test of a first-rate intelligence is the ability to hold two opposing ideas in mind at the same time and still retain the ability to function." Mr. Fitzgerald might be the only one not confused by the contradictions in today's Consumer Confidence report.
Wells Fargo: Do We Have Potential?: An Analysis of U.S. Potential Economic Growth
As noted in Part I of this five-report series, an economy's potential rate of economic growth is determined by growth in its labor force and its underlying rate of labor productivity growth. Labor productivity growth can be further disaggregated into three components (growth in the capital stock, changes in labor “composition” and changes in total factor productivity). We focus on the outlook for total factor productivity and its impact on U.S. productivity growth in this fourth installment of the series.
Financial conditions are significantly easier than when the Fed started raising interest rates in March 2022, see chart below.
The strength in the stock market is partly driven by strong earnings, including from NVIDIA. But the stock market is being boosted by more than strong earnings and the prospects of AI lifting future GDP growth.
Since the Fed pivot in November 2023, when the FOMC started talking about cuts instead of hikes, the S&P 500 market cap is up $9 trillion. For comparison, consumer spending in 2023 was $19 trillion. In other words, in a few months, the household sector has experienced a windfall gain corresponding to about 50% of last year’s consumer spending!
Combined with continued easy fiscal policy via the Chips Act, the Inflation Reduction Act, and the Infrastructure Act, it is not surprising that employment growth and inflation have been reaccelerating in 2024.
In short, why is the economy still so strong? Because fiscal policy is still a significant tailwind to the economy, and easy financial conditions have been offsetting Fed hikes.
Looking ahead, with the stock market hitting fresh all-time highs and fiscal policy still supportive, the expectation in markets should be that the economy will continue to accelerate over the coming quarters.
You can call this the Fed Cut Reflexivity Paradox: The more the Fed insists that the next move in interest rates is a cut, the more financial conditions will ease, making it more difficult for the Fed to cut.
Bloomberg: Catalyst Quant Fund Shorts 10-Year Treasuries as Key Macro Bet
Strategy is buying Treasury bills and short-dated IG credit
US government borrowing also likely to pressure bonds: Miller
A top-performing quant fund is shorting five-to-10 year US Treasuries on expectations that interest rates will stay on hold this year as prices remain elevated.
The Catalyst/Millburn Hedge Strategy Fund is selling Treasury futures while buying short-dated bills and corporate debt. The positions reflect a view that markets may be overestimating the odds of the Federal Reserve’s rate cut, while potentially overlooking the pressure on longer-dated yields from a ballooning US deficit…
… Catalyst’s fund is buying T-bills and short-dated corporate debt such as those sold by Apple Inc. and Microsoft Corp. to take advantage of the yields on offer at the “very front of the curve,” according to Miller…
Bloomberg: Hedge Funds Split Over Stocks' Move From Here
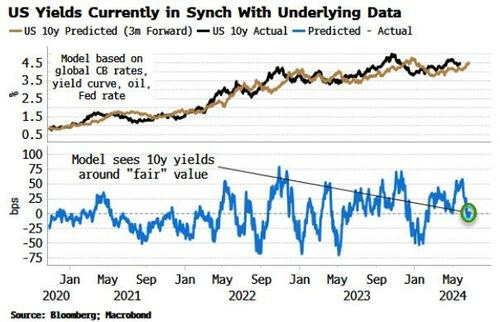
… Yields look around fair value, so there are no immediate and obvious ex ante catalysts why stocks should be knocked back by a bond selloff.
Excess liquidity remains supportive for the equities.
It’s conceivable the market keeps grinding higher in the coming weeks, squeezing any CTAs who may be outright short equities (or other assets negatively correlated to the stocks).
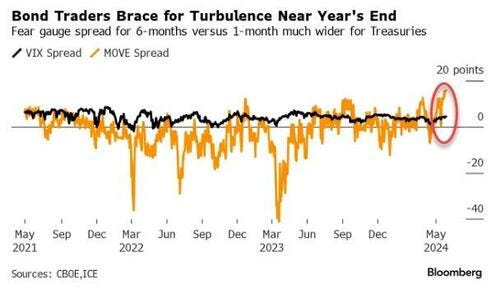
Bloomberg: Bond Traders' Angst Around Election Time Higher Than For Stocks (uncertain of the move but knowing there’ll be a move ‘round election…)
… The so-called fear gauges for Treasuries are showing the widest gap since 2014 between expectations for yields swings six months from now and the expectations for a month ahead. That’s similar to the picture for a range of currencies - the yuan’s 6 month-1 month volatility gap is the widest since 2016.
Equities look far less concerned, with the similar spread for the VIX only around the highest this year.
Bonds, and currencies for that matter, also have more than just the election on their plate when they look ahead toward the concluding weeks of 2024. Traders are seeing the November-December period as crucial for the Fed’s easing cycle, if it does indeed turn up this year.
ECB rate cut expectations have rebounded at the start of the week on the back of more dovish ECB comments. Friday's flash CPI may not change plans for June, but determine the guidance beyond. In the US, a beat in consumer confidence helped lift rates, underscoring that prospects of one 0.2% PCE print alone are unlikely to rein in a bearish undertone …
… US data still underpins upside risks to rates in the near term US markets are also looking forward to Friday’s PCE release, but have started the week focusing on US Treasury supply where new 2Y and 5Y notes were sold yesterday. The 2Y yield had moved back closer to 5%, which had already acted as a ceiling for the front end in April as odds of hikes remain low even as they are still not ruled out by officials. On the other end, we think it should stay in this area unless there is a bigger downside surprise in macro data. Consumer confidence yesterday was the main release to watch – and it delivered a positive surprise beating all expectations. For the curve – 2s10s – that means it could turn out more directional from the long end again after the front end retook the driving seat for a brief period over the past week, bear flattening the curve.
As for Friday's inflation figure, the market is looking for a 0.2% month-on-month reading in the core PCE, but it’s a close call with the average forecast at 0.25%. And even if we got a 0.2% we think the Federal Reserve would need to see a series of prints at 0.2% or lower before considering a cut, leaving ample time for uncertainty and an upside bias in rates to be maintained (other things equal) until we get the next inflation prints…
Jim Paulsen: Investors can only hope the Fed keeps stirring monetary uncertainty (yea THAT guy … up here on ‘Stack)
… The investment community is suffering from acute Monetary Uncertainty. And that’s Good News for investors!
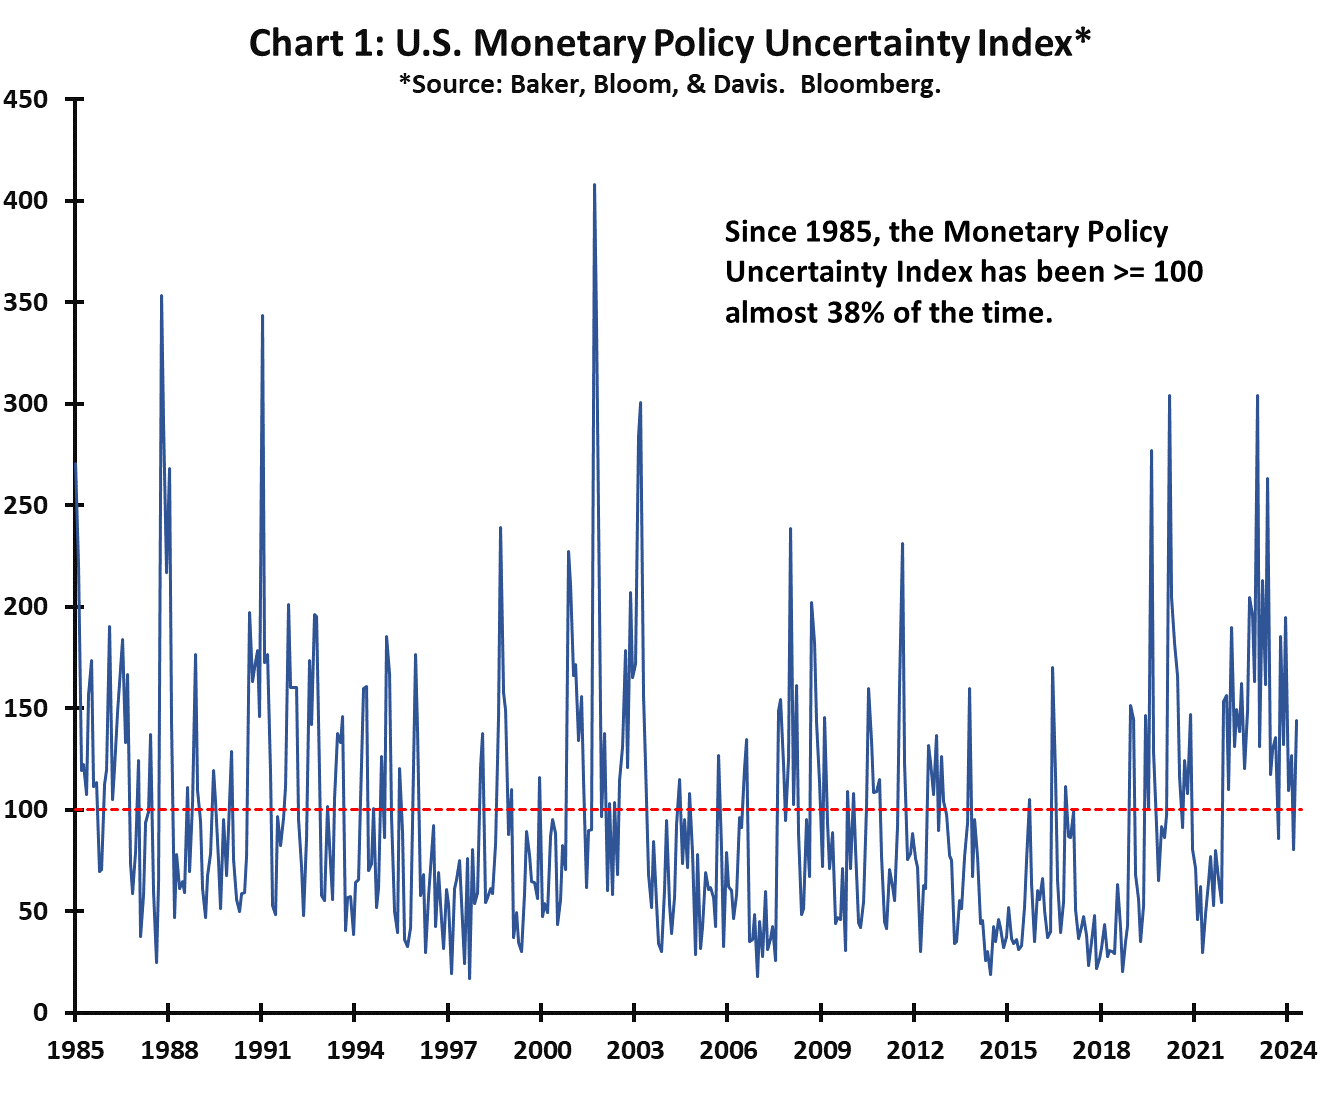
Monetary Policy Uncertainty Index
Chart 1 shows the Monetary Policy Uncertainty (MPU) Index since 1985. To measure policy-related monetary uncertainty, the index quantifies newspaper coverage from 10 large U.S. papers discussing monetary policy uncertainty and also incorporates the degree of dispersion between individual forecasters’ predictions of various economic variables. The higher the value of this indicator, the greater degree of monetary uncertainty.
Since 1985, the MPU index has averaged 96.6, but since 2020 it has been above average nearly 70% of the time. In recent years, monetary uncertainty has become almost perpetual. Indeed, the latest MPU index reading for April is just shy of 144, higher than 81% of the time since 1985. For anyone who watches financial TV, follows the financial press, or monitors financial tweets, discussions of the Federal Reserve and monetary policy have been nonstop.
This sounds concerning. Nobody knows in what manner and when the Fed may act. Will they wait too long to ease and cause a recession? Or could they ease prematurely allowing inflation to regain vigor? Understandably, the chronically elevated MPU Index has probably caused a number of investors to scale back risk-taking and chill in a safe spot until some of these issues are resolved. Historically, however, that would be a mistake.
MPU Index and the Stock Market
As shown in chart 2, times of persistent uncertainties surrounding Fed policies have proven to be a good time to be invested in the stock market. Since 1985, when the MPU index was greater than or equal to 100 (a level highlighted by the red dotted line in chart 2 and exceeded 38% of the time since 1985), the forward 1-month average annualized total return for the S&P 500 Index was 19.1% compared to only 9.1% the rest of the time. Apparently, rather than keeping your powder dry when uncertainties surrounding the Federal Reserve escalate, investors should embrace the “Wall of Worry” providing a foundation for the stock market whenever the Fed captures center stage.
Fortunately, the current Federal Reserve and their Chairman Jerome Powell, have been excellent at keeping the MPU Index stoked.
… If there is one thing that stands out in this chart it is that this series was NOT flagging recession heading into the pandemic recession (despite prior Fed tightening). We will never know, but perhaps that one could have been a soft landing?!? Irrespective, this is one to keep an eye on. Happy Tuesday. FT


Fascinating letter !!!
Great information !!!