while WE slept: USTs cheaper, belly leading on above avg volumes; "A Market Chart Or A Rorschach Test"
Good morning … Not much over the weekend since hitting SEND HERE and so …
Bloomberg: Traders Lean Toward Two Quarter-Point Fed Rate Cuts in 2024
Markets price 60 basis points of rate cuts for the year
Investors look ahead to US inflation data on Wednesday
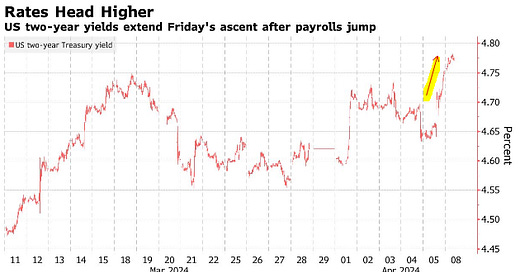
… Treasuries fell on Monday along with major peers, sending the two-year yield up two basis points to 4.77%.
At the start of the year, expectations were widespread that the Fed’s 11 rate increases in the past two years would not only curb inflation but also cause economic stress. Instead, progress toward lower inflation has slowed, growth metrics have remained robust, and investors continue to shovel money into stocks and corporate bonds at a pace that suggests the economy doesn’t yet require lower rates…
AND SO … here is a snapshot OF USTs as of 705a:
… HERE is what this shop says be behind the price action overnight…
… WHILE YOU SLEPT
Treasuries have extended Friday's losses overnight with the belly of the curve leading lower this morning (2s5s30s +1.5bp) as weekend hedges may be getting unwound. DYX is little changed while front WTI futures are lower (-0.75%). Asian stocks were mixed, EU and UK share markets are mostly higher (SX5E +0.43%) while ES futures are showing UNCHD here at 6:55am. Our overnight US rates flows saw a block seller of 3k UXY during Asian hours with prices going into the London crossover near their lows of the session. In London, the desk reported that they've seen few/no dip buyers (a break from recent activity) after Friday's bearish range breakouts. As London colleagues noted, there's plenty of supply on offer from Treasury this week for the wanting buyers (3's, 10's and 30's). Overnight Treasury volume was decent at ~118% of average all across the curve...
… and for some MORE of the news you might be able to use…
IGMs Press Picks: April 08 2024
NEWSQUAWK: US Market Open: Geopols & US-China in focus; DXY steady & fixed benchmarks lower … Core fixed benchmarks lower in an extension of Friday’s bearish action, US yields higher across the curve
Reuters Morning Bid: Wall St eclipsed as June Fed cut in balance
Finviz (for everything else I might have overlooked …)
Moving from some of the news to some of THE VIEWS you might be able to use … and in addition TO some UPDATED WEEKLY NARRATIVES noted HERE over the weekend, here’s SOME of what Global Wall St is sayin’ …
BNP Sunday Tea with BNPP: Good is good
KEY MESSAGES
We expect March CPI to moderate to a more comfortable pace. However, risks skew toward a higher number.
In the event of a CPI beat, we think that US 10y yields can break to the topside.
Higher US yields also poses risks that USDJPY breaks higher, materially increasing the chances of Japanese MoF intervention. We like using intervention-related dips in USDJPY to build longs.
… Nonetheless, we believe risks to CPI skew to the upside, given the still present but uncertain impact of methodological changes to OER weights. In a world in which OER is printing 40bp or below, there is more of a margin of safety to the rounded m/m print. But in the current state, where we expect OER to print 45bp, an upside surprise could conceivably push the core reading to 0.4% m/m.
What does this mean for US rates? The March FOMC outcome had left us more cautious around a range break to higher yields (versus our 3.9-4.4% expected range on 10s); the injection of geopolitical concerns last Thursday brought somewhat of a reprieve to a more decisive breakout, but the jobs report now introduces clearer upside risk. On net, this leaves us more cautious around buying on dips just yet, especially with CPI to come. If the upside scenario materializes, a 0.4% core print would likely drive such a breakout and intensify uncertainty around sensible anchor levels for yields.
CitiFX Techs: US yields: Resuming the trend higher (watchin’ ‘SUPPORT’ - 2s vs 4.74-77 then 4.82, 5s vs 4.52/3, 10s vs 4.51/4 and then bonds)
Blowout jobs data on Friday means that US yields have closed above significant levels on a weekly basis. This paves the path for a base case of higher yields. The caveat: Amidst short Treasury positioning, the current hawkish Fed pricing, and the potential emergence of dip-buyers, we also flag significant risk of a squeeze.
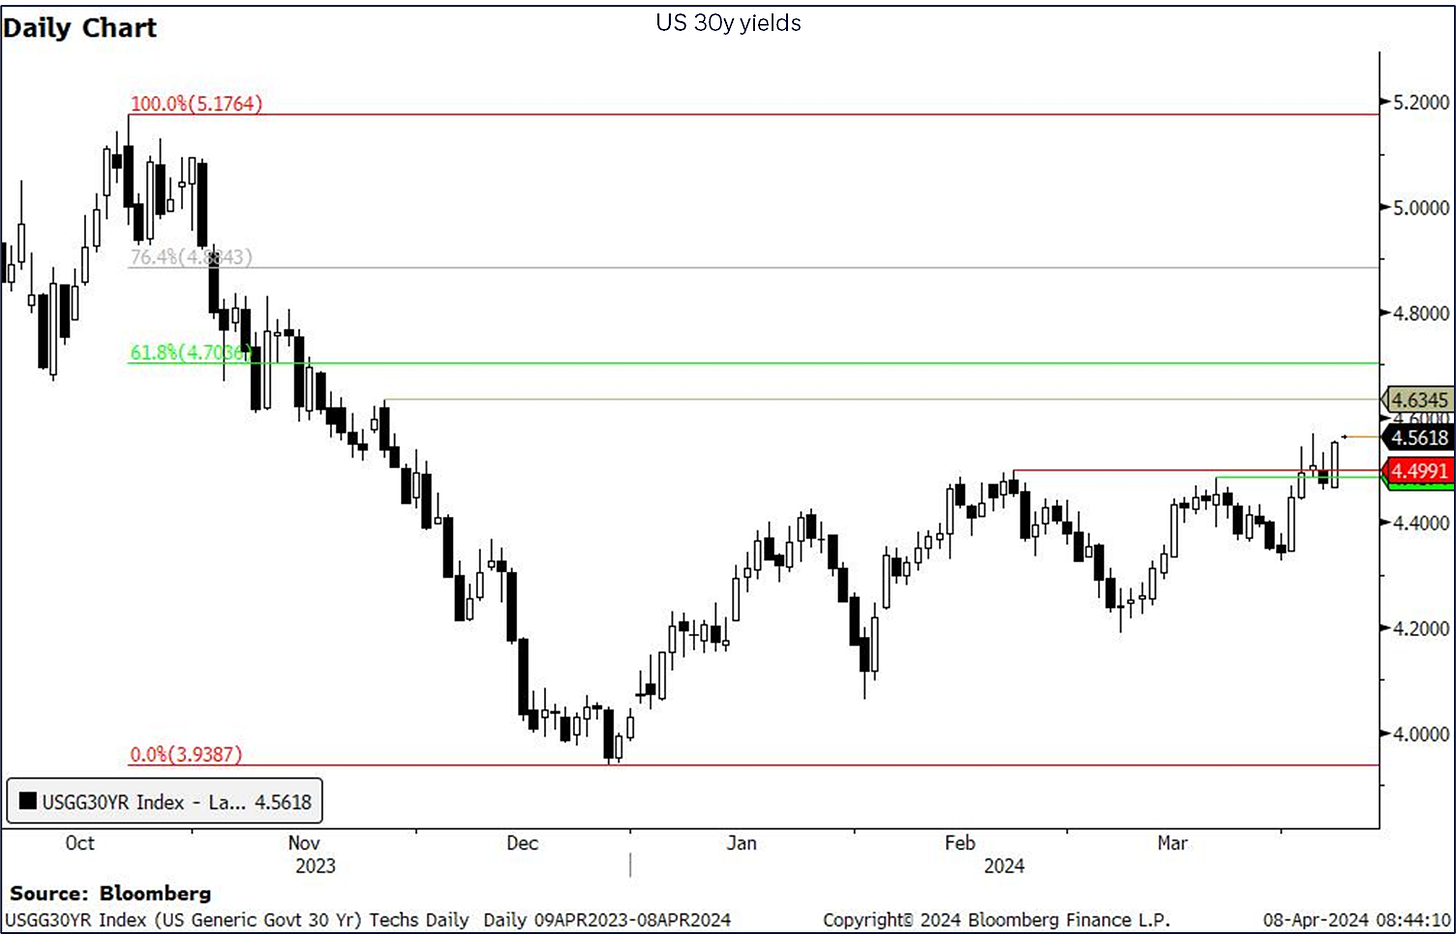
…US 30y yields:
Yields are firmly 4.49-4.50% resistance level (February and March highs, psychological level). The next interim resistance level to watch is at 4.63% (November 27 high). We think resistance at 4.70% (61.8% Fibonacci and psychological level) will be stronger. Support is likely at 4.36% (200d MA).DB: Early Morning Reid (rough start to the qtr … )
Markets had a rough start to Q2 last week, with the S&P 500 (-0.95%) posting its worst weekly performance in 3 months, whilst the US 30yr yield (+21.0bps) saw its biggest weekly rise since October. Several factors were driving the selloff, but geopolitical tensions played a key role, as fears mounted about some sort of escalation in the Middle East. That meant Brent crude oil prices rose for a 4th consecutive week, surpassing $90/bbl for the first time since October. And in turn, that’s led to growing concern about inflation, with investors continuing to price out the chance of rate cuts from the Fed. Indeed, as of this morning, just 62bps of rate cuts are priced in by the December meeting, which is a long way from the 158bps expected at the start of the year…
DB: Is today's Fed still priced more dovishly than last year? (note about HY and IG but a visual I thought worth passing along …)
Despite a major YTD rally in asset prices, the bearish “no 2024 Fed cuts" narrative persists. And this narrative has been heightened in recent days, particularly from Fed Chair Powell’s comment that the Fed is in “no rush to cut rates”, coupled with last Friday's reasonably warm employment report.
However, we think a focus on 2024 cuts is too narrow. Risky assets remain robust because the market is still pricing 6 Fed cuts by the end of 2026, which is meaningfully more dovish than the Fed of last Summer and Fall (Fig 1). Risky assets are still benefitting from last November's Fed pivot, as the market has substituted fewer 2024 cuts with more 2025 cuts, especially post the US Presidential election…
MS Sunday Start | What's Next in Global Macro: The US Election and Inflation: Too Early to Call
Inflation in the US has been critical for markets. Covid had many profound effects on the economy, including a historic spike in inflation. The Federal Reserve and other central banks embarked on a sharp monetary policy campaign, raising interest rates globally, in stark contrast to the preceding decade of low and often negative rates. Now, inflation has fallen closer to – but still uncomfortably above – the inflation target, prompting debate about how the yield curve can and should respond. So, it's not surprising that we, like many investors, are focused on what the upcoming US election could mean for inflation.
In our view, while there are clear equity sector impacts that hinge on the election, it is still too early to be convicted of macro market impacts…because it's unclear that the policy choices will move the needle on inflation….
… While we fully expect macro market opportunities around the US election to emerge, for the moment we remain more focused on potential impacts to be found in key equity sectors. In contrast to the macro picture, the policies that we believe might result from a potential Republican-win scenario translate to more easily discernible equity market impacts. For example, our colleagues expect that delaying certain TCJA expirations will provide a fundamental tailwind for areas like Industrials, Tech, and Health Care.
MS The Weekly Worldview: The 1990s … a precedent for the unprecedented?
The recovery and expansion following Covid lacks a clear precedent, but we have repeatedly said the 1990s should not be overlooked for possible lessons.
MS The Oil Manual: Incorporating Geopolitical Risk
Our assessment of the oil market's fundamentals remains the same, which previously underpinned our forecast for $90 Brent. When it comes to geopolitical risk, however, even small probabilities can add several dollars to oil prices. We raise our 3Q forecast to $94/bbl to reflect some of this.
UBS (Donovan): The economics of getting thin
The proportion of adults with obesity has doubled since 1990. GLP-1 drugs offer treatment for obesity, and can also be used "recreationally" by people who are not obese but wish to lose weight for aesthetic reasons. These different uses have different economic consequences.
Obese and recreational users of these drugs will redistribute spending (giving to pharmaceutical companies, taking away from other areas of the economy). Savings rates may fall to partially finance medication (a modest net economic stimulus). • Obese patients taking these drugs should become more productive employees—being less subject to prejudice, less likely to be absent from work, and more likely to be productive at work. Recreational users of these drugs may also experience some of these benefits.
Social prejudices around weight, the high income threshold to use these drugs recreationally, and the amplification of social media may increase divisions in society.
… And from Global Wall Street inbox TO the WWW,
Academy Securities / Tchir (via ZH): A Market Chart Or A Rorschach Test
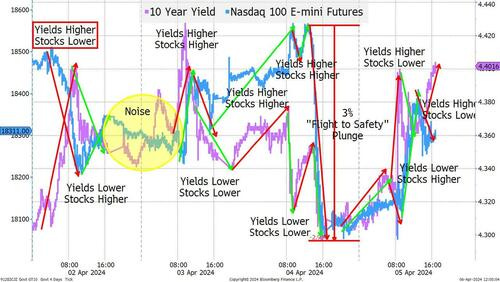
In one way, the week was quite simple. The S&P and Nasdaq dropped around 1% while 10-year yields popped 20 bps. Rate cut projections were slightly reduced and the likely start time was pushed back a touch. All seemingly “normal.” Then why the heck did we get a chart like this?
I’ve produced some ugly charts in the past, but this is in the running for the worst of all time. I thought about trying to fix it up, but then figured, after a week like this, why not go for the full Rorschach test?
There are three things that I see in this chart (I am a little bit scared about what a psychologist would make of my interpretation, but here goes):
There was no consistent narrative between stocks and bonds. At times we saw correlated moves, but then we saw just as many inversely correlated moves. Just like the Mag 7 is dead as a rule of thumb, the “bonds and stocks are correlated” rule of thumb might also need to be put away.
We had a legitimate “flight to safety” trade. The Nasdaq 100 was briefly down 3% from intraday high to intraday low (which had me feeling good about my fears that we could see 10% downside far more easily than 5% upside). The plunge in stock prices, accompanied by a rally in bonds, seemed to be spurred by fears about an imminent escalation by Iran. Since the initial fighting began last fall, this is the first time that I can really point to a moment where the geopolitical risk immediately and undoubtedly impacted markets significantly. I expect more geopolitical “shocks” in the coming days and weeks, so long as the market seems to by and large not be pricing in significant risk (the oil market is ahead of stocks and bonds on that). The rally in oil, which I expect to occur on any escalation or expansion, is why I don’t think that we will see a “true” flight to safety move, because I think that yields will come under inflationary pressure.
Liquidity is not deep. Whatever good mood I was in, after Thursday’s rapid decline, was undone. The day started fine, as overnight we reversed a little of Thursday’s move as nothing extraordinary happened with regards to Israel and Iran. Then payrolls beat the highest expectation (which I was leaning towards), and bond yields had the good sense to go higher (again, I think now that we’ve breached 4.4%, we go towards 4.6% on 10s). But stocks, after some early gyrations, decided to rally on the strength of the economy. Reasonable, but certainly bucking the theme that higher bond yields push stocks lower. At least that was how it worked until near the end of the day. From the trading on Thursday and Friday, with fairly large moves, I take away that there is very little depth to markets (and the day traders, 0DTE options, etc. are all amplifying moves).
That is what I get out of that messy chart!
… Bottom Line
I am still nervous about equity risk, and still doubt that we will get any overall rotation (Russell did far worse than the S&P 500 this week)……I think that the 10-year is now moving into the 4.4% to 4.6% range. Maybe higher as the bulk of the move to this level has been due to diminished rate cut expectations, rather than an increase in risk premium. That should be coming, and I would like to see 2s vs 10s back to -20 or even closer to 0 than that.
… As Seargent Esterhaus liked to say, “let’s be careful out there” as the risks are mounting, and we’ve shown how susceptible we can be to them….
Bloomberg: The world is flat for interest rates (Authers’ OpED also passes along the Tchir visual from above … interesting, no?)
Slow and steady does it for the Fed’s descent, as market expectations have fallen to two cuts this year. Plus: Gaza’s six months of upheaval…
… Events in US monetary policy matter for everyone else. With the Fed staying higher for longer, it grows harder for other central banks to cut without weakening their currencies against the dollar. But the odds are now, if the market has it right, that the European Central Bank will conduct at least one more cut of 25 basis points this year than the Fed. That will be uncomfortable for the ECB, who hold their regular monetary policy meeting on Thursday weighing an economy that looks far weaker. They are still expected to prepare everyone for a cut in June:
Expectations are moving this way because the data are moving. Or rather, like policy rates, the data have reached a plateau. The latest US unemployment numbers, for March, show no deterioration. In both the public and private sectors, payrolls are growing at much the same clip as they have for the last year. This was ahead of expectations, and suggests that the mountainous rise in interest rates to date has had very little effect on the jobs market:
For interest-rate policy, unemployment matters because of its effect on wages. When they’re rising, demand will be higher, as will the costs that companies want to pass on to consumers. Wage rises are declining, but on either the average hourly earnings basis reported by the Bureau of Labor Statistics, or the Atlanta Fed’s wage tracker series based on census data, which will be updated in the coming week, wage inflation continues to stay at a level higher than was ever seen in the decade before the pandemic:
Sam Ro from TKer: Even strong stock market years can get very stressful
AND … in addition TO a couple of MY favorite economic funDUHmental economic calendars noted HERE over the weekend …
Yardeni: The Economic Week Ahead: April 8 - 12
This week will feature some key inflation numbers. The March headline CPI (Wed) and PPI (Mar) will get a boost from higher gasoline prices. Their core inflation rates should continue to moderate. The week starts with the FRBNY survey of inflation expectations (Mon). The pump price of gasoline jumped last month and probably boosted inflation expectations (chart):
The gasoline component of the March CPI will also reflect the jump in the gasoline pump price (chart).
Nevertheless, the Cleveland Fed's Inflation Nowcasting shows that the headline and core CPI inflation rates rose by 0.34% m/m and 0.31% m/m--i.e., not much of a difference. By the way, the jump in multi-family housing completions during February suggests that rent inflation should continue to moderate as the supply of rental apartments increases (chart).
… Finally, in as far as NFP recaps and victory laps go … the Wise Old DRUNK Owl’s got some sage words …
… AND THAT is all for now. Off to the day job…


By my calculation, late in 2026, the 2nd year of Biden's 2nd term, we should hit $ 40 Trillion
in US National Debt....if nothing changes