weekly observations (4/08/23): front-end stops triggered and others leaning long; Longest 2s10s Curve Inversion…Ever: 459 days and counting; RedHeads & #Elves
Good morning / afternoon / evening - please choose whichever one which best describes when ever it may be that YOU are stumbling across this weekends note…
And welcome to one and all who may be new to this spot on the web. Not sure how / why you’ve found yourselves here but happy to have you and hope I don’t bore you to tears. I welcome any / all comments / feedback and a special shout out to one known source — DiMartino Booth and The Daily Feather / QI readers!! I’m grateful for a recommendation and unsure of whatever I’ve done to deserve.
I hope you find whatever you have hoped for and while I would say what follows likely to be short and sweet summary / recap and victory lap after the recent NFP data, well … it would seem there are too many nuances and so, various angles to cover.
I realize I’ll run the risk of boring even myself to tears … but such is life.
Basketball is on, NYY ‘bout to start and so allow me to get to / through it.
First UP, a link thru to some UPDATED WEEKLY NARRATIVES … a compilation of some of THE VIEWS from Global Wall Street which you might be able to use … I’ll highlight a few things in a moment but rather than waste much more of your time AND in the case this is why yer here, well, HERE you go.
Moving along then and catching up after data dust has settled, (bond & other) mkts spoke loudly and clearly after some REDHEADS dropped …
… Goalposts MOVED and i’ll leave it up to you to interpret however you wish … I’ll go to the bond market first …
2yy: breaking badly (for Team Rate CUTS) BUT … nearly oversold Xtreme (see NWM this weekend … reiterating a desire to scale into front-end longs…)
30yy: same story here from a price perspective … rates UP and this may have some greater global macro impacts (think housing, for example) BUT …
… next up a topical s/t look in at ‘The Elves’ and S&P courtesy of BBG and Wall St Week …
… Checking in on the Elves
A strong finish to the week failed to prevent the S&P 500 from a weekly drop of almost 1%.
The gauge is up 9.1% this year through the first week of the second quarter, underscoring a central theme among the Bloomberg Wall Street Week Elves in 2024: Their targets have kept getting ratcheted higher, not lower…
Now, lets deal with a couple / few things DRIVING yesterday’s price action.
Specifically as it was NFP (following geopolitical and #FOMC101 commentary of NO HIKES maybe needed) …
What follows is an attempt to curate some of the links and thoughts from the intertubes … I used to have a better capability (read: Bloomberg) to economically workbench on my own and now I’m relegated to simply trying to find / parse through all avail and present which I feel most relevant / helpful.
On we go …
at BiancoResearch (6:21 PM · Apr 5, 2024)
Late afternoon on the bond market
1-Day tick chart of the 10-year yield
The 10-year yield sold off back to the day's high yield, closing at 4.40%.
BondDad: March jobs report: almost uniformly positive, making a “soft landing” the default 2024 scenario
CalculatedRISK: March Employment Report: 303 thousand Jobs, 3.8% Unemployment Rate
CR: Comments on March Employment Report
at spomboy (9:20 AM · Apr 5, 2024 Steph’s another one of the best out there …
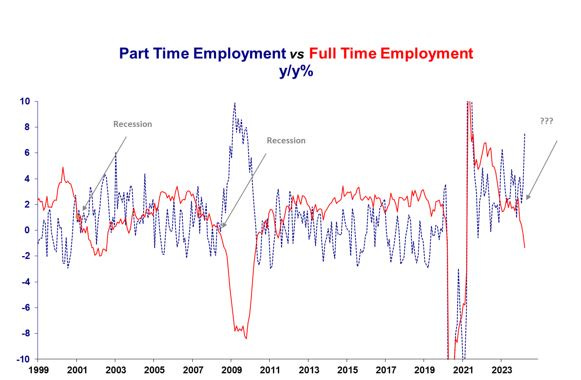
We've lost 1.8 MILLION full time jobs in just the last 4 months. That's (not surprisingly) the biggest such drop since Covid and the Great Recession before it.
(9:10 AM · Apr 5, 2024) Nothing about this chart suggests we have a 'strong' labor market. Far from it. FT jobs down -1.3% yy...PT jobs up 7.5%y/y
ZH: March Jobs Come In Red-Hot At 303K, Above Highest Esimate, Entirely Thanks To Part-Time Jobs
The illegal aliens win again…
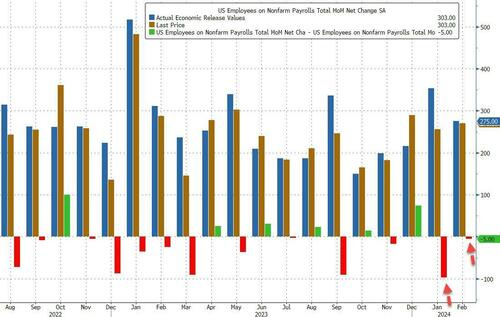
… The number was not only hotter than last month's (downward, of course) revised number of 270K (was 275K) but was above the highest Wall Street estimate of 290K (from Jobdig, Inc) and as shown below this was the latest multiple-sigma beat to expectations, this month coming in at 4x.
The March number, which will be revised substantially lower next month, follows two downward revisions, follows a 5,000 downward revision to the February number from +275,000 to +270,000, and a 27,000 upward revision to January from +229,000 to +256,000.
ZH: Behind Today's Stellar Jobs Print: It Was Literally ALL Part-Time Jobs (And Illegals)
… Ok I’ll move on AND right back TO the reason many / most are here some UPDATED WEEKLY NARRATIVES … a compilation of some of THE VIEWS from Global Wall Street which you might be able to use. THIS WEEKEND, a couple / few things which stood out to ME …
BARCAP: The Blue Drum: Fog of war (on EARL which poses a problem to Team Rate CUTS i’d imagine)
The constructive baseline view on oil prices remains hidden in plain sight in the fog of war, in our view. We raise our 2024 fair value estimate for Brent to $90/b and for 2025 to $94/b.
BMO weekly: Drive to 4.50% (even best in show have a rough go of it time to time…)
… Monday’s selloff in FFZ4 stopped us out of our long position we entered on March 20th as the futures market walked back the amount of rate cuts priced in by year-end.
Citi’s Rates at The Bell notes / visualizes (sorta … contextualizes) …
… Longest 2s10s Curve Inversion…Ever: 459 days and counting, in infamous company with the likes of the July 1980 Oil shock and NOV 1982 Volcker period. We were also stopped out of our 2s/30s flattener position on Wednesday at a prior range top of -17.6 bp before the curve extended its climb to fresh Q2 steeps.
ddMoving along and away FROM highly sought after and often paywalled and Global Wall Street narratives TO a few other things widely available and maybe as useful from the WWW
AllStarCharts: Commodities > Stocks > Bonds
… It’s actually the exact opposite. Interest rates keep going up, as Commodities rip higher and bonds keep falling apart.
You’re going to tell me this isn’t an uptrend?
But here’s the big one.
We’ve been pointing to the possibility for Commodities to really rip vs stocks, but now we’re seeing it.
Bloomberg (via ZH pre NFP): Yields Are Correct To Assume Jobs Market Has Not Yet Cracked (seems like no cracking POST data, either … chalk another up to Team Simon White / BBG?)
Discipline Funds: Yes, The Labor Market is STILL Not Tight
One of the big lessons from the 2010-2020 environment was that headline payrolls could increase substantially without putting upward pressure on inflation. This can be confusing because there’s often an assumption that more jobs mean more demand and higher prices. But it’s more complex than that. Think of it like stock prices. Prices will rise when the eagerness of buyers outpaces the eagerness of the sellers regardless of the depth of the market. The same basic thing happens in the labor market. So, even if you have an increasing number of people working the cost of that labor can actually slow if capital has more negotiating power over labor. This is essentially the story of the entire decade of the 2010s when the labor market expanded by an average of 190K per month and inflation was 1-2% almost the entire time. That occurred, in large part, because capital had so much negotiating power over labor.
And the best way to see that relationship is in hourly wages. In short, does capital need to pay you more to work? And the obvious answer in the 2010s was no.
Importantly, the same trend is playing out now and Powell has been very clear about this. In the most recent press conference he said:
“in and of itself, strong job growth is not a reason for us to be concerned about inflation”
So the headline employment data can look strong (and has) and you can still get a falling rate of inflation if capital isn’t forced to pay up for labor. And what do we see in hourly earnings? This month’s labor report showed one of the sharpest slowdowns of recent years with the rate of change slowing from 4.6% to 4.2%. I expect this to slow further and stabilize in the high 3% range during 2024. But for now the trend is clearly still to the downside and that is consistent with a labor market where workers have less negotiating power than capital. And that should ultimately flow through to lower rates of inflation.
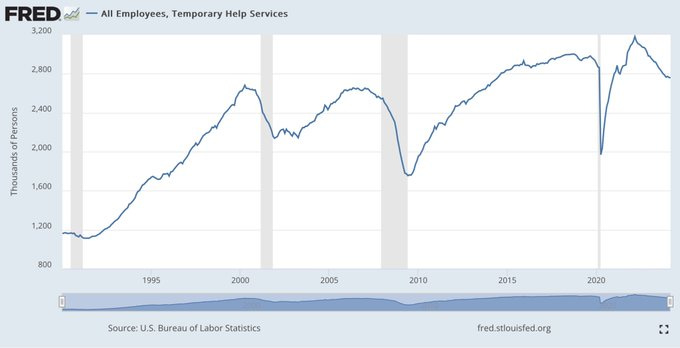
I am a broken record on this by now, but this is not remotely close to what happened in the 1970s or 1940s when we saw large resurgences in inflation. Those narratives look dead in the water with wage rates falling the way they are. So, despite a relatively strong labor market, the underlying trends are consistent with a labor market that isn’t overly tight. You could even argue that metrics like full time employment, temporary help and the quit rate are consistent with a labor market that is loose. So don’t let the headline figure fool you into believing that the labor market is necessarily tight.
What does it all mean for the Fed and short-term fixed income investors? …
… All that said, the calendar for potential cuts is getting interesting now. I had been in the June camp and creeping to July, but now I am starting to think that November might be the first cut. And here’s the problem – I think we’ll be at about 2.5% core PCE by May and if we continue to get strong employment reports then the Fed’s going to be a little uneasy about cutting in June. So June is probably off the table. July is a maybe, but same basic story there where core PCE is still a touch too high to be certain about trend inflation. And then the next meeting is September which is just three weeks from the election. Will they initiate their first cut right before the election? Boy, I doubt it. I can only imagine the headlines there with people screaming that the Fed is working for the Democrats. And that leaves the November meeting and the December meeting which would mean two cuts in 2024….
FirstTrust: Data Watch - Nonfarm Payrolls Increased 303,000 in March
… Implications: … However, not all the news was quite as good. We like to follow payrolls excluding government (because it's not the private sector), education & health services (because it rises for structural and demographic reasons, and usually doesn’t decline even in recession years), and leisure & hospitality (which is still recovering from COVID Lockdowns). That “core” measure of payrolls rose a more modest 95,000 in March and is up only 61,000 per month in the past year. Also, the household survey shows full-time employment down in the past year, which usually only happens in and around recessions. In addition, given the strength in headline overall payrolls, the Fed has to question whether monetary policy is really tight, given also that CPI inflation remains stubbornly above 3.0%. As a result, the Fed could stay higher for longer, which could hurt more when the effects of tighter money eventually bite.
ING: US jobs strength continues despite survey weakness
The US added 303,000 jobs in March, which is more than anyone was expecting. With next week's inflation likely to remain hot, the prospect of a June rate cut from the Fed looks slim. Nonetheless, with business surveys universally pointing to weakness over the next 3-6 months we do expect to see more evidence of cooling by the summer
at M_McDonough (bbg guru, 8:34 AM · Apr 5, 2024)
3M Net Change in NFP vs Household Survey Employment Indexes: {ECWB P 660DCE492E3C0000<Go>}
at MichaelAArouet (12:15 PM · Apr 5, 2024)
We are in the most recessionary no recession. Both temps and full time jobs are falling in line with recession prints, only part-time jobs people need to take to cope with rising cost of living are keeping monthly NFP prints positive.
at GregDaco (8:37 AM · Apr 5, 2024 … 3moMA)
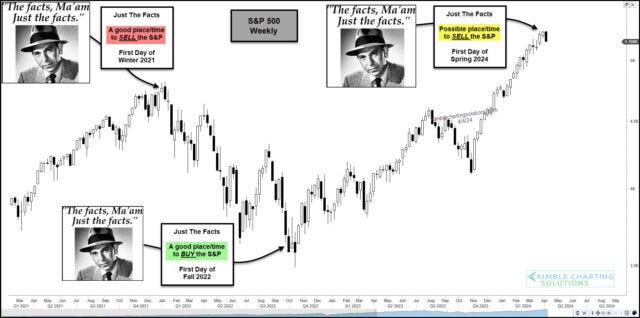
Kimble: Is the S&P 500 Flashing a Spring Sell Signal?
WolfST: Nothing in the Jobs Report Indicates the Fed Should Cut Rates: Labor Market Plugging Along Just Fine despite 5.5% Rates
And wages rose at a good clip too.
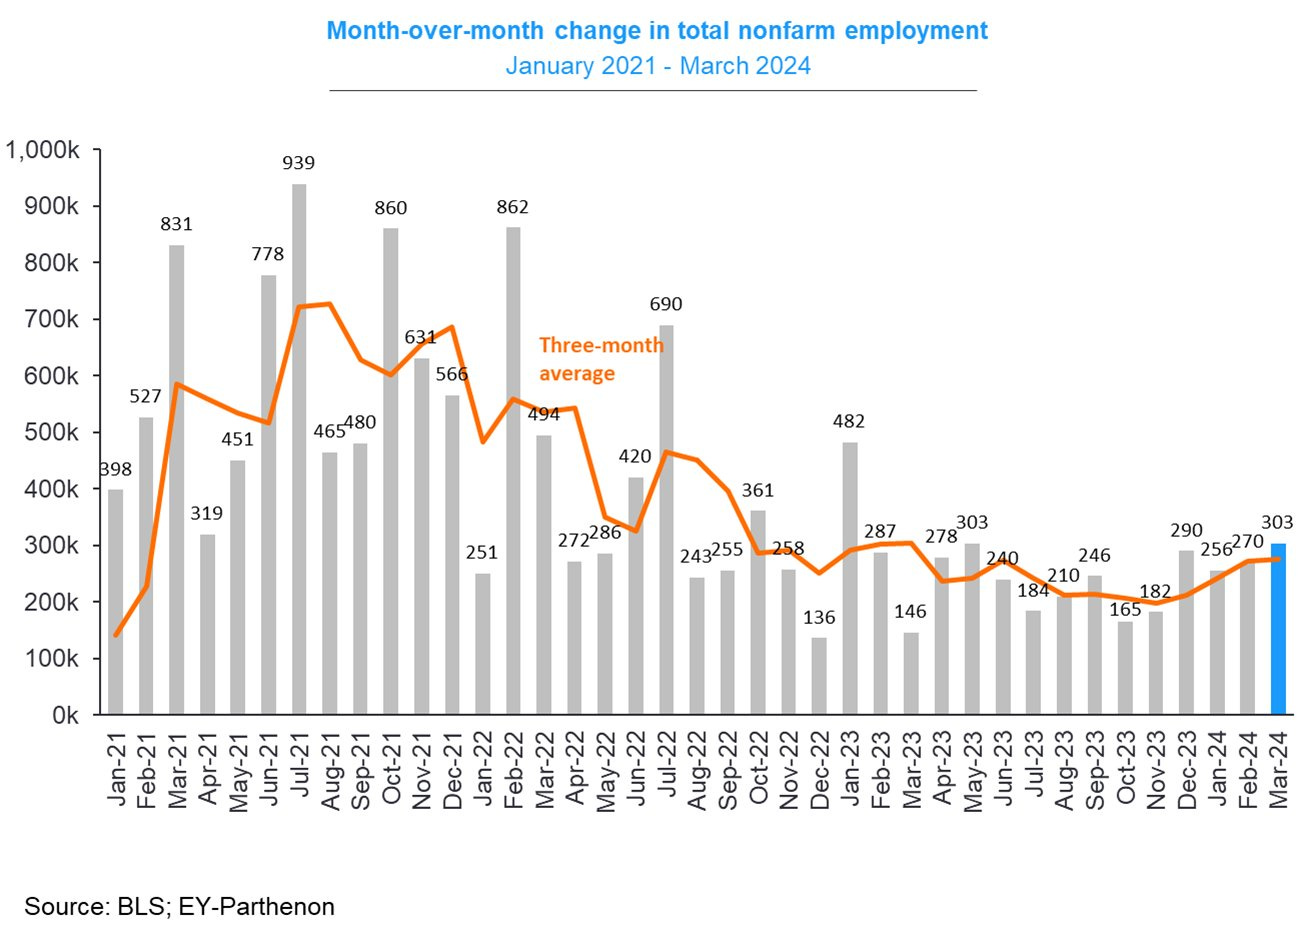
… January’s data was revised up by 27,000 jobs, February’s was revised down by 5,000, for a net up-revision of 22,000 jobs. This brought the three-month average increases, which iron out the month-to-month squiggles, to 276,000 jobs, a rate of over 3 million jobs a year, which is a lot:
… Multiple job holders as percent of total workers have dipped in recent months and remain in the normal range over the past 20 years, but are much lower than in the 1990s and early 2000s:
WolfST: 10-Year Yield Hits 4.40% as Bond Market Begins to Adjust to Higher Forever: Higher Rates and Higher Inflation
Suddenly lots of talk the 10-year yield will revisit 5%, which is funny just a few months after Rate-Cut Mania.
… The economy and the labor market have been growing at an above-average pace, and yet policy rates have been above 5% since May 2023 and above 4% since December 2022. With that kind of growth, and the inflation we have, they’re not restrictive.
And the bond market is adjusting to this scenario and it seems is just heading back to the old normal – the normal from 20 or 30 years ago, as we can see in the long-term chart:
ZH: Credit Card Debt Surges To New All-Time High, Just As Card APR Rates Hit Fresh Record
… AND for any / all (still)interested in trying to plan your trades and trade your plans in / around FUNduhMENTALs, here are a couple economic calendars and LINKS I used when I was closer to and IN ‘the game’.
First, this from the best in the strategy biz is a LINK thru TO this calendar,
Wells FARGOs version, if you prefer …
… and lets NOT forget EconOday links (among the best available and most useful IMO), GLOBALLY HERE and as far as US domestically (only) HERE …
Finally … thinkin’ there’s an NFP and markets reflex analogy here somewhere … I’ll throw out there as a ‘caption contest’ to help me relate this back TO markets of yer choosin’
Ah, forget it … NFP tea leaves reading be like …
THAT is all for now. Enjoy some hoops, lets go Yankees AND, as always, enjoy whatever is left of YOUR weekend …







Great NFP Commentary...
Excellent work!!!
Blaming Earl's rise on Israel only is certainly simplistic, never mind Ukie/CIA/MI6 attacks on Russian oil facilities, OPEC cutbacks, a hyperinflating DXY vs the Everything Bubble. And WTF is Hobbit/Mama/Gollum Yellen doin back in China again, tea & cookies?!