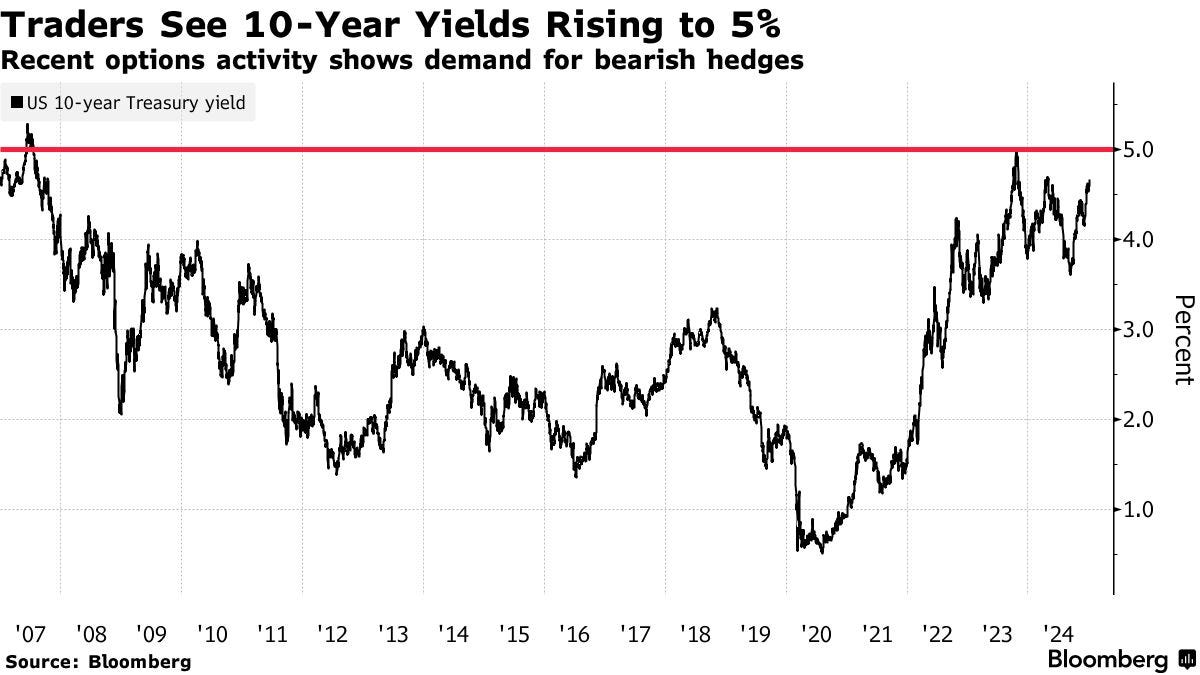
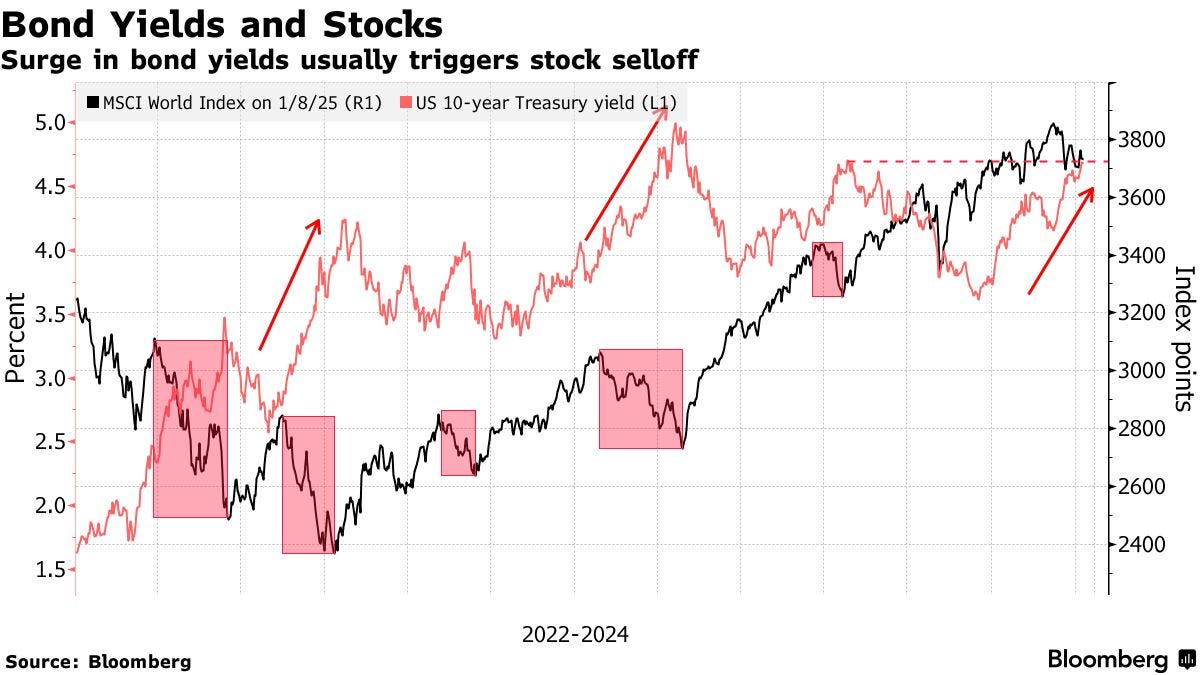
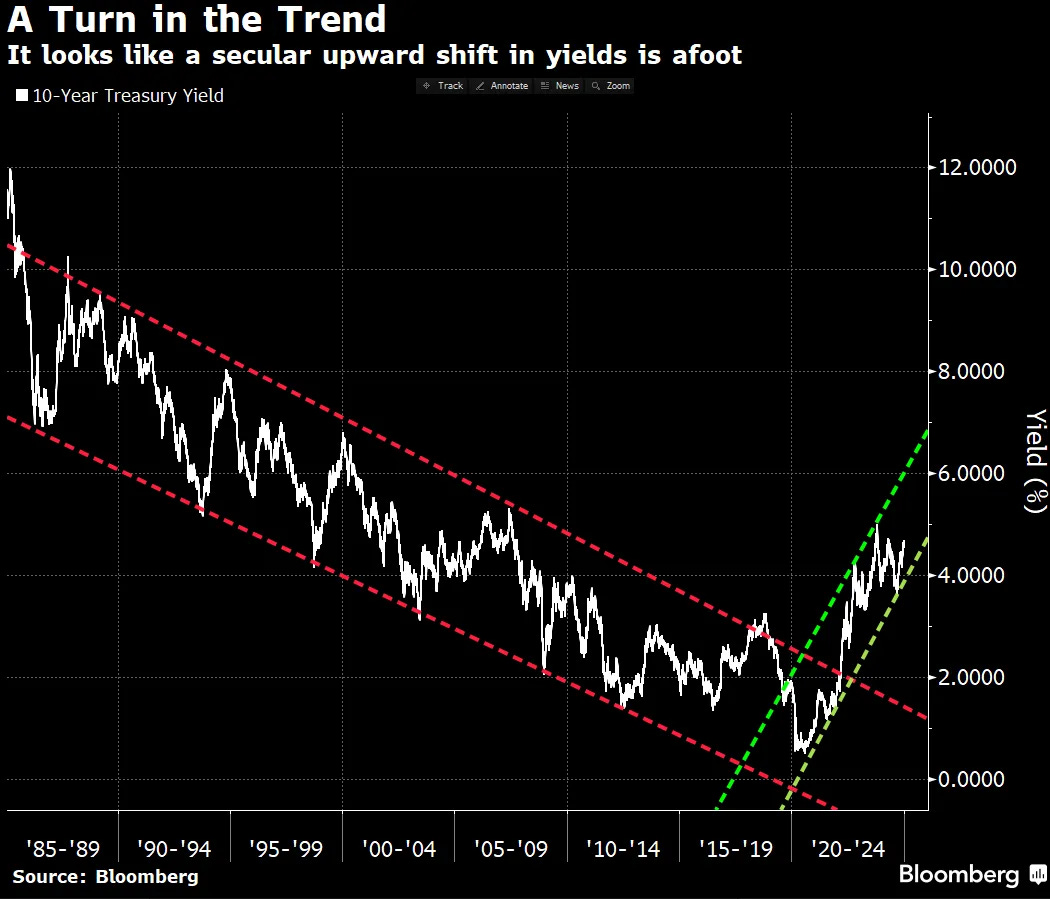
while WE slept: USTs cheapening into supply; BBG: "Bond Market Targets 5% US 10-Year Yield", last time yields surged, stocks SANK and "... The most important issue may be the secular trend ..."
Good morning … welp, there you have it and so much for ‘none shall pass’ (10s vs 4.64%) …
… US 10y yields have re-tested the 4.64% level. IF we break above, it would suggest higher yields, but with resistance relatively nearby at 4.74%, the move higher could be quite limited … The key question here is whether we could continue to see higher yields from here. While weekly slow stochastics is ticking higher, we are not yet convinced we could see a big move higher yet. We would need to see a weekly close above 4.64% to make a stronger case for this, however. And even if we do see a close higher, we think it would just be another ~10bps move before we find resistance again at 4.74% (2024 high) …
-CitiFX
WHY, then, are rates rising?
Not sure I know or can offer more than the right questions to ask. I know who’s opinions (which are ALL created equally, and how some are simply MORE equal than others) matters … and it’s NOT mine.
DATATREK asks / answers and so too does Dr. Ed Yardeni — both notes below.
I DO KNOW markets are like politics and now, since DJT has won, certain things seem to have become ‘OK’ to say out loud.
Same in markets. Something has happened (perhaps the very same event) and it seems ‘OK’ to think about higher for longer.
I’m NOT gratified in the least, although, talked at length last year about ‘Team Rate CUT’ in such a way to get the point across. I didn’t / don’t always agree with lower rate idea. Inflation remained a concern and the idea the Fed MIGHT have broken something (SVB?) did put this view on PAUSE.
Thinking about rates — higher for longer — is / was hard for me, a former bond geek in a seat where, for my entire career, thinking about rates going from upper left to lower right, was generally correct.
Things changed at the end of 2021 when the Fed started raising rates and now, folks just coming around to thinking about possibilities for rates to REMAIN higher (5% now in target zone … even Yardeni — below — mentions) …
So then, WHY are rates rising? I’ll have MY views and you’ll have yours and whether the rise is sustainable and / or impacts other markets, remains more interesting question.
For now, though and ahead of this afternoon’s $22b 30yr auction …
30yy DAILY: 5.00% — but not THE 5% everyone talkin’ about — in sight …
… as yields continue to march higher into supply and ahead of tomorrows early close remaining overSOLD …
… A concession may be afoot. Did it help with YESTERDAYS 10yy? Here’s a quick look back at how yesterday’s 10yr auction came and went …
ZH: Ugly, Tailing 10Y Auction Flops Despite Highest Yield Since 2007
… NOPE. And so, some of the input creating the price action …
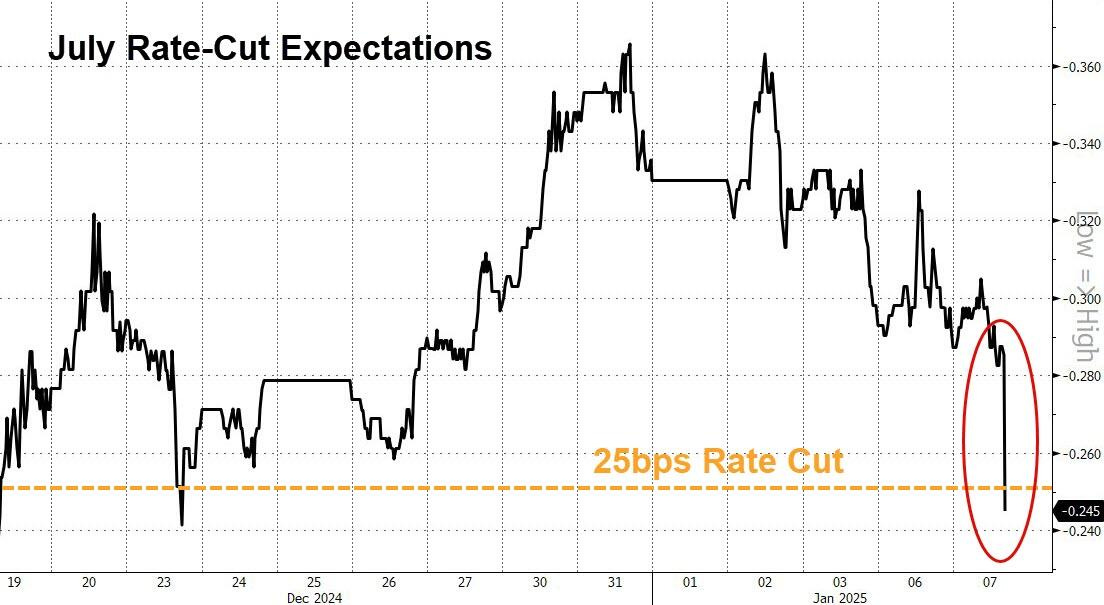
ZH: Rate-Cut Odds Plunge As ISM Services Inflation Index Surges Near 2-Year-High
… 'Inflation' expectations are at their highest since Feb 2023 - The market is no longer pricing in a full cut by July...
... not at all what Powell and his pals want to see (or maybe it is).
… this in concert with the days JOLTS data …
ZH: Job Openings Unexpectedly Soar On Record 2-Month Surge In Professional Services, Even As Hiring Tumbles
… were, well, quite the combination
… here is a snapshot OF USTs as of 654a:
… for somewhat MORE of the news you might be able to use … a few more curated links for your dining and dancing pleasure …
IGMs Press Picks: January 08 2025
Yield Hunting: Daily Note | January 7, 2025 | SPE Boost, Individual Bond Menu.
NEWSQUAWK: DXY rebounds & futures gain ahead of front-loaded US data and FOMC minutes … Fixed benchmarks contained into a packed US session and 30yr supply … USTs are contained into a front-loaded US session on account of the Federal Holiday for Carter on Thursday. As such, we get ADP, Jobless Claims, FOMC Minutes and 30yr supply in today’s session. Into those events, USTs trade within a slim 108-04 to 108-09+ band which is entirely and comfortably within Tuesday’s 108-01 to 108-20 parameters. Ahead, US ADP, Jobless Claims ahead of speak from Fed's Waller and then the release of the FOMC Minutes. Additionally, we await a 30yr supply which follows a tepid 3yr tap on Monday and a relatively soft 10yr outing last night.
PiQ Overnight News Roundup: Jan 08, 2025
Reuters Morning Bid: Bonds flashing red, 'term premium' at 10y high
Reuters Morning Bid (ASIA): Spiking yields puncture risk appetite, Japan warns on yen
Finviz (for everything else I might have overlooked …)
Opening Bell Daily: Trump vs. Powell heats up … Trump and Powell are about to play tug-of-war with the US economy .. The president-elect and Fed see interest rates moving in different directions this year.
Moving from some of the news to some of THE VIEWS you might be able to use… here’s some of what Global Wall St is sayin’ …
Markets got a JOLT … a quick recap which reads as one thoroughly underwhelmed…
BARCAP: November JOLTS: Moving sideways
Job openings increased for a second consecutive month in November, with the level now looking fairly stable since early summer. However, hiring and separation rates show less labor market turnover. We see little in today's estimates that would move the needle for the FOMC.
Same UK shop talkin’ stocks …
BARCAP: U.S. Equity Insights: Top 5 to start '25
We looked back at 2024 in US equity markets from a topdown, sector and thematic perspective, and highlight 5 things to keep an eye on as 2025 gets underway: whether the bull market can maintain its pace, unusual seasonality, sector valuations, concentration risk and US vs. Europe.
The S&P 500's 2-year run was one of its best ever; the index was up 23.3% in 2024, coming up just short of the prior year's 24.2% price return, putting the 2Y CAGR at just under 24% – its 5th-greatest over the last 50 years. While we see no significant long-term relationship between 2Y price return CAGR and SPX returns over the subsequent year, there were only 3 years at the end of which the 2Y price return CAGR exceeded 20% and the rally did not decelerate the following year: 1996, 1997 and 2020.
Unusual seasonality could be reason for caution; the SPX generated unusually strong returns in the first 3 calendar quarters of 2024, while the 4th quarter turned out to be the weakest. We find some correlation between 4Q returns and subsequent 1Q performance: if 4Q performance is better than the LT median, the subsequent 1Q median return is 4.1%. When 4Q performance is worse than median (as it was most recently), the subsequent 1Q median return is flat to slightly negative.
The TMT complex was the standout among sectors for the second year running…
Concentration remains a key risk as 2025 gets underway. The percentage of SPX constituents beating the index rose to the highest level in over a year by October, but fell sharply over the final 2 months of 2024. Our US broadening basket weakened over the same period. Big Tech is now 29.3% of the S&P 500 by weight and accounted for half of the index's gains last year, down slightly from 2023's 56%.
US looks expensive vs. Europe but we see a fundamental basis…
AND, the more things change, the more they stay the same … while this next note is specifically on a crevice of the markets I never got too deep in to (rates / VOL trading) as it was mainly for bigger shops, bigger brains with bigger wallets (ie capital requirements, etc), it has a visual which resonated with me … and so …
BNP US rates vol: Still dependent on the Fed in 2025
KEY MESSAGES
Underperformance of left-side vols in December leaves conditional bull steepeners closer to a pickup versus the forward curve.
Therefore, opportunity is improving for investors who believe the economy may weaken in 2025.
2006-07 offers a precedent for lower vols. But selling ULC 1x2 payer or receiver spreads could benefit from a very different Fed outcome to what is currently being priced in for 2025.
… same shop with some thoughts on EARL …
BNP Crude: Strong start to 2025 – too much, too soon
KEY MESSAGES
We think crude prices have risen too much too soon.
We expect Q1 crude prices to fall back to the low USD70s/bbl when maintenance commences, but tighter sanctions on Iran (without OPEC+ backfilling them) could strengthen oil in Q2 unless Trump’s tariffs come in faster and wider than anticipated.
… and once again from some closing thoughts yesterday, a quick look at long bonds by the best in the biz …
BMO Close: Chasing the Trend
… Several hours after the data, the market will be tasked with underwriting $22 billion 30-year bonds. It hasn’t been a strong start to the week as far as primary market sponsorship for Treasury supply. Despite a sizeable outright concession at the 3- and 10-year auctions, investors have been unwilling to pay up for coupon supply and end users have taken a below-average share of the issues. Note that if the auction clears at a cheaper level than the October 2023 stop of 4.837%, it will be the highest yielding 30-year auction in the post-GFC era. While ~4.90% 30-year bonds offer a sizeable outright concession, we’re skeptical an aggressive bid for duration will be on offer at the current juncture …
… 30s – The long bond finds support at a double-top in yields at 4.85%. If we see a selloff through there, there is little of note in the path toward 5.0%. If we see a return to the land of the 5-handle, support comes in at a very narrow opening gap from October 2023 at 5.092% to 5.093%. Through there is the 2023 yield peak of 5.176%. Below, resistance comes in at the December 31st yield low of 4.715%, and through there is a modest volume bulge centered around 4.60%. Should we see a rally though that level, the 40- and 50-day moving averages come into play at the 4.583% and 4.566%, respectively, before the 200-day moving average of 4.435% …
… apparently I missed the memo about how important it is to shout from the rooftops that the move in rates this rate cutting cycle quite different from most others … YESTERDAY, Torsten Slok / Apollo noted as much and so, too, did following fan fav stratEgerist from across the pond — I just missed this one in realtime and so …
DB: 13 out of 14...
One major part of the market that will dictate sentiment and performance this year is US treasuries.
Today’s CoTD shows that in the 14 Fed easing cycles since 1966, this current one has so far seen the second worst performance of 10yr USTs. Yields have now climbed 91bps since the Fed started hiking rates back in mid-September last year. The only easing cycle with a weaker performance was in 1981 when there was a lot of volatility in Fed policy and rates at the back end of the Volcker squeeze on inflation…
… um, this next one from overseas, says all you need to know in its title …
ING: US maintains growth momentum with warning signs of inflation
Markets have been re-pricing the prospect of Federal Reserve rate cuts this year in the wake of more hawkish Fed commentary. Today's data suggests that the economy is maintaining its strong momentum and that inflation continues to be sticky with concern over tariff implementation starting to impact corporate thinking and behaviour
…ISM activity indices versus GDP growth YoY%
…Quits rate versus employment cost growth
NEXT, a note from Paul Donovan …
UBS: US rates paths
The minutes of the last Federal Reserve meeting are due. Investors’ concerns are less about the current state of play of the US economy (reasonable growth and slowing inflation) and more about where politics will take the economy next. This has added uncertainty about the 2025 policy path, and gives the minutes more importance than is perhaps normal at this stage of the cycle.
US November consumer credit data is scheduled. This is a volatile series with a wide range of forecasts making up the consensus, but consumer credit has become more of an investor focus. S&P credit card data still shows benign credit statistics, and rising real incomes reduce the dependency on borrowing…
… and one from Amanda Wilcox …
UBS: Job openings rise, ISM services too
… We've noted that openings are poorly measured, and tend to be a lagged signal of labor market weakness but also there are potential inconsistencies within the survey. While the job openings rate is just returning to pre-pandemic levels, the hiring rate has been below the 2016-2019 average for over a year. In today's data, this continued, with the total industry hiring rate slipping lower, down 0.1 pp to 3.3%, matching the expansion low in June. That's a level on par with the 2010-2012 labor market. A curious gap with the elevated openings rate remains (see chart below), again making one wonder why if openings are so abundant, are they not being filled?
… a couple notes from the covered wagon folks … one on JOBS and another reminder that it’s all ‘bout services … always has been always will be and so, now, ‘bout those rate CUTS in 2025 …
Wells Fargo: Job Openings Improve in November, but Turnover Still Muted
Summary
The November JOLTS report offered another tentative sign of labor demand stabilizing. Job openings at the end of November rose to a six-month high of 8.1 million, consistent with the recent leveling off in Indeed job postings. That said, turnover metrics suggest both employees and employers remain in a holding pattern. The share of workers in November voluntarily quitting their job fell back to its cycle low of 1.9%. Meantime, employers remain reluctant to let go of existing workers, but also reluctant to bring on new workers. The layoff rate, at 1.1% in November, remained just below its pre-pandemic average, but the hiring rate fell back to 3.3% and is still hovering near levels unseen in more than a decade.Wells Fargo: Vibrant Service Sector Still Fans the Coals of Inflation
Summary
Activity snapped back into action in the service sector in December as ISM services climbed to 54.1. Most sub-components notched gains, but none rivaled the 6.2 point jump in the prices paid component, which signaled the broadest increase in service sector costs since February 2023.
… finally, Dr ED weighs in …
YARDENI: Bond Vigilantes Put 5% Yield In Crosshairs
The US economy continues to roar. December's ISM purchasing managers survey showed that services activity remains strong. The JOLTS data, albeit a bit stale from November, showed job openings jumped. That aligned with the recent rise in measures of business and consumer confidence. So why did stocks turn lower today? The answer lies with the bond market.
The prices-paid index in the ISM nonmanufacturing PMI jumped from 58.2 in November to 64.4 in December (chart). That was the highest reading since February 2023. That sent the 10- and 30-year Treasury yields to recent highs of 4.69% and 4.92%, respectively.
The Bond Vigilantes aren't buying the Fed's esoteric narrative that the federal funds rate (FFR) needs to be cut because the so-called neutral rate of interest is much lower than the prevailing 4.33%. What matters more to them is that inflation in the core services components of the CPI and the PCED remains sticky well above 2.0%. Long-term yields may continue rising until the Fed acknowledges the economy’s strength and officially hits the FFR pause button (chart).
We view today's economic data as good news. Much of today's stock market losses were concentrated in large tech stocks. Nvidia fell 6.2% as investors cashed in some of their recent gains in anticipation of CEO Jensen Huang's bullish announcements at yesterday's Consumer Electronics Show (CES). We found them encouraging for AI broadly. Meta slipped after announcing a new board director in UFC CEO Dana White and changes to its fact-checking program on Facebook and Instagram. High-beta stocks like Tesla and Palantir also took a hit. But the broader market held up just fine.
… And from the Global Wall Street inbox TO the WWW … a few curated links …
Chart 1 -- Real Yields
Yields on TIPS (which have a principal balance tied to CPI, protecting them from inflation) have risen from roughly 1.5% in September to roughly 2.25% today. While 'real yields' peaked at higher levels during late 2023, they’re still very elevated relative to recent history. Higher real yields should all else equal lower other financial assets, but of course all else is not necessarily equal
… and as the new year gets underway, some thoughts and input on positions from EBB
Bloomberg: Bond Market Targets 5% US 10-Year Yield as Trump Swear-In Nears
Recent US option flow sets up for bigger bond-market selloff
Trump policies seen as inflationary; Fed bets are pushed out
… Against this backdrop, investors are positioning for sharply higher yields. Options data Tuesday from the CME indicated a fresh trade targeting 10-year Treasury yields at 5% by the end of February. That may be just the start: Padhraic Garvey, head of global debt and rates strategy at ING Groep NV, sees 10-year US Treasury yields trading around 5.5% toward the end of 2025, while T. Rowe Price’s Arif Husain said 6% is within the range of possibility …
The recent surge in Treasury yields appears to have been accompanied by the buildup of short positions in the futures market. Open interest, a gauge of activity in the market, has risen in each of the past five sessions in the so-called ultra 10-year note contract, which tracks the generic 10-year cash note. Further out, open interest has risen in eight of the past nine sessions in the long-bond contract, which matches up against the 2040 cash bond. Rising open interest into a selloff broadly indicates new bearish wagers…
… and from a Terminal a couple MORE worth note …
Bloomberg: Last Time Bond Yields Surged Like This, Stock Markets Sank
US 10-year Treasury yield near 4.7%, highest since last April
Negative economic news could trigger correction: Goldman
… “Equity/bond yield correlations have turned negative again,” Goldman Sachs Group Inc. strategists including Christian Mueller-Glissmann wrote in a note, stressing that if yields keep going up without good economic data, it will hit equity markets. “With equities having been relatively resilient during the bond selloff, we think near-term correction risk is somewhat elevated in case of negative growth news.”
The strategists point out that longer-maturity rates have increased the most as yield curves steepen, indicating concerns on US fiscal and inflation risk. The bulk of the move has been in real yields rather than breakeven inflation…
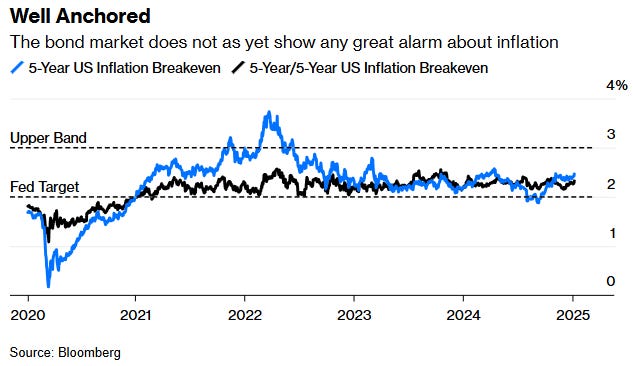
Bloomberg: Bond-yield breakout is much more than inflation
Another edifice of the post-Volcker era of stability is cracking.…Fears of rising inflation, which eats away at the value of future income streams from the bonds, logically raises yields. Inflation expectations as gauged by the breakeven point between fixed and inflation-linked bond yields have ticked up of late, but in the bigger picture they remain remarkably stable. This shows the implicit expectations for the next five years, and for the five years after that (a measure the Fed cares about a lot). They suggest that the bond market is still confident that inflation is back in the bottle:
… The most important issue may be the secular trend. For decades after Paul Volcker tamed inflation in the early 1980s, the 10-year yield trended downward in the most predictable and important pattern in global finance. Whenever the yield rose to threaten the pattern, a crisis — Black Monday, the Orange County derivative disaster, the bursting of the dot-com bubble, the Global Financial Crisis — would erupt, and yields would drop. That is over. And while it’s never wise to make too much of drawing lines on charts, this latest rebound in yields suggests that a new trend is taking shape, as I’ve indicated here:
Demographics can explain this, as can what appears to be a return to inflationary psychology and worries about whether the US fiscal situation is sustainable. The point for now is that the balance of forces is pushing yields upward. The downward trend was in many ways the governing force of international capital markets for more than three decades; it might make sense to get used to the notion that yields will tend to trend up, not down, for the foreseeable future, and change conduct accordingly.
… DATATREK knowing the right questions to ask …
DATATREK: Rising 10-Year Yields, VIX “Buy Signal” Update
… Topic #1: Why are 10-year Treasury yields rising when the Fed is cutting rates? The FOMC has reduced the Funds rate by 100 basis points since its first cut on September 18th. Over the same period, 10-year yields have increased by 100 basis points, from 3.7 to 4.7 percent.
This is not the usual course of events, as the following chart of Fed Funds (red line) and 10-year yields (black line) from 1980 to the present clearly shows. The arrows show the start of the last 10 easing cycles, and in every single case 10-year yields either stayed relatively stable or (much more often) declined.
The chart also suggests an explanation for the recent anomaly of higher long rates as the Fed is cutting short rates. The FOMC tends to cut rates when the US economy is entering a recession (1989/1990, 2000, 2008, 2020), or is already in one (1980/1981), or when growth is slowing (mid 1990s), or when financial markets are in turmoil (1998).
Since the US economy is on a stable footing at present none of these conditions apply today, so we need to dig deeper to understand why 10-year yields are going up while short rates are going down:
Explaining the Fed’s decision to cut rates is easy: the FOMC felt that inflation was coming down sufficiently to reduce policy rates back to something closer to “neutral”.
10-year Treasury yields are a function of two market-determined inputs: inflation expectations over the next decade, and “real” (ex-inflation) rates.
Inflation expectations have risen 22 basis points since September 18th (the date of the first Fed rate cut), from 2.12 to 2.34 percent.
Real rates have therefore increased 78 basis points (from 1.58 to 2.36 pct) and represent most of the increase in nominal 10-year yields since the Fed started its easing cycle.
One can tell all sorts of stories about why real yields have increased since September, but here are the 3 most popular ones:
The most benign narrative is simply that the US economy is strong, even with higher interest rates, so the real neutral rate of interest is probably higher than previously thought. Higher 10-year Treasury yields are a natural response to that fact.
Somewhat more worrisome, but not lethal, is that the bond market suspects the Fed is making a policy mistake by cutting rates and will have to reverse course later this year.
The worst possible narrative would be that markets are reaching the end of their patience with respect to US budget deficits.
Our read is that markets are simply discounting a still-strong economy rather than either calling the Fed’s bluff or stressing over budget deficits, and the following chart explains our reasoning. It shows real (ex-inflation) 10-year Treasury yields from 2003 to the present.
As highlighted, real yields have averaged 1.9 percent over the last 12 months, pretty much spot-on to where they were from 2003 to 2007 (2.1 pct). The mid 2000s were also a period of good economic growth, and US debt/GDP was half of what it is now (60 versus 120 percent). Real rates now are the same as back then, so we can dismiss the idea that deficits are influencing Treasury yields. Rather, a 2 percent real yield is simply the market’s long run view of real neutral interest rates.
Takeaway: While we understand why equity markets are twitchy about seeing 10-year Treasury yields creep back towards 5 percent even as the Fed is cutting rates, history suggests there is a reasonable explanation for this development. As long as the US economy continues on a firm footing, stocks should be able to take high yields in stride since they are a function of solid growth rather than something more worrisome.
… on JOLTS, the Wolf of Wall … no, not THAT one but rather …
WolfST: Labor Market Dynamics Retighten, Job Openings Jump Again. Fed Faces Scenario of Solid Job Market, Re-accelerating Inflation
In light of this scenario, the Fed has been backpedaling on rate-cut expectations for two months.
… THAT is all for now. Off to the day job…






Thanks for sharing your experiences & biases! It's been inverted over 3 yrs now, I'm rather surprised to see the 30yr & 20 yr have nearly uninverted. Ominous?