while WE slept: USTs bull FLATTENING (geopolitical risk OFF) on above avg volumes; 'PPI missed but details stronger' and 'Treasuries Head Toward Late 2023 Highs in Relief Rally' (total return)
DON’T answer that … I’m still catching up with inbox and will offer a quick read of what it is I think I saw and comment first on longer end of the curve. I HOPE (not a guarantee, given the upcoming fathers day celebrations ? there are to be celebrations, aren’t there?), to put something out over the weekend … perhaps find another ‘most interesting chart’ …
On THAT note, long bonds were holding on to 4.427% for dear life like the top button on Chris Farley’s (rest in peace) shirt collar … and … the levy broke as PPI followed CPI with some friendly news for the Fed and Team Rate CUT and many / most starting to embrace the longer end of the curve. Here’s a look at 10s for goofs…
10yy DAILY: TLINE ‘resistance’ (4.34) did break but / and momentum becoming overBOUGHT in the process … IF long (not saying I would have been) this MAY be better opportunity to ‘lighten up’ ahead of weekend and let some others ‘fight it out’ …
… It would appear the day started off offering yet another feather in the cap of Team Rate Cut and so, as it stands at moment, 10yy are DOWN MORE THAN 20bps ON THE WEEK !! …
ZH: Producer Price Inflation Cooler Than Expected (But Hovers Near 1 Year Highs)
… and so, with ‘the flation now dead …
… It is dead, right? Not only dead but also buried for sure (wasn’t it only a week ago we had a <questionably> strong NFP report?), the table was set for those jumping in to the long end’s liquidity event …
ZH: Stellar 30Y Auction Sends 10Y Bond Yield To Three Month Low
… AND all this added up to an end of day commentary …
… so it would then seem to ME that ‘bad’ is good but not bad (or good) enough? Oh forget it … here is a snapshot OF USTs as of 705a:
… HEREis what this shop says be behind the price action overnight…
… WHILE YOU SLEPT Treasuries are bull-flattening on a geopolitical risk-off tone, underperforming aggressively-squeezed bunds (10y -11bps) as peripheral spreads continue to widen (BTP 10y +12bps to Gmy). France continues to lead weakness, with CAC futures -2.4%, EUR XCCY and ASW moving in sympathy with broader risk-off conditions. Our traders in London note UST OFTR paper is under some pressure too, despite not seeing a great amount of selling from FRM thus far (more on MoF data below). Leverage and position-crowding remains the story, with EM-FX crosses weaker and S&P futures -0.6% here at 7am. UST volumes are running ~120%.
… and for some MORE of the news you might be able to use…
NEWSQUAWK: US Market Open: Political uncertainty in Europe hits sentiment, JPY initially slipped post-BoJ but now flat … USTs are flat, EGBs soar amid political uncertainty in the region, with the OAT-Bund spread widening to over 78bps … USTs are flat with specifics light and the marked widening of European spreads not having much influence in USTs just yet. BoJ the main macro event thus far which saw rates maintained and the announcement that they will be reducing the bond buying place; however, this will not be unveiled/enacted until the July meeting.
Finviz (for everything else I might have overlooked …)
Moving from some of the news to some of THE VIEWS you might be able to use… here’s SOME of what Global Wall St is sayin’ …
BARCAP: US Economics: We estimate May core PCE at 0.13% m/m (as the dust settles, chips are now placed down on the table for the upcoming PCE …)
Our translation of this week's May CPI and PPI estimates points to a 0.13% m/m (2.6% y/y) increase in core PCE prices and a flat print (2.6% y/y) for the headline index. We lower our Q4/Q4 forecast for core PCE by 0.1pp to 2.8% for 2024.
Homebuilding and infrastructure-related stocks were among the top performers over 2 busy days of macro data, including bullish surprises on CPI & PPI but a somewhat hawkish FOMC. Conversely, Staples were among the biggest laggards, framing critical margin risks as the Fed navigates a narrow path forward.
DB: May inflation recap: Don't forget the cloud for the silver lining
Both headline CPI (unch. vs. +0.31% in April) and core (+0.16% vs. +0.29%) were softer than expected, largely a function of weaknesses in core services excluding housing, particularly in transportation services. Taken together, the year-over-year rate for headline ticked down a tenth to 3.3%, while that for core fell by two tenths to 3.4%. Shorter-term trends showed improvement, with the three- and six-month annualized rates falling by 80bps (to 3.3%) and 30bps (to 3.7%) respectively.
The PPI featured strength in major categories that pass through into core PCE, namely hospital prices, which could be a tailwind for core PCE going forward. All in all, our read based on the May CPI and PPI data is that core PCE should increase +0.17% m/m, which would have the year-over-year rate fall by 12bps to 2.63%. One note of caution is that our estimate does not include the -10.2% plunge in the seasonally adjusted PPI for international scheduled passenger air transportation. Our estimate would be about 5bps lower if the BEA does not smooth through this drop.
While the overall May CPI data was weaker than we expected, the details point to a largely unchanged forecast. Our initial read on the May core CPI data is that it should come in at +0.25% m/m (just rounding up to 0.3%), with the year-over-year rate ticking back up a tenth to 3.5%. While our 2024 core CPI forecast has fallen by two-tenths to 3.3% (Q4/Q4), this mostly due to incorporating the May data. We continue to expect core CPI falling to 2.5% in 2025 and 2.4% in 2026 (both unch.). The aforementioned May core PCE print is close to what we had penciled in prior to this week's data; as such, our core PCE forecasts are largely unchanged: 2.7%, 2.2%, and 2.0% for 2024-2026 respectively. The analogous numbers for headline CPI are 2.8%, 2.6%, and 2.3% for 2024-2026 and 2.2%, 2.3%, and 1.9% for headline PCE.
In terms of the Fed, our baseline remains only one cut this year in December (see "US outlook update: Trying to reason with election season"). However, the May inflation data do keep the door open to a September rate cut. That outcome requires the next few months to show similarly tame inflation readings and possibly some softening in the growth and labor market data. Indeed, Powell emphasized in his press conference that rate decisions are not just a function of inflation readings, but that they are based on the "totality of the data."
MS FOMC Reaction: Conservative Fed Awaits More Data (still more to say on this)
"Most" participants chose not to incorporate new CPI data, which makes the dot plot less hawkish than it appears. Powell says the Fed is not confident in its projections. Our inflation forecasts point to a September cut, 3 total this year. Our rates team closes 3m10y receivers.
Key Takeaways
Rates decision: The FOMC held the policy rate unchanged in a range of 5.25-5.50%, where it has remained since July 2023. Recent progress in inflation was acknowledged, but with little feedthrough to the SEP. Despite a move to a one cut median this year, the mode was at two, which we believe includes the Chair. Powell stressed that more good inflation data could shift expectations for policy – "we welcome today's reading and then hope for more like that."
Outlook: We continue to see three cuts this year, starting in September, informed by our core PCE forecasts that reach a 3-month annualized pace of 2.5% ahead of the meeting. Inflation continues to move convincingly lower, and the Fed cuts every meeting through mid-25.
Rates: Our rates strategists see the FOMC's patient and conservative approach as less conducive to retaining duration longs, especially at current levels. They suggest taking profits on the 3m10y receivers.
FX: Our FX strategists expect the broad USD to rise against EUR, in part because we expect yields in the euro area to fall more than in the US. Today's FOMC meeting affirms the Fed-ECB policy divergence that we expect will put downward pressure on EUR.
MBS: Our MBS strategists maintain their long basis view.
Yesterday’s US producer price inflation numbers added to a general sense of disinflation. However, the lower inflation reported in consumer and producer prices will not be fully experienced by consumers. The slowing fantasy price of owners’ equivalent rent does not affect real world spending power. Seasonal adjustments deliberately distort reality, and so disinflation here does not change consumers’ inflation experiences.
US import and export prices are due. Neither take account of tariffs, which are consumer taxes layered on after these prices are recorded. Most of the consumer price for an imported good covers costs incurred after the good reaches the US. Michigan consumer sentiment will continue to detail political polarization. Inflation expectations data is not detailed along party lines, but polling evidence suggests Republicans think inflation a far bigger threat than do Democrats…
…The Bank of Japan announced it would reduce bond buying—the reduction scale will be determined at the next meeting. This may be an additional form of policy tightening (depending on what is happening with liquidity demand), but reducing purchases to around two thirds of current levels should have a limited bond market impact.
… And from Global Wall Street inbox TO the WWW,
Apollo: The Transmission Mechanism of Monetary Policy Is Much Slower than Normal
Before the pandemic, the share of outstanding mortgages with interest rates below 4% was 38%. Today it is 63%, see chart below.
In other words, housing is adjusting very slowly to Fed hikes. Millions of households still benefit from having locked-in low mortgage rates during the pandemic.
Put differently, the transmission mechanism of monetary policy is much slower than normal, and the Fed will need to keep interest rates higher for longer to get inflation under control.
Relieved Rally This week’s Federal Reserve decision ended up playing second fiddle to inflation data. The closely watched core consumer price index, which excludes food and energy costs, stepped down for a second month in May, data released Wednesday showed. The surprise miss boosted investor hopes that cost pressures will stop being so sticky.
The bond rally picked up pace Thursday as separate figures showed US producer prices unexpectedly declined in May. That helped drive strong demand at an auction of 30-year Treasuries, and sent yields across the curve to the lowest since April. It also put Bloomberg’s gauge of US government debt very close to erasing this year’s declines — which peaked at a 3.4% loss through April 25.
…Buyers Beware Little A touch of trouble didn’t do much to cool appetites for most new bonds. The UK received record demand for a sale of 10-year gilts on Tuesday, after it offered a larger-than-expected discount to existing debt. That was followed by a US auction of 10-year Treasury notes that drew unusually strong interest.
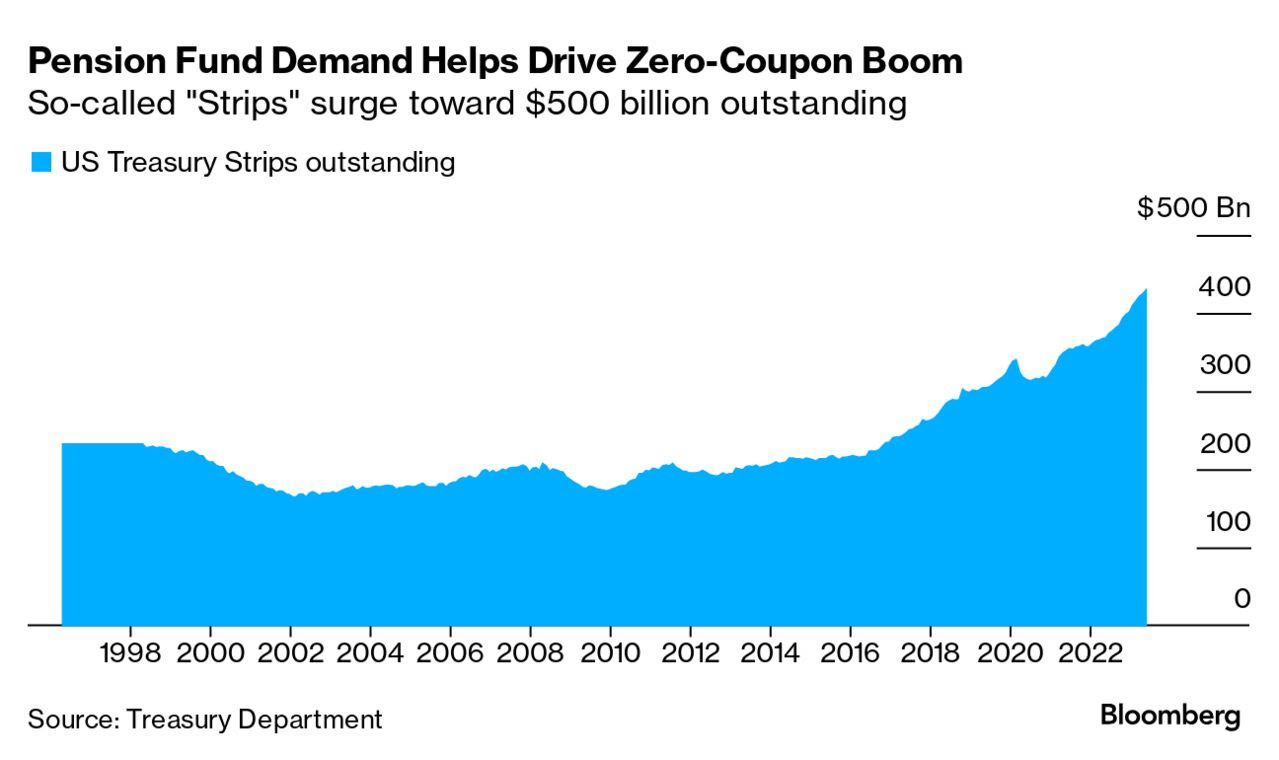
Source: Treasury Department
Pension funds also look to be very keen to load up on longer-term US debt, judging by the way that the amount of zero-coupon Treasury bonds outstanding rose in May to a new high of nearly half a trillion dollars. Dealers create the notes by breaking whole bonds into their future principal and coupon payments and selling them as individual securities. They offer maximum exposure to changes in yield, and also long durations, which pension funds need to match the long maturities for their liabilities.
Higher coupon payments are driving demand for corporate notes, too. Yields are also in vogue for retail investors, with the biggest ETF tracking collateralized loan obligations swelling to $10 billion in assets…
The hardening of interest rate cut discounts and their ultimate delivery typically correlate with falls in market rates right out the curve. We see this being a feature for both eurozone and US market rates. This remains the path of least resistance unless the data negates it
StockCharts: Stock Market Pushes Higher, But Is There a Bond Market Surprise Brewing?
Well, the awaited CPI came in cooler than expected. The stock market liked what it heard, and equities rallied. So did bond prices. Later in the day, the Fed announced its interest rate decision, which, as expected, was unchanged.
More importantly, the Fed's Summary of Economic Projections implies a quarter percentage point rate cut this year. The stock market has priced in more than one rate cut in 2024, yet the broader equity indexes didn't react much to this news.
Thursday's lower-than-expected PPI and an uptick in weekly jobless claims may have added more optimism for equities. Both support the interest rate cut narrative. The S&P 500 ($SPX) and Nasdaq Composite ($COMPQ) closed at new highs.
It doesn't seem like there's much that will come in the way of the market's path to pushing higher. Pullbacks have been mild, the CBOE Volatility Index ($VIX) is low, and the AI frenzy continues. There's no reason to start cutting rates when the going is good. Looking at past interest rate cycles, you'll see that interest rate cuts happen when an economy slows down; so far, we're not seeing any signs of that happening.
Bond Bonanza
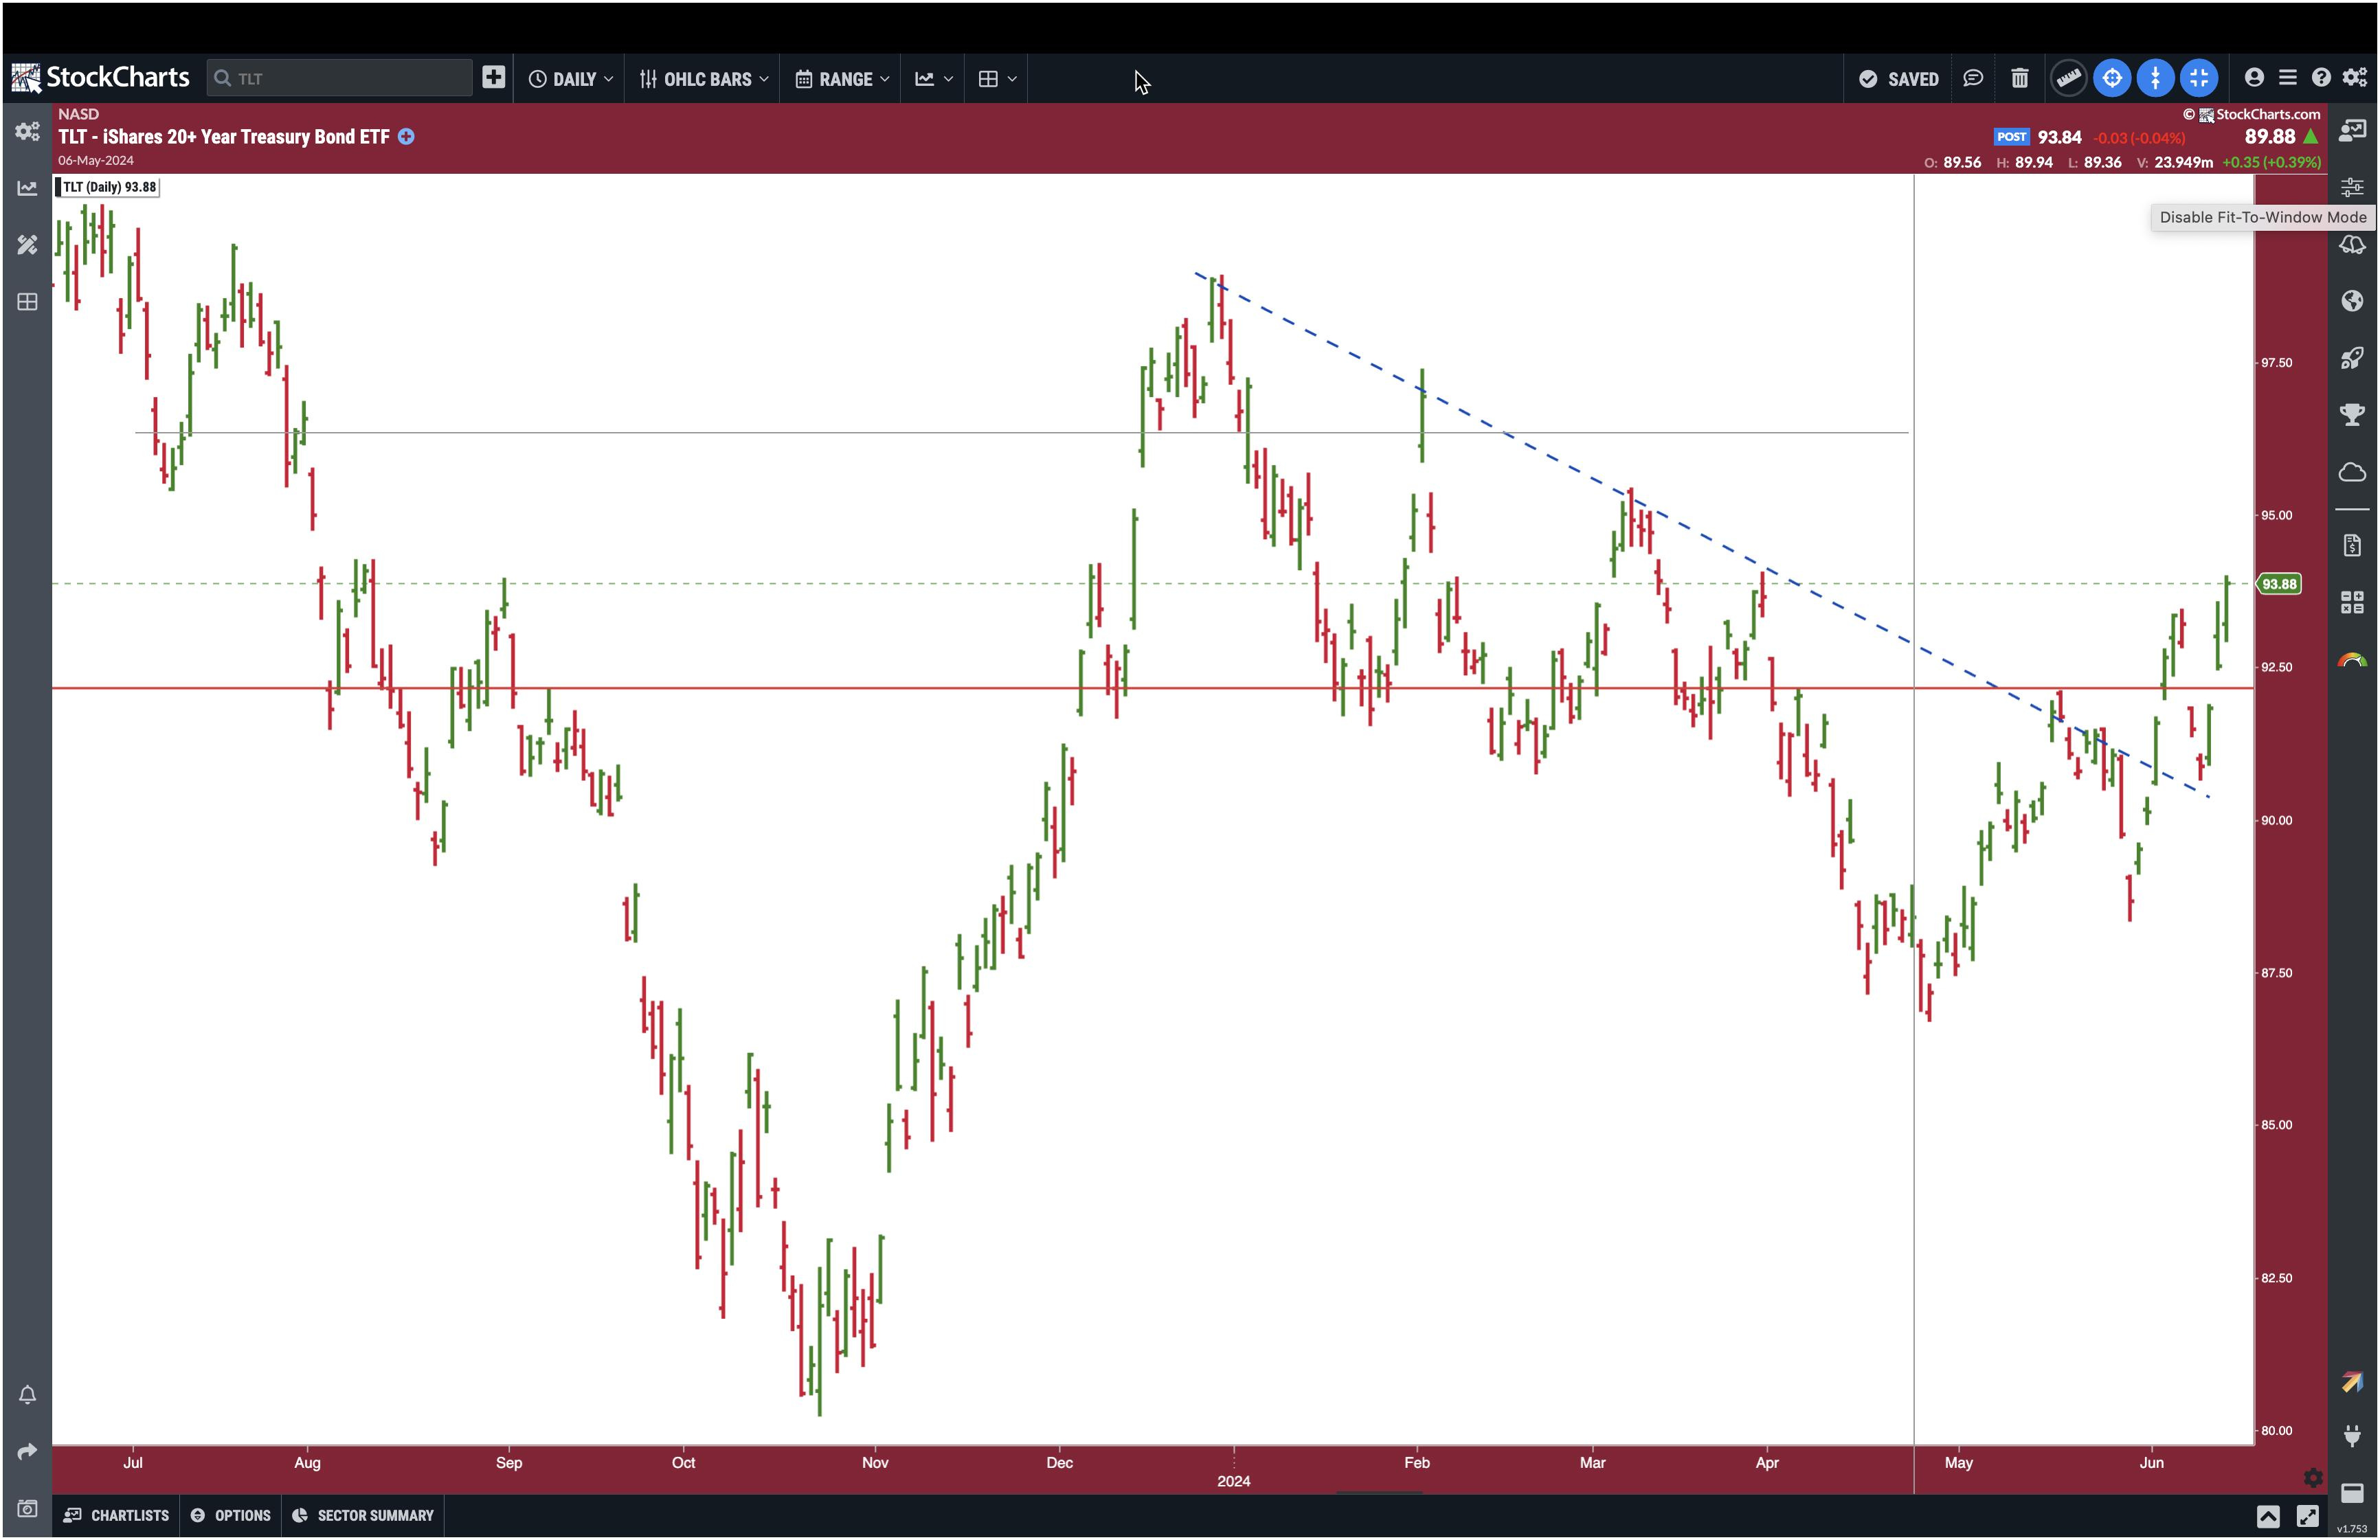
The price action in bonds has been interesting. As Treasury yields decline, bond prices rise. The daily chart of the iShares 20+ Year Treasury Bond ETF (TLT) below broke above the downward-sloping blue dashed trendline on June 3. The next day, TLT broke above its previous high (May 16) of around $92. A few days later, TLT pulled back, but still stayed above the downward-sloping trendline.
CHART 1. DAILY CHART OF TLT. The ETF broke above its downward-sloping trendline and above its previous May high.Chart source: StockChartsACP. For educational purposes.
After Wednesday's double-whammy economic data day, TLT has continued higher. Thursday's price action is pretty convincing that bonds may have started their climb higher. Does it mean it's time to jump into bonds? The price action in TLT may have to do with the successful 30-year bond auction, so it's best to wait and see what happens in the next couple of days.
… and a live look in at how those LONG the longer end of the curve are feeling right about now …


 Short Bonds")