while WE slept: USTs 'aggressively UNCH' on light volumes (earlier Hamptons Hedge?); Supercore trending higher and ... "The golden rule of Maurice Allais"
Good morning … from FOMCs hawkish minutes, we turn the page and on to …
Reuters: PMIs to lead as central banks wait on rates
Flash Purchasing Managers Index (PMI) figures in the euro zone, the UK and the United States take centre stage on Thursday, and investors will be on the lookout for whether the global growth narrative is showing signs of change.
… meanwhile back at the ranch, as the week began … bearish, bullish, bullish.
THIS is how 2yy were described on Monday morning, ahead of Fedspeak, HERE … Depending on your time frame and point of view, it was and remains correct. That said, with yest more hawkish FOMC minutes, I wanted to check back in and so …
… AND with a look at where we are NOW, at least as far as the 2yy is concerned, a couple / few links helping show how it is we got here ….
ZH: Existing Home Sales Unexpectedly Tumble As Homebuyer Confidence Hits Record Low
… and THEN with an hour to go before FOMCs minutes …
ZH: Solid Demand For 20Y Paper In Week's Only Coupon Auction
… and finally, as we mulled over details OF supply an hour earlier, well …
ZH: 'Hawkish' FOMC Minutes Show 'Various' Members Willing To Tighten More, Fear Financial Conditions 'Too Easy'
… Keeping in mind, its not just ME (or ZH) deeming these hawkish but if you listen to a view here and there, well … you’ll get sense there are some VIPs out there who are not YET on board and card carrying members of Team Rate Cut. DJ Jazzy David …
Bloomberg: Goldman’s Solomon Says He Sees ‘Zero’ Rate Cuts This Year
CEO says he doesn’t see compelling data to support rate cuts
Average Americans are feeling pinch from inflation: Solomon
… “I think a lot of us around the table that are more the practitioner side and are speaking to a lot of clients, CEOs and otherwise, are more circumspect about whether the Fed actually can move that early,” he said. “There just seems to be more inflation in the system.”
… here is a snapshot OF USTs as of 705a:
… HERE is what this shop says be behind the price action overnight…
… WHILE YOU SLEPT
Treasuries are aggressively unchanged, after a choppy rally on softer France PMI, then reversal cheaper on the back of stronger German PMIs, then a U-turn to flat after soft UK services PMI and EU wage data notably marred by one-off payments. A 10k TU buyer and 10.7k FV block buyer have been supportive in London hours, bund futures bouncing off the lows as well with long-end outperformance seen. For flows we've seen some selling from systematic accounts in 20s countered by buying in the belly from real money. Overall volumes are running ~75%, with metals (HG -1.2%, XAG -0.7%) and China equities (SHCOMP -1.3%, CNT -1.3%) weak overnight. US equity futures are more buoyant on the back of AI-tangential earnings strength (NQs +1.0%), while gasoline futures are +1.3%.
… and for some MORE of the news you might be able to use…
IGMs Press Picks: May 23 2024
NEWSQUAWK: US Market Open: NQ outperforms post-Nvidia earnings, Bunds softer following German/EZ PMIs; Fed's Bostic due … Treasuries are flat, whilst Bunds are softer following German/EZ PMIs ahead of US supply … USTs are contained with only limited spill-over selling seen in the wake of EZ PMI data with US metrics looming large later in the session; For now, the Jun'24 contract remains tucked within yesterday's 108.28+-109.08 range.
Reuters Morning Bid: Nvidia aces Fed, tense Taiwan and UK poll (along with NVIDIA, an excellent VISUAL, “PCE inflation stays above the Fed’s target”
Finviz (for everything else I might have overlooked …)
Moving from some of the news to some of THE VIEWS you might be able to use… here’s SOME of what Global Wall St is sayin’ …
BNP UK inflation: A sticky situation
KEY MESSAGES
Wednesday’s upside surprise to UK inflation poses a challenge to the BoE’s view that inflation persistence is easing, and as such we now expect the first cut to come in August (from June previously).
We think the magnitude of the surprise and the broad-based nature of the strength in services inflation will make it difficult for the MPC to dismiss the reading as mere volatility.
We still expect core inflation to fall back over 2024 and 2025 and as a result still see Bank Rate ending 2024 at 4.50% and 2025 at 3.50%, although incoming data suggests risks tilt towards fewer cuts in 2024 than our central case.
CitiFX: USD & US rates: Trend remains intact (these visuals far better than mine)
Since the US CPI and especially post the mintues, we have seen a bounce in USD and higher yields. While this has brought us close to key levels, this does not change the broader trend (Lower USD and US yields)…
…US 2y yields
A small uptick in recent days brings us close to resistance at 4.89% (May 14 high). We remind this was a level we posted a reversal candlestick from, making this level reasonbaly strong.Weekly slow stochastics has also crossed lower from overbought territory in US 2y yields, suggesting lower yields. The key test remains 4.73-4.74% (55w MA and Feb/Mar highs). IF we close below on a weekly basis, it would suggest a larger move lower.
…US 10y yields
US 10y yields found short term support at 4.33%-4.35% (200d MA, Feb high). The bounce higher looks to have run out of steam, we expect resistance around 4.49% (Apr 19 low).We think a medium term dip in yields is likely after crossover from overbought territory in weekly slow stochastics. This is supported by the weekly evening star in early May and bearish outside week last week
Key support to watch is 55w MA at 4.20%. This has held since 2021, except for the brief false break in late 2023.
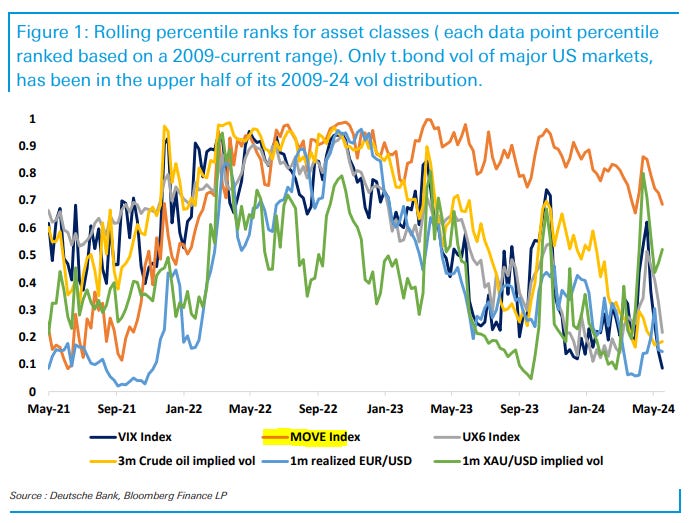
DB: A "Global Put" suppresses Macro Vol (Ruskin writes we all lean in and here is another case in point … for better or worse, vol. just … vol…used to be a thing…and when income depends on it — ie traders / sales and FICC desks at banks — and there isn’t any, well …)
The US bond market has been the life and soul of the party. In the last few years, the question was largely about how long it would take for other asset markets to respond to higher bond vol. A corollary question was without bond vol, how low would FX and equity vol have slid? That question is becoming more pertinent as bond vol starts to slide through the lower end of its 2 year range.
As a measure of relative vol, Figure 2 below shows how Bond to FX vol ratios have until recently been hovering near levels where this ratio typically peaks. A peak is finally being achieved, but all because of lower bond vol.
Asset markets need to brace themselves for a continuation of this lower bond vol, for there are at least four macro reasons why this core source of vol may remain more subdued, including …
DB: BoE Change of View – summer rate cut now in the balance (based on the above, this note seems worthy of … well noting)
We are changing our Bank of England (BoE) view.
Despite headline CPI coming in only a tenth above our expectations (2.3% y-o-y vs 2.2%), services inflation – yet again – beat our estimates by a long mile. For a third consecutive April, services CPI outshot consensus and the MPC's modal projections coming in at 5.86% y-o-y (BoE exp: 5.52, DB exp: 5.42% y-o-y).
We now expect the MPC to start dialing down restrictive policy in August (previously June). But a summer rate cut no longer looks like a done deal. Risks are skewed to a later start in Q3-24 with the first rate move now looking more finely balanced between August and September.
We tone down our expectations for the quantum of rate cuts expected this year from 75bps to 50bps, and now expect the BoE to cut Bank Rate in August and November. A quarterly pace through the next year remains our basecase. And while we continue to retain our 3% terminal rate view, we think there are upside risks building.
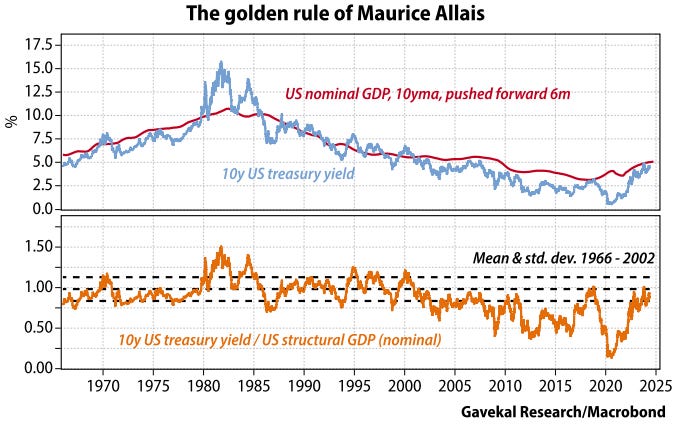
GavekalResearch: Auditing My Bond Market Model (model / schmodel, am a sucker for a longer-term (macrobond and / or BBG) visual and this one’s good)
… My starting point is the “golden rule” of Maurice Allais, a French Nobel Prize winner in economics. It stipulates that in an open economy long rates always return to the economy’s structural growth measured in nominal terms (see Building A Bond Valuation Tool). As such, my first chart shows the relationship between US long rates and US nominal GDP growth in the prior 10 years (the “structural growth rate”).
… To adjust for these anomalies, I put into my model a second variable in the form of US short rates as shown in the first chart overleaf. The idea here is to provide an indication of a long bond’s carrying cost if the purchase is funded with short-term money.
… And since the summer of 2019, when I turned bearish on US long bonds, instead of losing 15% on my portfolio, I made around 10% in cash.
Once again, my goal is not to forecast whether rates will go up or down in the future, but to determine whether, at this moment, I should sell or buy longterm bonds…
… General conclusion
The only market where I would buy 10-year government bonds seems to be Japan. This is counterintuitive as Japan offers the lowest yield among the bond markets I track with my model. Among the others, I would stay in cash. For those able to deploy cash funds into foreign currencies, the two most undervalued ones on my radar are duly the yen and the Swedish krona…… The reality is simple: most OECD bond markets have been uninvestible for quite a while, and remain that way. This is one reason, at least, why stock markets is those economies have probably kept going up.
Goldilocks: FOMC Meeting Minutes Display Range of Views on Inflation Outlook and Policy Risks
BOTTOM LINE: The minutes to the FOMC’s May meeting emphasized that the Q1 inflation data had shown “a lack of further progress” toward the Committee’s 2% inflation target. But while “some” participants stressed that the recent inflation increases had been broad based, “several” participants noted that volatile components had boosted recent inflation readings and “a few” said seasonal distortions may have pushed up January core PCE inflation. The minutes also displayed a wide range of views on the risks to the policy outlook. While participants generally discussed either keeping the current fed funds rate for longer if inflation proved more persistent than expected or cutting the funds rate if the labor market deteriorated, “various” participants noted “a willingness to tighten policy further” in the face of upside risks to inflation. FOMC participants did not interpret the recent growth data “as indicating a further acceleration of activity” and continued to expect GDP growth to slow this year.
Goldilocks: The Consumer Remains More Likely to Cruise than Crack (Guessing they are NOT card carrying members of Team Rate Cut )
Overall spending remains healthy but concerns around the consumer (particularly at the lower end) have picked up on the back of weaker company commentary, a weak April retail sales report, and signs of a slowing labor market.
Despite the recent softer signals, we maintain our long-held view that a worker-friendly labor market will support consumer outperformance. Under our baseline labor market assumptions of 150-175k monthly job gains and 3.5% wage growth through end-2024, we forecast a healthy 2.5% pace of real income growth with positive gains for all income quintiles in 2024, which should translate to healthy spending growth.
We put some weight on the softer signals this spring, however, and see three factors that likely led to some slowing. First, increased tax withholding and capital gains tax payments at the start of 2024 raised the effective tax rate, thereby lowering discretionary cash flow. Second, tax refunds declined in real dollars. Third, upside inflation surprises in Q1 weighed on real income and spending growth and likely lowered consumer sentiment. The good news is that these headwinds are all backward looking, assuming inflation cools in line with our forecast.
We also see two risks that could slow spending growth going forward. First, rising delinquency rates and signs that some lower-income households are exhausting borrowing capacity raises the possibility that households will have to cut back on spending, but the impact on overall spending should be small. Second, we see more meaningful spending risks if the recent labor market softening extends too far, as each 1pp increase in unemployment would likely lower overall spending by 0.6%, led by a 1.2% spending hit for lower-income households.
On net, we put more weight on the likelihood that spending momentum will continue and forecast 2.6% real PCE growth in 2024 on a Q4/Q4 basis, well above consensus. That said, we continue to see risks around our spending growth forecast as asymmetrically skewed to the downside, mostly because the saving rate is already low and there is no clear catalyst for an acceleration in spending going forward.
We Expect Real Spending Growth to Remain Healthy
Goldilocks: Existing Home Sales Somewhat Below Expectations; Lowering Q2 GDP Tracking to +3.1%
BOTTOM LINE: Existing home sales declined 1.9% in April to a seasonally adjusted annualized rate of 4.14 million units in the April report, somewhat below consensus expectations. The median sales price of all existing homes increased 0.5% month-over-month, while the imbalance between housing supply and demand was unchanged. We lowered our Q2 GDP tracking estimate by 0.1pp to +3.1% (qoq ar) and our domestic final sales estimate by the same amount to +2.4%. Our past-quarter GDP tracking estimate for Q1 remained unchanged at +1.3% (vs. +1.6% originally reported).
Wells Fargo: Existing Home Sales Retreat in April - Affordability Concerns Loom Over the Spring Selling Season
Summary
Resale Market Takes a Step Back
Higher mortgage rates appear to be pouring water on the resale market. Existing home sales dipped for the second consecutive month in April, corresponding with a steady increase in the 30-year fixed rate over the months prior. Resales have still improved on balance this year, but higher interest rates threaten to set back the housing market recovery. Rising prices are also worsening affordability conditions and raising the hurdle for homeownership. There are several reasons to remain cautiously optimistic, however. Growing resale supply is a tailwind as April’s slower sales pace led to the highest inventory count since October 2022. Furthermore, we expect mortgage rates to trend lower this year as inflation gradually subsides and the Fed begins easing policy in the fall.Wells Fargo: Do We Have Potential?: An Analysis of U.S. Potential Economic Growth
As noted in Part I of this five-report series, an economy's potential rate of economic growth is determined by growth in its labor force and its underlying rate of labor productivity growth. Labor productivity growth can be further disaggregated into three components (growth in the capital stock, changes in labor “composition” and changes in total factor productivity). We focus on the outlook for capital accumulation and its impact on U.S. productivity growth in this third installment of the series.
Summary
Labor productivity is one of the primary determinants of an economy's potential rate of economic growth. Productivity has waxed and waned over the years, but it is considerably slower today than it was during the halcyon economic years of the 1950s and early 1960s.
Labor productivity is determined by growth in the capital stock, changes in labor “composition” (i.e., labor quality) and changes in total factor productivity (TFP, i.e., changes in technology and other processes). Growth in the capital stock and changes in TFP have largely dictated productivity growth in recent years. We focus on growth in the capital stock in this report.
Over the past expansion (2010-2019), total labor productivity growth in the business sector slowed relative to the 1990s and the early years of the 21st century. Productivity growth was slower in the service sector, and especially in the manufacturing sector, partly due to slower rates of capital accumulation.
The economy's capital stock reflects the value of capital assets (i.e., structures, equipment and intellectual property products) at a specific point in time, and its change is determined by business fixed investment spending less depreciation. Growth in the economy's capital stock, and hence its productivity growth, downshifted after the tech bubble burst in the early 2000s.
Capital stock growth picked up in the factory sector, and more notably in the service sector, coming out of the global financial crisis. Yet growth in labor productivity remained lackluster compared to the 1992-2007 period, implying weak TFP growth during the 2010s.
Looking forward, we see the build-out in capital required for the widespread adoption of automation and artificial intelligence (AI) as a major upside for labor productivity. The necessary accumulation of hardware and software to use AI effectively may cause capital accumulation growth to strengthen and could lead to stronger productivity growth.
Reliable estimates of the volume of hardware and software investment required to support the AI transition are not readily available. Using a scenario analysis, we estimate capital accumulation can account for 1.7 percentage points of the annual rate of productivity growth by the end of the decade, which represents a six-tenths improvement from the past decade's average contribution.
Ultimately, capital accumulation is just one part of the productivity puzzle. The lackluster trend in labor productivity growth over the past expansion, despite the acceleration in the capital stock, implies weak TFP growth. While the AI build-out across the business sector will require significant capital investment in hardware and software, it will also likely come with a rise in efficiency and improvements to other processes that manifest in total factor productivity gains, a topic to which we will turn in the next installment of this series.
UBS: The Philosophy of Politics and Economics (one ECONOMIST says …)
US President Clinton’s admonition “It’s the economy, stupid” puts economists in their proper (superior) place. But which economy? Economists get excited about inflation, but voters think in terms of price levels—a higher price level can be considered unfair even as inflation falls. GDP is too abstract for voters, who do not care whether “growth” is -0.1% or +0.1%. Economic perceptions (honest perceptions, not sentiment surveys) drive politics…
… Minutes of the last Federal Reserve meeting are being branded hawkish (though a lot of the “hawkish” spin was more statements of the obvious. If inflation were to get out of control, the Fed would obviously raise rates). With market-determined prices disinflating, does “higher for longer” really achieve anything?
Yardeni: Dow 60,000: Here We Come (really Ed? yes, really)
The Dow Jones Industrial Average closed above 40,000 for the first time on Friday, May 17 (chart). Today it is back down slightly below this level. We hope the title of this QT doesn't turn out to be a jinx, but we are still aiming for Dow 60,000 by 2030 in our Roaring 2020s scenario. Along the way, there could be corrections and even another bear market. But we expect that earnings will drive the stock market higher.
Just for fun, we drew some trend lines on a chart of the DJIA and stumbled on a channel that started around 2010 which can be extrapolated to a range of 45,800 to 76,700 by the end of the decade. The mid-point is 61,250. Mark your calendars!
For the here and now, Dow Theory suggests that the DJIA's recent rise to a new high won't be sustainable unless it is confirmed by the Dow Jones Transportation Average (DJTA), which remains below its record high. We think that leaner business inventories will soon boost demand for transporting goods and relatively stable fuel prices will also benefit transports. (Jackie will cover this story in tomorrow's Morning Briefing.)
… Finally, the latest FOMC minutes came out this afternoon and showed that the committee is perplexed. They aren't sure about the degree of the Fed's restrictiveness and are concerned that inflation hasn't been falling faster to their 2.0% target. Some of them mentioned that the Fed might have to tighten if inflation stalls. Stocks edged lower on the news. We suggest that they take the summer off until they are less uncertain…
… And from Global Wall Street inbox TO the WWW,
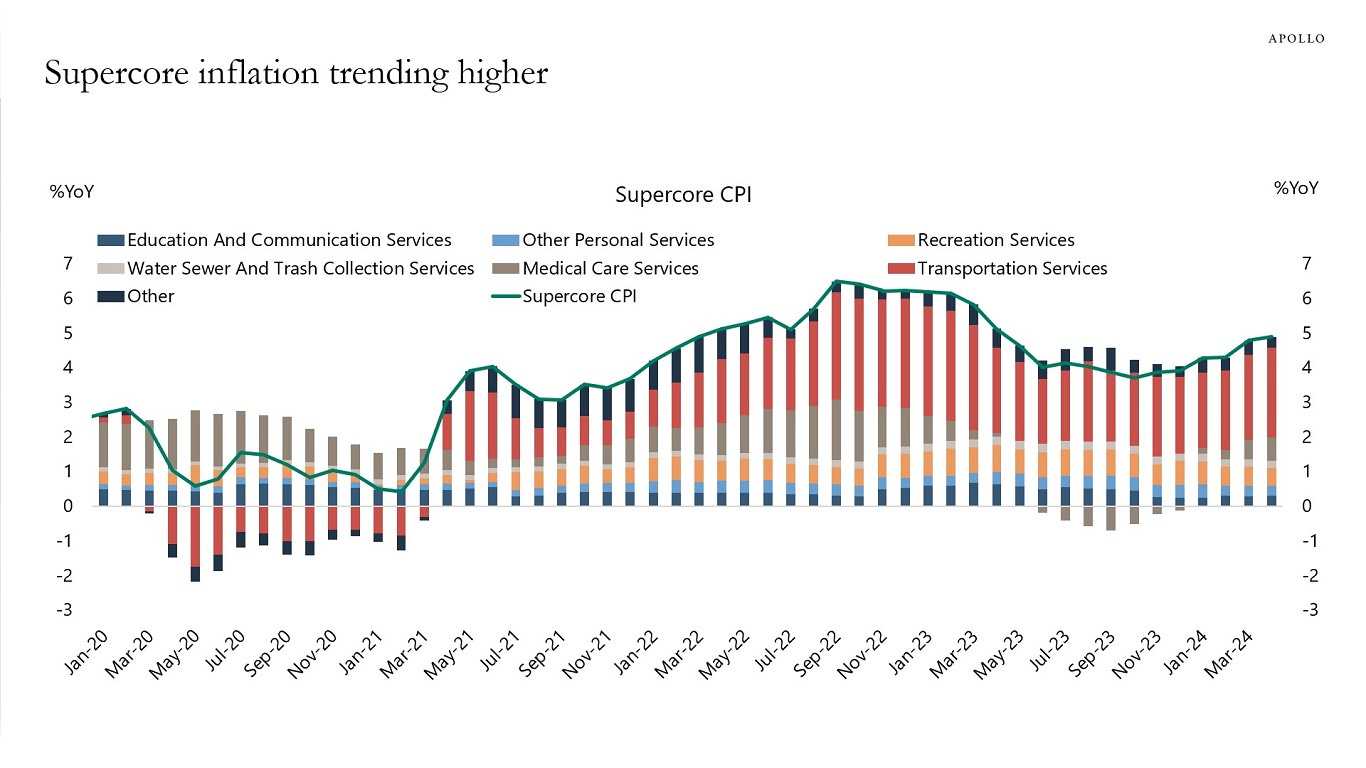
Apollo: Supercore Inflation Trending Higher (Team Rate Cut … please comment, thanks bye)
The key reasons why supercore inflation remains high are auto insurance and hospital services, and it is a legitimate question to ask whether the Fed keeping interest rates higher for longer will slow down inflation in those two categories, see chart below.
The problem with that logic is that housing inflation is also high, and if the Fed were to lower interest rates, it would put new upward pressure on the demand-driven components of CPI, including housing inflation, airfares, hotel prices, restaurant prices, etc.
The bottom line is that if the Fed, instead of focusing on the overall CPI index, decides to put less weight on housing inflation, auto insurance, and hospital services, it runs the risk that Fed communication about what is important and what is not important becomes very difficult. This challenge is particularly difficult when the Fed is already being asked why it puts no weight on inflation in food and energy.
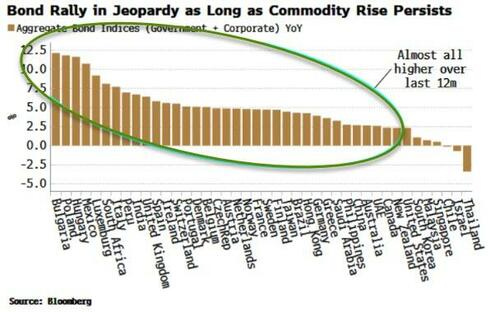
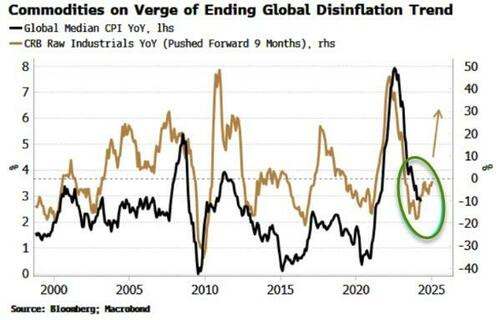
Bloomberg: Global Bond Market On Verge Of Selloff As Commodities Reawaken
Aggregate bond indices are up in most countries on an annual basis. But the broadening commodity rally threatens to feed into global inflation and kickstart another bond selloff.
A year ago almost all aggregate (corporate + government) bond indices were on the back foot. But throw in a dash of optimism, a soupçon of disinflation and a helping of less hawkish central banks and almost all indices are up over the last year. Thailand and Israel’s indices are the only two real exceptions; the rest are higher by anywhere from 2% to over 10% in Poland and Hungary’s cases.
Commodities are on the march though. Indices such as Bloomberg’s Commodity index are close to breaking out of their 12-month ranges, while Bloomberg’s Spot Commodity Index, which does not include the cost of rolling future positions has already broken out.
Non-exchange traded commodities, such as burlap, wool tops, tallow and rubber – as captured by the CRB Industrials Index – have also started rising. The CRB Industrials leads global median CPI – the median of almost 50 countries’ headline CPI indices – by around six months. The rise in commodities points to the end of the global disinflation trend.
The commodity rally looks set to persist …
PGIM: Rebalancing into Bonds, Great Power Competition
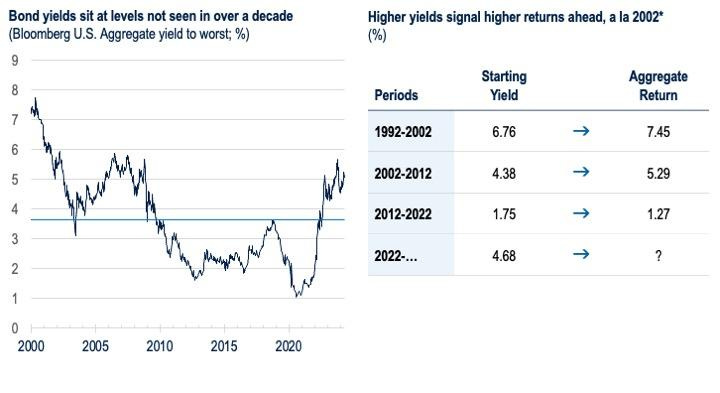
With yields up at levels not seen in more than a decade, bonds are definitely catching the eye of investors. But with equities delivering strong gains and Treasury curve inversions incentivizing investors to idle in cash, will bond returns be competitive? In the current market environment, we see a compelling case for rebalancing into bonds vs. both stock and cash. The figures below tell the story, highlighting the pros and cons of cash, bonds and stocks, as well as their roles in portfolio construction.
Before jumping into the figures, a few conclusions to set the scene:
True, cash rates remain high. But unlike bonds, the returns from cash over the long term are highly uncertain. And to that point, central banks are preparing to cut rates.
Equity valuations look full relative to bonds. This is not so much a knock against stocks, but this configuration has historically signaled that bonds are set to deliver better-than-average returns and Sharpe ratios.
In environments where central banks are on hold or cutting rates, bonds have historically been good shock absorbers, on average delivering solidly positive returns in quarters when equities experience steep declines (see our accompanying webinar for additional details).
… FIGURE 3
EQUITY VALUATIONS ARE NOT CHEAP VERSUS BONDS.
Whether you’re looking at the last few years, or the last century, equities might seem like the place to be. Notwithstanding the excellent wealth building capacity of stocks over the ultra-long run, in the current context, it’s worth considering that the recent repricing of bonds has taken yields to generational highs; the same cannot be said of equity valuations. For example, comparing the earnings yield of the S&P 500 with the 10-year Treasury yield shows that stocks have lost their relative valuation advantage vs. bonds. We look at the potential implications for risk and return in a subsequent figure.
FIGURE 4
WITH YIELDS BACK UP AT 2002 LEVELS, THE OVERALL FIXED INCOME BACKDROP LOOKS PROMISING.
In contrast to equities—where price-earnings ratios are high and earnings yields are low—the revaluation in bonds has taken yields back to levels not seen for more than a decade. For long-term investors, this is a critical point: if past is prologue over the long term, these yields are likely to translate into returns (i.e., Yield is Destiny).
… THAT is all for now. Off to the day job…






Fed on Hold, indefinitely......
Trump goes to the Bronx !!!!!
Trump set for historic Bronx rally: Thousands descend on New York City as residents reveal what they really think of Biden
https://www.dailymail.co.uk/news/article-13448735/trump-south-bronx-rally-biden-nyc-voters.html