while WE slept: USTs steeper w/quiet start; 'Anything But Bonds’ stratEgery 'bout over; HOPE — not a strategy — springs eternally; MSs midyear (S&P) mark2mkt
Good morning … Ahead of a quiet economic funDUHmental week ahead but also one FILLED with FOMC voting members speaking (calendars over weekend HERE), I thought I’d begin with a look at the 2yy as it’s most sensitive TO the interpretation of any / all aforementioned Fedspeak …
DAILY = BEARISH
WEEKLY = BULLISH
MONTHLY = BULLISH
… and so, 2 outta 3 ain’t bad AND likely jives more with Team RateCUT who, the more they dig and look at ALL the data, the worse things look. The front end of the yield curve is nearly putting PAID to this view and the message from The Markets ALWAYS trumps those from data interpretation (which is often subject to the views and positions of the interpreter) …
I know as I used to have more capabilities to search and find BAD. A Bloomberg Terminal actually has amazing capabilities (as it should for over $2k / mo) and one such capability was called an Economic Workbench.
Let that settle in … the ‘pros’ are using said workbench to slice and dice the data, look at innards of everything on a basis that is best suited to their <bullish / bearish> economic views. ALL are quite compelling when put in the correct context.
Now, years on without a Terminal, am only able to look at things AFTER the fact (like price action) as well as take whatever signal I can from my own insulated surroundings.
NJ is NOT representative of much, in my view, and while I COULD complain about gas prices, well, friends on the LEFT coast could then give ME a reality check, as could my friends from across the pond.
I CAN say that NJ the only state in the union where you cannot pump yer own gas and so, all IN, maybe I can / should stop complaining (saying that but you know I won’t).
AAA: LIKE A TIRED PARTY BALLOON, GAS PRICES SLOWLY DEFLATE
… Today’s national average is $3.60, four cents less than a month ago but seven cents more than a year ago.
… Make of THAT whatever you wish. Slowly DEFLATING or, higher than a year ago. Lets continue to watch and touch base closer TO elections and see whatever it is we’re to see. In the meanwhile … here is a snapshot OF USTs as of 705a:
… HERE is what this shop says be behind the price action overnight…
… WHILE YOU SLEPT
Treasuries are ever so slightly steeper after a very quiet start of the week in Japan, with much of Europe on holiday as well (~45-55% volumes). 10y JGB yields did touch ~0.975%, the highest since 2013, with the desk noting regional bank demand at the level. Modest buying in intermediates was seen on the transfer into London hours, a 6k UXY block posted. Metal markets remain a focus (as our commentary expands on), with XAU +0.9% making a new ATH today >2435, while the BCOMIN is also notching new YTD highs with Copper +1.1%. Major USD-crosses are UNCH’d, Crude is -0.3%, and equity futures are quietly higher in the US and Europe (DAX +0.3%, S&P e-minis +0.1%). APAC stocks benefited overnight from macroprudential support headlines, though China property sectors gave back some gains (SHCOMP +0.5%, SHPROP -1.4%, NKY +1.4%, KOSPI +0.6%).
… and for some MORE of the news you might be able to use…
IGMs Press Picks: May 20 2024
NEWSQUAWK: US Market Open: Equities modestly firmer, DXY flat in catalyst thin trade, XAU & Copper hit ATHs; Fed speak due … Horizontal trade for USTs amid quiet newsflow and a sparse calendar. The back-end of last week saw profit-taking on the CPI/retail sales induced gains earlier in the week.
Reuters Morning Bid: Buoyant start to 'Nvidia week'
Finviz (for everything else I might have overlooked …)
Moving from some of the news to some of THE VIEWS you might be able to use… here’s SOME of what Global Wall St is sayin’ …
BNP: Sunday Tea with BNPP: A step in the right direction
KEY MESSAGES
US April CPI was a step in the right direction, but we need to see much more progress before the Fed cuts rates.
With peak US versus EU economic divergence likely behind us, we like being long 10y US rates versus Europe.
Conditions suggest low vol through the summer. We like overwriting XLE to earn carry.
April’s CPI print was a step in the right direction. Combined rent and OER inflation was in line with our expectations at 0.41% m/m, the slowest pace since December 2021 and down from the prior six-month average of 0.45%. Moreover, we expect it to continue to moderate through the balance of the year, based on our modelling of market rents, home prices and the BLS’ all and new tenant rent indices.
That said, the Fed’s official inflation gauge is PCE and based on the components of April’s PPI report, our forecasts for PCE currently stand at 0.24% m/m. This poses a distinct risk that core PCE could print another uncomfortably high 0.3% m/m unrounded number.
For the Fed to feel comfortable cutting rates, we will need a lot more progress on the inflation front. Indeed, given the hot numbers to start the year and inputting our preliminary PCE forecast for April, it would require a run rate of ~0.15% m/m PCE prints for the rest of the year for the Fed’s 2024 inflation forecast to materialize (Figure 1). That means we need to see a mix of 0.2s and 0.1s from here on out, without much interruption, for cuts to commence.
In addition, although shelter is moving in the right direction, goods prices excluding vehicles were effectively flat for the fourth straight month after posting a string of declines over H2 2023, suggesting that the bulk of goods disinflation is likely behind us (Figure 2). A lot of the heavy lifting, then, will need to come from services…
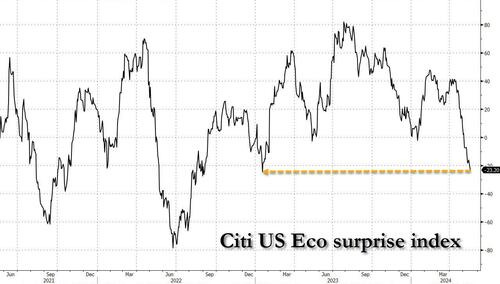
… Outside of inflation, US activity data also featured last week with April retail sales much cooler than expected. While the economy remains in healthy shape as evidenced by the Atlanta Fed tracking GDP at a robust 3.6% this quarter, it’s notable that expectations have risen markedly with the strength of the data in Q1. This means data surprises in the US have moved negative, now at post-Covid lows (Figure 3).
DB: Mapping Markets: The case for nearterm optimism
Markets are currently on a very strong run, with the S&P 500 now up for 22 of the last 29 weeks. That run of 22/29 weekly gains is the joint strongest since 1989, and sovereign bonds have also recovered this month. On top of that, Friday saw the VIX index of volatility close beneath 12 for the first time since 2019. So there’s a lot of good news in markets right now.
But can this strength continue? We think there are several reasons to be optimistic. Indeed, markets saw a strong rally after last week's US CPI print, even though it was still at levels consistent with above-target inflation. So that offers some optimism if the prints move lower to target levels. Moreover, if we get rate cuts in a soft landing scenario (rather than in response to a negative shock), then that could create some very benign conditions for markets, and central banks in Switzerland and Sweden have already done an initial rate cut. At the same time, financial conditions remain accommodative, and markets have even been rallying on slightly weaker data like the recent US jobs report, since that's seen as raising the chance of rate cuts.
DB Investor Positioning and Flows - Sharp Move Up
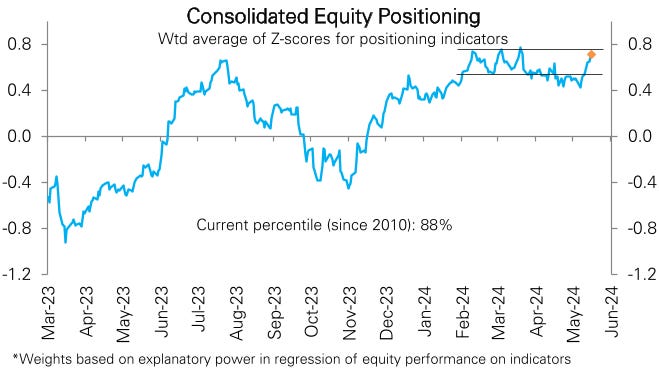
Our measure of aggregate equity positioning moved up sharply this week to the highest in two months, going from the bottom of the narrow band it has been in since early February all the way to the top (z score 0.71, 88th percentile). The jump was driven by discretionary investor positioning (z score 0.88, 93rd percentile), while systematic strategies positioning rose modestly (z score 0.60, 77th percentile). Across equity sectors, positioning in MCG & Tech continues to get trimmed but remains above historical average while that in Utilities is climbing sharply but is still the lowest across sectors and well below average. Inflows to equity ($11.9bn) and bond funds ($11.7bn) slowed from last week but remain very robust. A notable shift is European equity funds ($1.1bn) receiving inflows for a third consecutive week after suffering relentless outflows for well over a year. Likewise, across sectors, Utilities funds received a third straight week of inflows following three months of outflows. Across a variety of indicators, positioning in bonds remains very short and that in commodities very long.
Sharp move up in equity positioning this week
MS Global Economics Mid-Year Outlook: Are We There Yet?
We expect the economy to be characterized by stable growth and moderate disinflation across our forecast horizon through 2025, much like in 1H24. Tight monetary policy should continue to slow growth, even as rate-cutting cycles march along.
Global Strategy Mid-Year Outlook: Sunny with a Chance of Rain
Moderate growth, disinflation, rate cuts, and supportive flows and fundamentals make for a good set-up for risk assets in 2H24. Carry, convexity, and cheap optionality are key themes as investors face uncertainties in 2025. OW in global equities, and in spread products within fixed income.
… G10 rates – a story of two halves: With eight of the G10 central banks forecast to start lowering policy rates ahead of the US election, we expect most investors in government bonds to close underweight duration positions. The set-up of cooling inflation and an optical rise in the unemployment rate is conducive to driving both lower rate expectations and term premiums.
MS US Equities Mid-Year Outlook: A Wider Range of Outcomes and Opportunities
… Base case 12-month price target moves to 5,400: In the base case, we forecast a 19x P/E multiple on 12-month forward EPS (June 2026) of US$283, which equates to a 5,400 forward 12-month price target. Our 2024 and 2025 earnings growth forecasts (8% and 13%, respectively) assume healthy, mid-single-digit top-line growth in addition to margin expansion in both years as positive operating leverage resumes (particularly in 2025). Modest valuation compression (from ~20x to ~19x in the base case) as earnings adjust higher is typical in a mid-to-late-cycle backdrop (occurred in the mid-1990s, mid-2000s, and 2018 most recently). Normalization in the market multiple is also a function of a higher risk premium (lower rates are a partial offset), which reflects uncertainty around a wider range of potential outcomes. On this front, our bull (6,350) and bear (4,200) cases represent ~20% upside and downside potential versus the current index level, respectively. Our bull case reflects stronger (11-15%) EPS growth driven by continued fiscal support and cyclical/structural drivers out to 2026 alongside multiple expansion to ~21x. Our bear case incorporates a recession (negative EPS growth and multiple compression).
… And from Global Wall Street inbox TO the WWW,
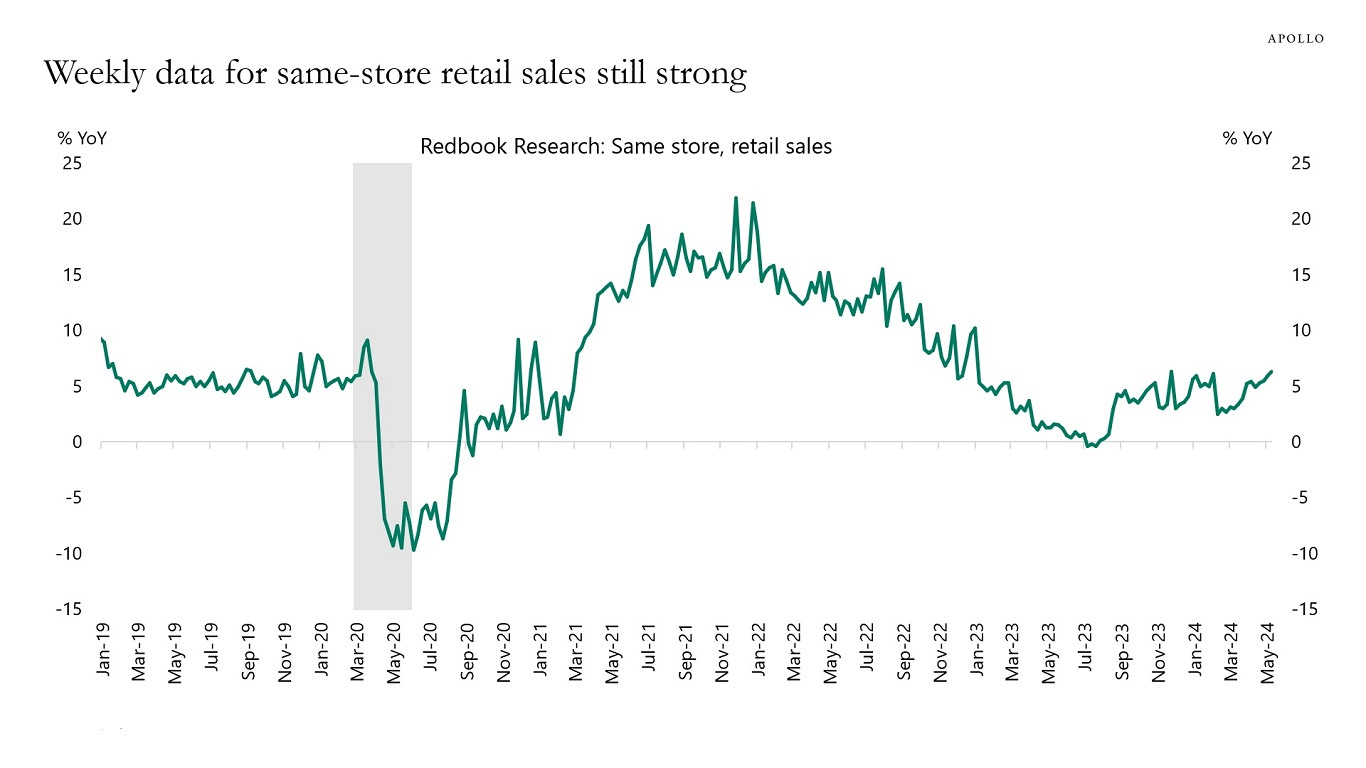
Apollo: Same-Store Retail Sales Still Strong
Weekly data for consumer spending continues to show no signs of a slowdown in private consumption, see chart below.
Bloomberg: Big Funds Bet the ‘Anything But Bonds’ Trade Is Poised to End
Largest 20 fund managers increased duration in past two months
Risk-on returns as markets price in two rate cuts this year
… “History shows pretty consistently that yields rally hard starting three to four months before the Fed actually starts cutting,” said Gershon Distenfeld at AllianceBernstein Holding LP, who recently extended duration in the $23 billion American Income Portfolio he manages. That could happen “a month or two from now, six months from now, or not until 2025,” he said.
The “anything but bonds trade” may now have run its course and long-duration debt is set for a comeback in the second half, strategists at Bank of America Corp. wrote in a note published Friday….
Bloomberg: Slowing Inflation Primes G-7 Central Banks for June (HOPE — not a strategy — springs eternally)
UK, Canada and Japan publish price data; ECB wage gauge due
Fed releases minutes; rates on hold from New Zealand to Turkey
… The Fed will publish an account of policymakers’ April 30-May 1 gathering. In the press conference that followed that meeting, Chair Jerome Powell indicated rates will probably remain higher for longer because of lingering price pressures.
Several Fed officials have since echoed that sentiment, noting the need for more evidence that inflation is sustainably headed toward the Fed’s 2% goal.
Read more: Fed Officials Suggest Interest Rates Should Stay High for Longer
Vice Chair Philip Jefferson is among the central bankers due to speak or deliver remarks in the coming week. Fed Governor Christopher Waller is scheduled to speak on Tuesday on the economic outlook and policy.
The US economic data calendar is relatively light, with reports on April sales of previously owned homes on Wednesday and new houses the following day. Purchases of existing homes are seen little changed from the prior month, while contract signings on new houses are projected to have eased with mortgage rates back above 7%.
On Friday, data on April durable goods orders and shipments will include insight into companies’ appetite for capital investments. The University of Michigan will also issue its final May reading on consumer sentiment…
Bloomberg: Banks Warn of Growing Energy-Related Risks in Mortgage Portfolios
Lenders across Europe focus on buildings’ energy consumption
Capital relief for green loans offers securitization option
Bloomberg: The Good Times Are Back for Stocks, But They Might Not Roll On (Authers’ OpED)
Don’t ignore the markets’ bullishness even if things are not so straightforward. And a look at copper and credit spreads.
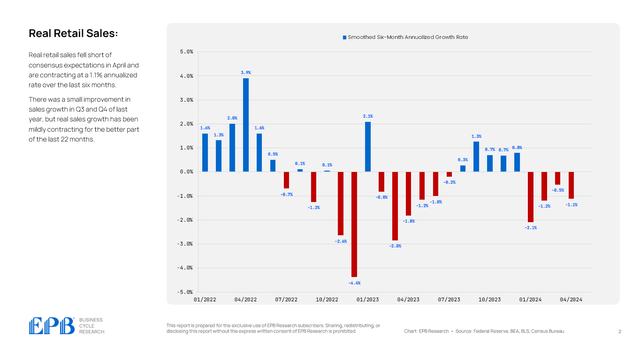
EPB Macro Research: Chart Of The Week: A String Of Weak Growth Data
Real retail sales fell short of consensus expectations in April and are contracting at a 1.1% annualized rate over the last six months.
There was a small improvement in sales growth in Q3 and Q4 of last year, but real sales growth has been mildly contracting for the better part of the last 22 months.
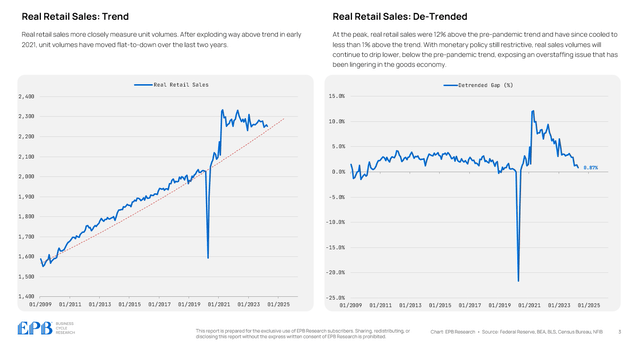
Real retail sales more closely measure unit volumes. After exploding way above trend in early 2021, unit volumes have moved flat-to-down over the last two years.
At the peak, real retail sales were 12% above the pre-pandemic trend and have since cooled to less than 1% above the trend.
With monetary policy still restrictive, real sales volumes will continue to drip lower, below the pre-pandemic trend, exposing an overstaffing issue that has been lingering in the goods economy.
Hedgopia CoT: Peek Into Future Through Futures, How Hedge Funds Are Positioned
Sam Ro from TKer: The free finance newsletters I read all the time (sharing as I can relate to ‘the process’)
…I spend a lot of time monitoring news, unpacking economic data, thumbing through Wall Street research, dabbling in social media, and chatting with smart (as well as not-so-smart) people.
It’s all part of a process that ends with me curating insights and synthesizing them into stories that hopefully help TKer’s audience better understand what’s going on in the markets and the economy.
Reading a select handful of newsletters helps me keep up with everything going on.
A bunch of readers have asked me what I read regularly. So here you go …
ZH (Peter Tchir / Academy): Too Narrowly Focused?
The Citi Economic Surprise Index continues to deteriorate (worst levels in a year).
Bond yields have declined (the 10-year Treasury got to 4.31% on Thursday, basically the bottom of our 4.3% to 4.5% range, and crept higher the rest of the week). Bonds in part moved on economic data (weak), inflation (high, but “explainable”), and Powell (who couldn’t resist being dovish) effectively dismissing the higher than anticipated PPI (explainable as it was). I’d argue that bond yields went lower partly due to economic data and partly due to Powell…
… I’m not here to argue about where inflation has been, I’m here to point out that I think the market has been too narrowly fixated on past inflation, and what the Fed might do about that, while not thinking enough about some bigger picture issues.
My simple case for inflation is this:
If inflation continues to come down, it is likely to be tied to a weakening economy, which should be good for bonds, but not so good for stocks (assuming that tenuous link between lower bond yields and higher stocks can be broken again).
My worst-case view would be seeing a decline in inflation due to more and more selling of Chinese brands, which will put margin pressure on companies domiciled outside of China as they need to compete. The benefit of lower inflation will accrue to bondholders, but stocks won’t like declining sales, increased competition (largely on price), and the associated margin pressures.
If inflation goes higher, it could be due to:
Robust domestic job growth. A resurgence in the global economy, which would not be good for bonds, but stocks should do quite well even with rising bond yields.
Increased cooperation between China and Russia. Accidental or willful acts to increase commodity prices. Demand from India as their economy surges and the wealth effect takes hold. While this might not accompany “stagflation,” it could set us up for inflation on a global basis without commensurate growth in the domestic economy.
I do believe that with PPI and CPI behind us, markets will start delving deeper into the overall slew of economic data and are unlikely to like what they see…
… THAT is all for now. Off to the day job…



personally, i think you deserve a BBG terminal for free. im sure Ira Jersey - the US Rates guy at BBG - would pay you consulting fee for your daily briefs.
How much and how many did Mike Bloomberg BRIBE to get monopoly rights to all of that important economic trading info I wonder. Some Animals are Freer than others in Animal Farm I suppose