while WE slept: USTs a touch higher / flatter on avg volumes; "Treasuries torpedoed"; what 'they' said in 1995 CUTTING cycle; "Complacency is dangerous"
Good morning … things getting somewhat back to normal here, for me, after a day outta pocket … As for the markets, well, not so sure and to start, a ZH link on PPI, feeds in to PCE, which is the Fed’s favoured ‘flation gauge …
ZH: Producer Prices Surged Again In February As Energy Costs Re-Accelerated
… This is not good news for the disinflationistas. And it will stop President Biden's narrative that 'prices are coming down' or refocus his blame-game that 'Big Corporate' greed is driving 'shrinkflation'...?
… BAD NEWS was bad then and as this clearly fed through to MARKETS, the longer-end of the curve reflexing a bit more (hey, at least Global Wall getting some steepening relief even IF not how they envisioned…) with 10yy kissing the (red)TLINE noted yesterday (to my surprise, or not …).
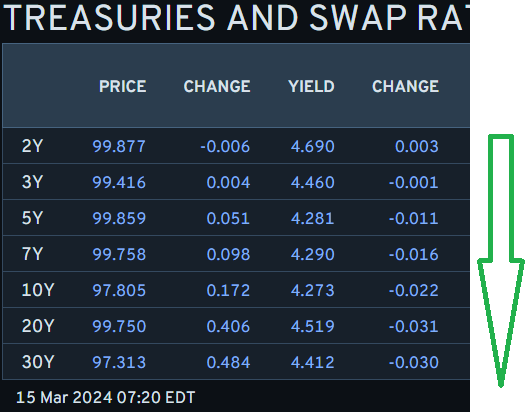
Looking further OUT the curve, the long bond pulled up towards and gravitating around 4.42 …
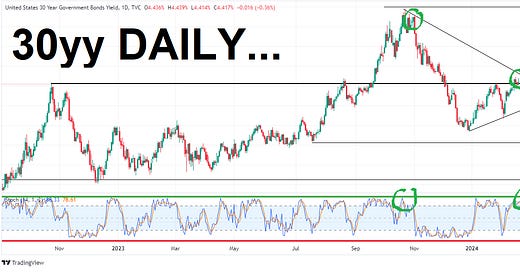
30yy DAILY: TLINE and momentum appear supportive …
… we’ll see IF 3s a charm and hope to fire up a WEEKLY chart over the weekend to see if it’s corroborating our currently (DAILY)triangulation.
… But all was NOT bad news being BAD yesterday there was some … good bad news (?) in the form of ReSale TALES …
ZH: 'Real' Retail Sales Tumbled For Second Straight Month In February
… AND yes I realize how ridiculous all this bad news as good, good news as bad etc really is.
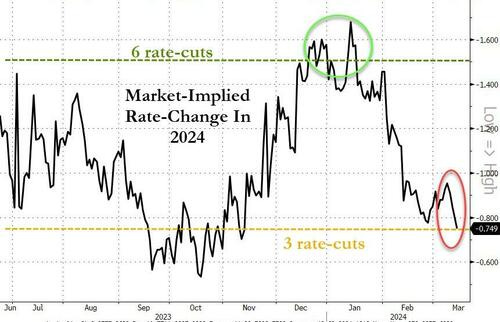
While there will be somewhat more below from Global Wall Street taking all this PPI and ReSale Tales into account as they are still finalizing PCE dart-throwing exercise, I present this next one mostly for the updated look at what happend TO rate cuts …
ZH: 'Bad News' Is Bad News For Stocks, Bonds, Crypto, & Gold
A lof of macro bad news... Softer-than-expected Retail Sales, hotter-than-expected Producer Prices, Jobless Claims up (from dramatically revised-down levels)... sending rate-cut expectations lower...
And so, bad news was bad won the day and … here is a snapshot OF USTs as of 705a:
… HERE is what this shop says be behind the price action overnight…
… WHILE YOU SLEPT
Treasuries are modestly higher with curves slightly flatter this morning with Japan's wage numbers (link above) having little impact on Treasuries. DXY is UNCHD while front WTI futures are lower (-0.5%). Asian stocks were mixed/lower, EU and UK share markets are higher (SX5E +0.4%) while ES futures are showing +0.2% here at 7am. Our overnight US rates flows saw a strong bid for the long-end during Asian hours with good volumes seen in 30yrs and WN futures. We also saw better real$ buying in the front-end in that time zone. London's AM hours were much more subdued with better buying reported but with no apparent theme backing the flow. Overnight Treasury volume was about average with 10yrs (114%) seeing the highest relative average turnover this morning…… Our next attachment shows how Treasury 5's have dipped back to their range support zone in the 4.30% to 4.34% area. You can see how daily momentum (lower panel) still guides bearishly even as 5's approach support. Nothing hints of an imminent rebound off suppports...
… and for some MORE of the news you might be able to use…
IGMs Press Picks: March 15 2024
NEWSQUAWK: US Market Open: Equities are firmer, JPY unreactive to RENGO and crude off best levels; UoM due … Bonds are contained at post-PPI lows and Gilts continue to underperform
Reuters Morning Bid: Treasuries torpedoed, Tesla tanked
Finviz (for everything else I might have overlooked …)
Moving from some of the news to some of THE VIEWS you might be able to use… here’s SOME of what Global Wall St is sayin’ …
BARCAP: February PCE inflation preview: Another strong month for core PCE inflation
We estimate that core PCE accelerated 0.32% m/m (2.8% y/y) in February, led by strength in core goods prices, even as services inflation moderated, consistent with the CPI and PPI data for the month. Our Q4/Q4 core PCE estimate has now increased to 2.6% for 2024 (+0.1pp) and is unchanged at 2.3% for 2025.
… We maintain our call for the FOMC to initiate the first 25bp rate cut in June of this year. The recent firming in both CPI and PCE inflation, following a run of soft prints at the end of last year, will likely undermine the FOMC's confidence that a sustained return to 2% inflation is on course. This supports our call that the Fed will not initiate rate cuts until June and that subsequent cuts will likely be gradual and data dependent, given the resilient macroeconomic backdrop envisioned in our baseline. Risks are skewing toward outcomes in which the FOMC delivers fewer than three cuts this year.
BARCAP: February Retail Sales: Soft patch
Retail sales rebounded in February following the prior month's weakness, but the magnitude of the swing was disappointing. Most of the surprise was in the control group, which came in flat following January's decline. Although today's estimates will weigh on PCE in Q1, fundamentals support a resumption of growth.
BARCAP U.S. Equity Strategy: Food for Thought: Big Tech Correlation Risk
Big Tech's stunning rally has been justified by high-quality earnings growth and the scarcity of that growth elsewhere in US equities. We see more room to run fundamentally, but caution that Big Tech is not a safe haven from macro de-risking. Major jumps in Big Tech-SPX correlation occur around market selloffs.
BloombergBNP US March FOMC preview: Powell may take page from 1990s playbookKEY MESSAGES
We expect the FOMC to keep rates unchanged at the March policy meeting and signal no rush to engage in a first cut.
Upgrades to GDP and inflation forecasts for 2024 are likely, and we see risks tilted in the direction of fewer cuts in the dot plot.
We now see 75bp of rate cuts this year (previously 100bp), starting in June, as outlined in our latest Global Outlook. An every-other-meeting cadence continues into 2025 until reaching 4%, in our view.
Discussions about QT tapering will probably begin in earnest. The press conference could elicit clues from Fed Chair Powell about whether a May announcement and June implementation (our base case) is still on track.
… What were policymakers saying in real time? The central bank only began formally announcing meeting outcomes in 1994. Statements were short and minutes were released with a longer lag. Even so, selections from communications and testimony in the annotated chart below show some parallels to the current environment. Specifically, they show the Fed was willing to calibrate policy rates lower even amid potentially adverse price data (see Greenspan’s Senate testimony from February 1995) or in response to incremental improvements in inflation developments and risks to the outlook.
CitiFX Techs: US Rates and the dollar (I came for the visuals — theirs far better than mine — on 2s and 10s…no offense to my FX friends)
Even with an upside surprise in PPI on Thursday, the narrative in the US remains intact: labour markets are loosening, and with details of PPI likely to imply softer core PCE inflation, chances for the “goldilocks” scenario still remain firm …
US 10y yields
In techs, 10y yields have bounced higher from the pivotal 55w MA support that we had highlighted. At the same time yields have broken above the 4.18%-4.20% resistance (Jan 19 high, Feb 15 low, 200d MA). Yields now look likely to test the strong resistance at 4.34% (YTD highs).With both support and resistance strong, we think 10y yields will stick to the 4.03% (55w MA) - 4.34% (YTD highs) range in the near term.
US 2y yields
Yields have firmly bounced off support at 4.42%-4.46% (55d MA, Jan 19 high). However, we are now coming close to very strong resistance at 4.74%-4.77% (200d MA, Feb high, Dec high). As a result, we think we are likely to hold this 4.42%-4.77% range in 2y yields.Goldilocks: Retail Sales Below Expectations; Core Producer Prices Stronger Than Expected; Boosting Core PCE Estimate to 29bp; Lowering GDP Tracking to +1.7% (would seem to me to NOT be one for Team Rate CUTS…but I’m so far removed these days)
BOTTOM LINE: Core retail sales were unchanged in February, 0.4pp below consensus expectations, and headline spending increased less than expected. Core producer prices rose by more than expected in February, as the PPI excluding food and energy rose 0.3% and the PPI excluding food, energy, and trade services increased 0.4%. Based on details in the PPI and CPI reports, we estimate that the core PCE price index rose 0.29% in February (vs. our previous estimate of 0.27%), corresponding to a year-over-year rate of +2.81%. Additionally, we expect that the headline PCE price index increased 0.36% in February, or increased 2.47% from a year earlier. Today’s jobless claims report included an annual update of the seasonal factors, which resulted in modest revisions to initial claims but caused the recent trend for continuing jobless claims to be revised sharply lower. Initial jobless claims edged lower week-over-week (-1k to 209k) from the prior week’s downward revised level (-7k to 210k) and continuing claims increased (+17k to 1,811k) from the prior week’s sharply downward revised level (-112k to 1,794k). We lowered our Q1 GDP tracking estimate by 0.4pp to +1.7% (qoq ar) and our Q1 domestic final sales forecast by 0.3pp to +2.2% (qoq ar).
MS Global Macro Commentary (bear STEEPENING … Global Wall gettin half right?)
BoJ-related media report bear-steepens UST curve; JPY is resilient through broad USD strength before Rengo wage negotiations; European curves bear-steepen; ECB's Lane focuses on 2Q; Brent, WTI crude oil hit YTD highs; Initial TWD gains fade; DXY at 103.36 (+0.6%); US 10y at 4.290% (+10.0bp).
SocGEN Global Strategy Weekly: Almost everyone (and their dog) has given up on a US recession
Complacency is dangerous. One only has to think of the fate of Julius Caesar on the Ides of March – which somewhat worryingly is this Friday. Hence now that almost every market guru has walked back their recession call, wouldn’t it be just typical if the US economy now slides into recession?
UBS: PPI suggests core PCE inflation holding at 2.8%
PPI data suggests a 27bp increase in core PCE prices in February, and 12-month core inflation remaining at 2.8%
Core PCE prices are projected to have increased 27bp in February with 12-month inflation at 2.8% and the 6-month pace rising to 2.9%
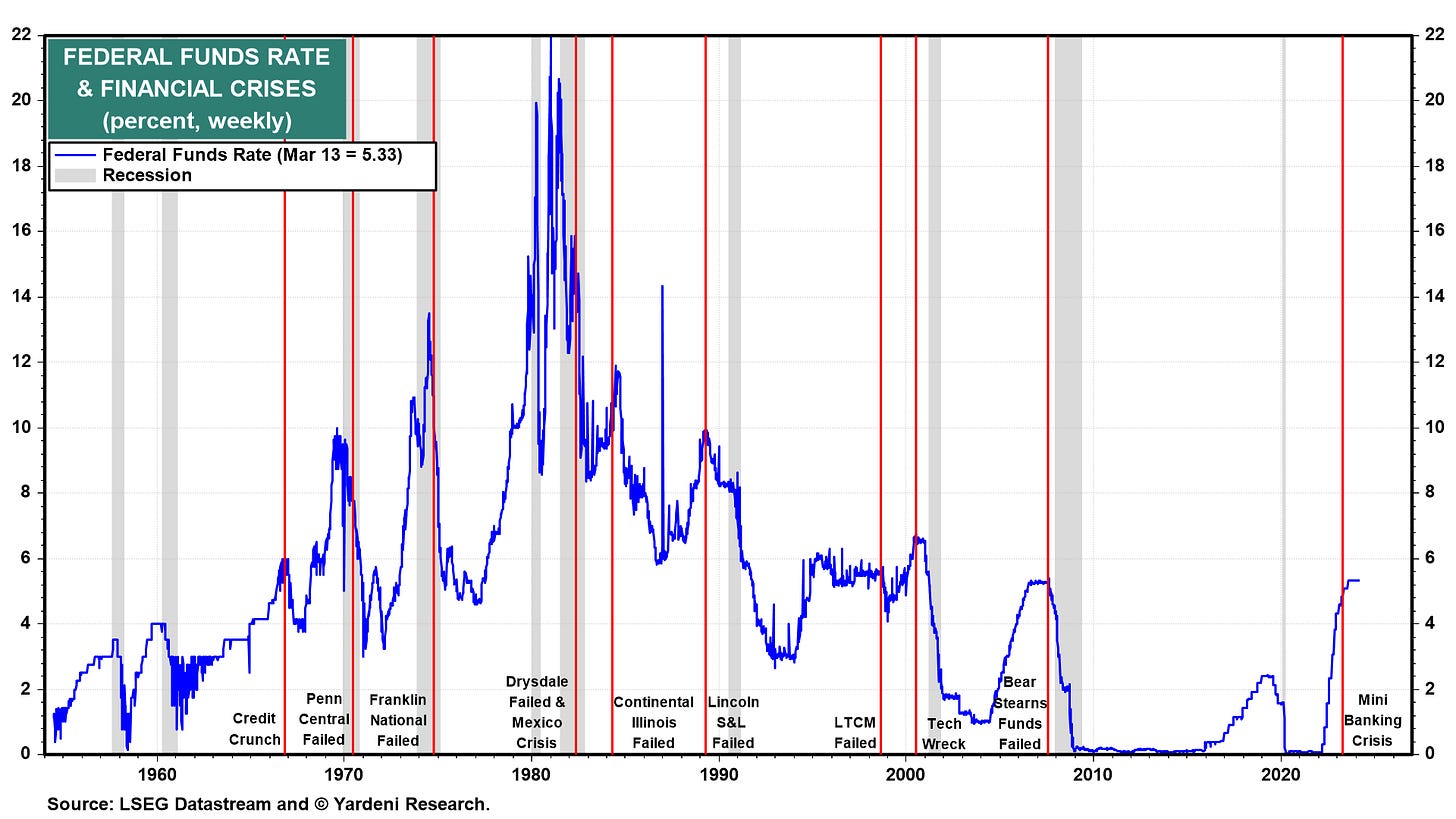
Yardeni: The Pause That Refreshes Spooks Investors (chart showing cuts driven by crisis which, THANKFULLY, isn’t on Dr Ed’s radar screen … )
… Slowing the pace of the advance this week have been hotter than expected CPI and PPI reports for February. That increases the likelihood that Fed rate cuts will be fewer and later than most investors expected at the start of the year. We've been in the no-rush-to-ease camp. We are still there and won't be surprised if the Fed doesn't cut this year at all. Previous rate cutting periods were triggered by financial crises and recessions (chart). Such a bad outcome isn't on our radar screen for this year.
There's no sign of trouble in today's initial unemployment claims report. In the week ending March 9, jobless claims totaled 209,000, a decrease of 1,000 from the previous week's revised level. The previous week's level was revised down by 7,000 from 217,000 to 210,000. Continuing claims for the March 2 week, were up by 17,000 to 1.811 million. Notably, the estimate of continuing claims for the February 24 week was revised down by a large 112,000…
… And from Global Wall Street inbox TO the WWW,
AllStarCharts: The New 60/40 Portfolio
I'm old school. The way I learned it was that there are 3 asset classes: Stocks, Bonds AND Commodities.
But a funny thing happened over the past decade or so. Humans forgot about that 3rd one.
You see, recency bias is a tough one for humans to overcome. Commodities did so poorly for so long, that humans decided to forget about them altogether.
The asset classes somehow became just stocks and bonds.
Look how that's worked out recently, with stocks and commodities doubling over the past few years, as you can see here using these simple ETFs.
Notice how bonds have been crushed.
In this current market regime, stocks and bonds have not had that negative correlation that so many of us have grown used to over our careers.
So the way I see it, if you have a 60/40 portfolio of stocks and bonds, and stocks and bonds are positively correlated, then you don't have a 60/40 portfolio, you just have a 100 portfolio (60+40).
Stocks/Commodities are the new 60/40 portfolio…
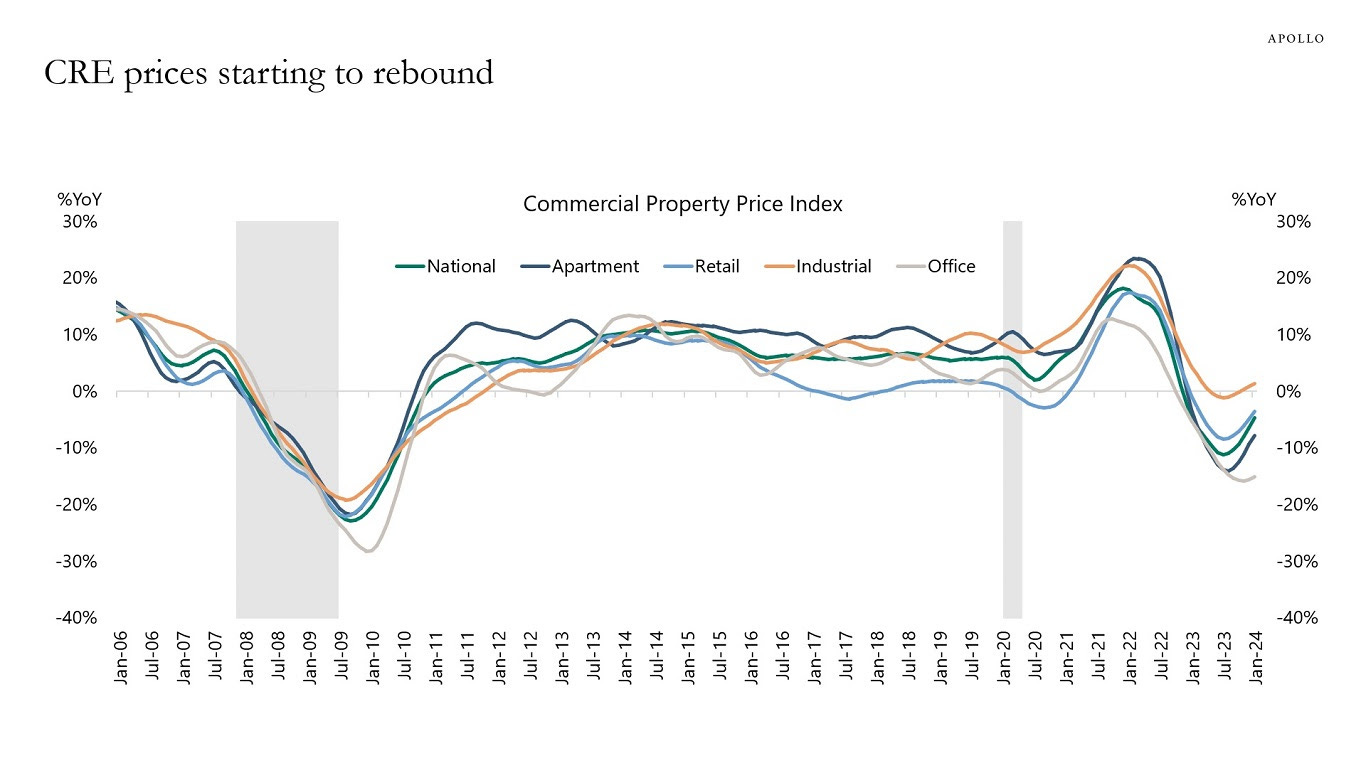
Apollo: CRE Prices Rebounding (NOT good for rate cut folks…)
With no signs of a recession, commercial real estate prices are starting to recover, see chart below. This is helpful for the regional banks and for the broader economic recovery.
Atlanta FED GDPNow: First-Quarter GDP Growth Estimate Decreased (Team Rate CUT?)
… The GDPNow model estimate for real GDP growth (seasonally adjusted annual rate) in the first quarter of 2024 is 2.3 percent on March 14, down from 2.5 percent from March 7. After recent releases from the US Department of the Treasury's Bureau of the Fiscal Service, the US Bureau of Labor Statistics, and the US Census Bureau, a decrease in the nowcast of first-quarter real personal consumption expenditures growth from 2.9 percent to 2.2 percent was slightly offset by increases in the nowcasts of first-quarter real gross private domestic investment growth and first-quarter real government spending growth from 1.7 and 2.4 percent, respectively, to 3.0 and 2.7 percent.
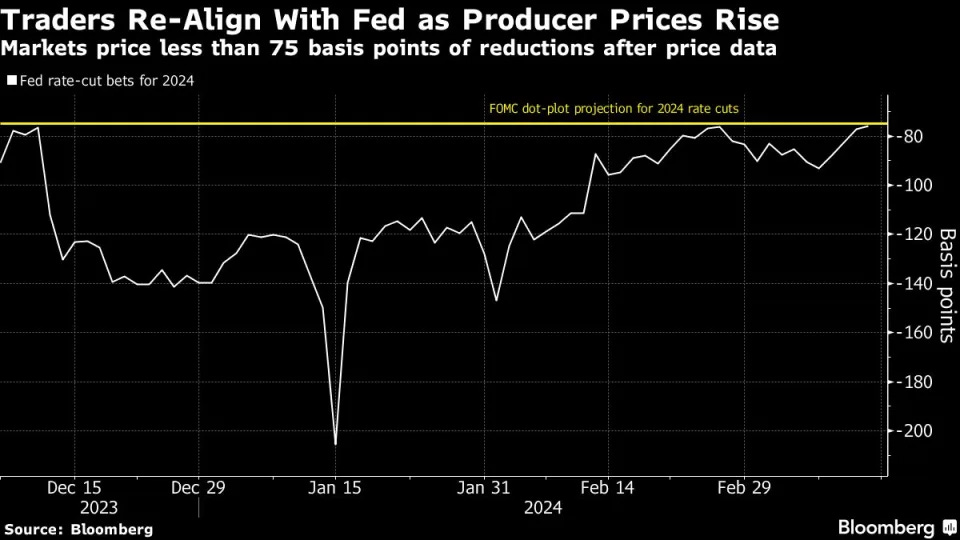
Bloomberg: Treasury Yields Surge as Inflation Sows Doubt on Rate Cuts (I came for another look at rate CUTS PRICING evaporating post PPI …)
Soft retail sales readings temporarily supported bond prices
Traders worried that Fed’s next forecasts will be less dovish
… Market-implied expectations for Fed policy faded, with swap contracts that predict interest-rate changes eventually pricing in slightly less than three quarter-point interest rate cuts by year-end. That was the median forecast of Fed policy makers from December, but those projections will be updated next week, and bond investors have grown concerned that sticky inflation readings will result in a less-dovish outlook. The contracts continue to fully price in an initial quarter-point cut in July…
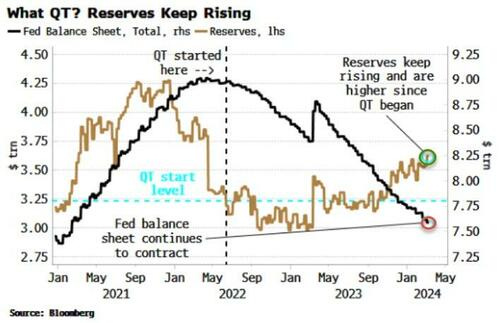
Bloomberg (via ZH): Fed Liquidity Is Facilitating Market's Inflation Fantasy
… Still, the market can avoid these dawning inflation risks as liquidity conditions continue to be asset friendly. Despite ongoing QT and Fed balance-sheet contraction, reserves in the system keep rising.
That’s been a great support for risk assets. But it’s likely to hit some turbulence in the coming months. The reverse repo facility (RRP) continues to fall. Moreover, tax receipts will soon pick up, boosting the Treasury’s account at the Fed (the TGA) and depleting reserves, while the Treasury could soon start slowing the pace of T-bill issuance.
All told, it may soon be much harder for the market to pretend inflation is about to call a taxi and leave everyone in peace.
Investing.com Chart Advisor: Classifying Bonds
1/Looking at Bonds
I hesitated to write up a whole edition on bonds because not a whole lot has changed in the last few years, but for those who aren’t “in-the-know,” let’s start by getting up to speed.
If any of us received any financial education whatsoever, we were taught that stocks are risky, smaller stocks are even riskier, you’ve gotta’ be crazy to invest in commodities, and bonds… well, bonds are safe!
Perhaps this was true as interest rates fell from their highs in the 1980’s until the COVID pandemic began, but it’s definitely not the case today.
You see, bonds and interest rates have an inverse relationship. In other words, it’s not a matter of speculation or analysis… when rates go up, bonds go down – and when rates go down, bonds go up. That’s it. Pretty simple right?
Well, it makes you wonder then… why is it that so many investors owned bonds this past few years as interest rates were almost sure to rise (and man… did they rise!), and as a result they stood by and watched the “safe” portion of their portfolio get vaporized in less than three years?
Let’s take a glimpse at reality…
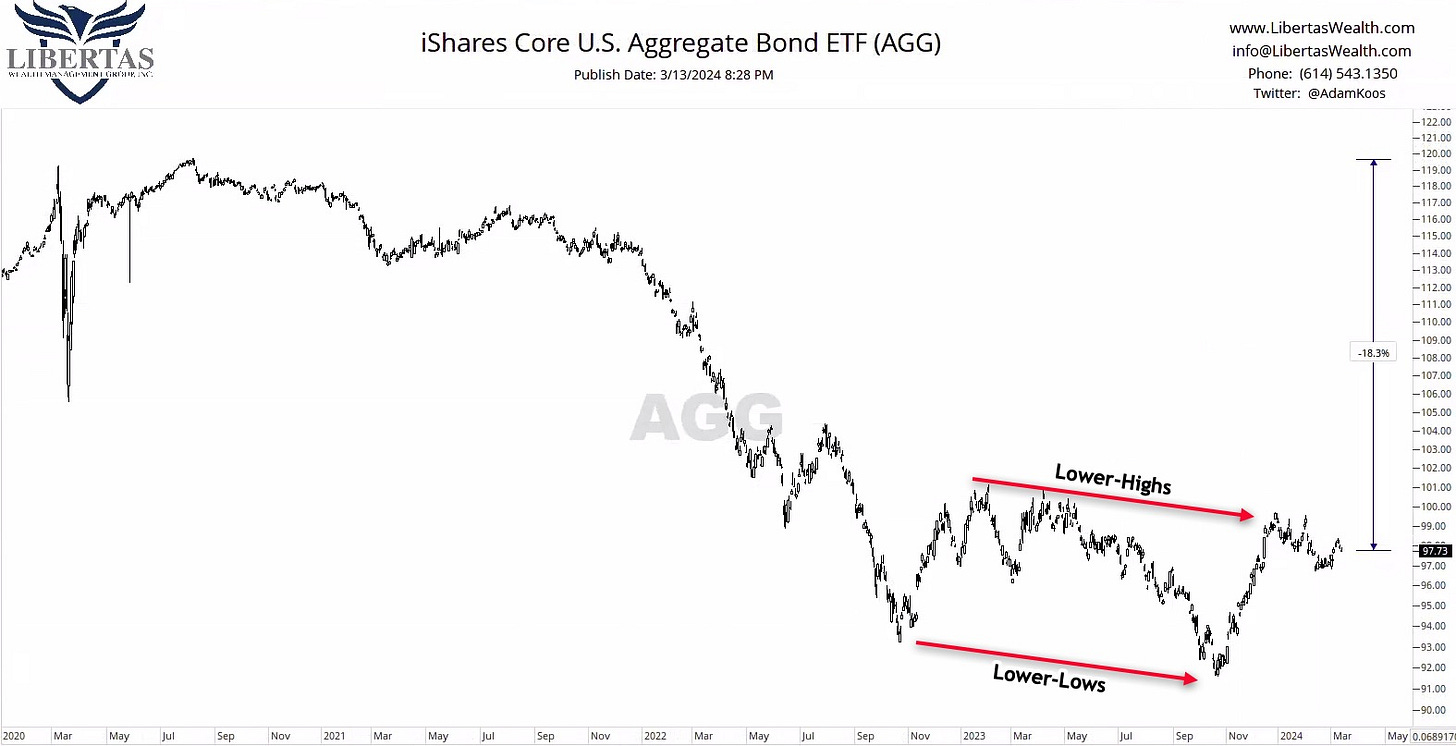
The above chart is a snapshot of the iShares U.S. Aggregate Bond ETF (AGG), which is a good representation of the overall bond market here in the U.S.
I start with this chart because it’s taken a milder beating than most bond investments out there, but being down -18% or more in what we’ve been taught is a “safe” investment over a three year period? No bueno.
As you can see today, a quick glimpse at this chart tells us that the bond market overall is printing lower-highs and lower-lows… the epitome of a downtrend…
… 3/ Treasury Bonds
Alright, alright… maybe I’m not being fair. Surely United States Treasury Bonds are safe, aren’t they? I mean, they’re backed by the full faith of the U.S. government, so how bad could they really be?
Short answer: Bad.
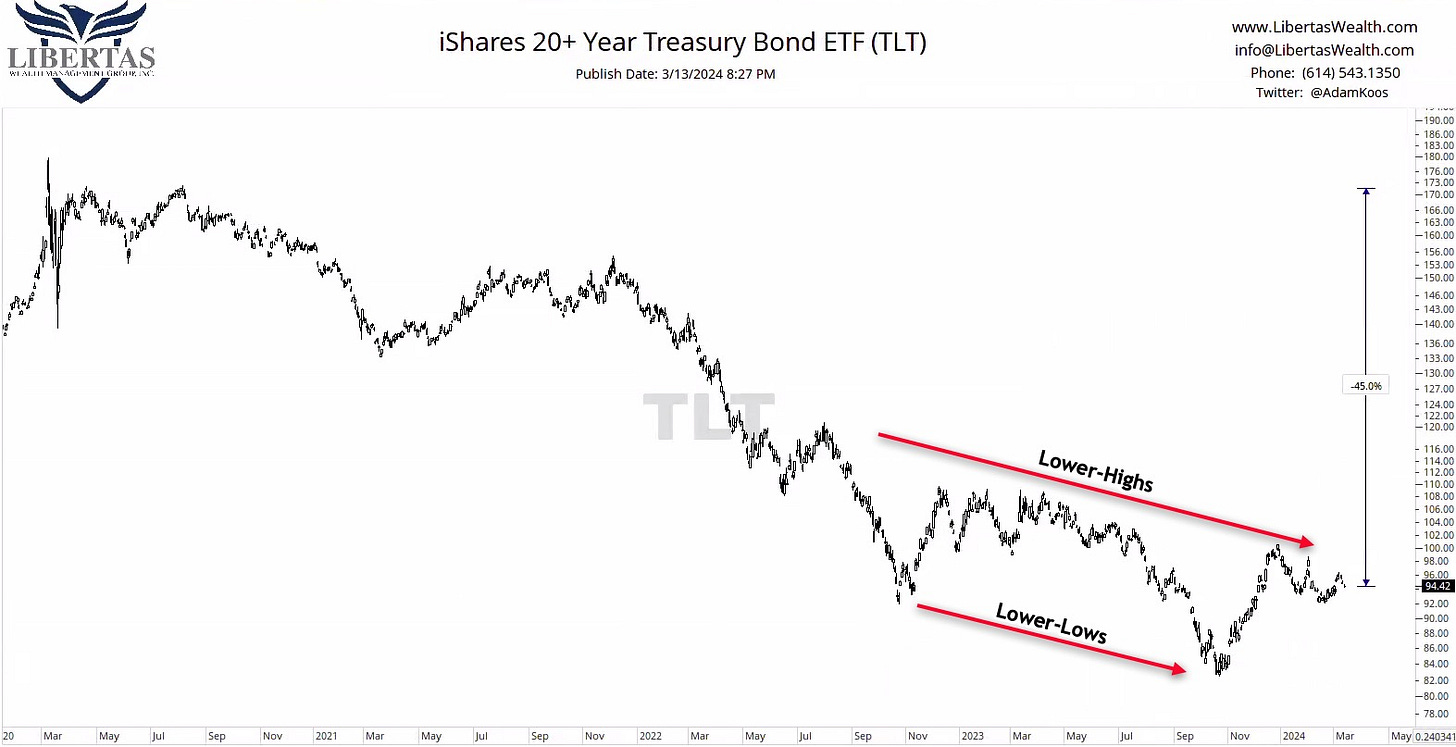
Long(er) answer: All I see here are lower-highs and lower-lows (again), but worse yet, if you’ve held onto bonds since the post-COVID peak, this portion of your portfolio is down approximately -45% (FORTY-FIVE PERCENT!!!). <sigh>.
McClellan Financial Chart In Focus: Election Years Are Different
March 14, 2023
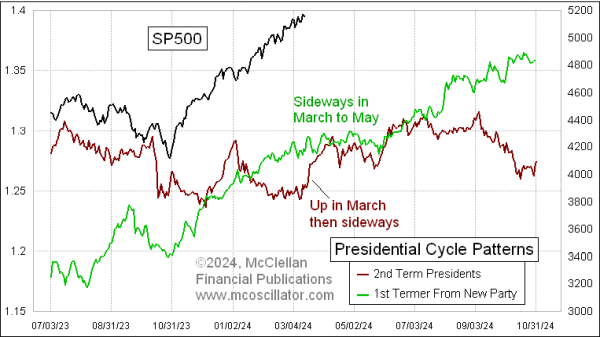
… This year, we cannot necessarily set aside the message of that red line. President Biden's health issues and low approval ratings make it much more likely than normal that someone else will be named as nominee at the Aug. 19-22, 2024 convention. That throws off the normal presumption about how the incumbent 1st term president usually wins reelection.
And this year we have a challenger who is not an unknown quantity (to Wall Street), who at the moment has a slight lead in the polls. This type of condition is totally backwards from how election years usually go. Add to that the additional unknowns about how President Trump is facing multiple trials for alleged crimes, and we have an election year completely unlike any previous one. So trying to run a forecast model based on how things have gone in prior election years may just not work this year.
WolfST: What the PPI is Telling us: Disinflation in “Core Goods,” a Hefty Counterweight to Hot Services Inflation, May be Over
… What the PPI is telling us. The measure that tracks consumer-facing inflation, the Consumer Price Index, has for months seen hot and rising services inflation, but durable-goods inflation has been negative (deflation) since the peak of the spike in 2022, and these negative readings in durable goods, plus the plunging energy prices of yore provided a big counterweight to services inflation and a downward push for the overall CPI readings in 2023. But this counterweight and downward push is now in the early stages of fizzling – that’s what the PPI is telling us.
… THAT is all for now. HOPE to have something over weekend but off to the day job…
