while WE slept: UST belly bid, outperf Bunds, Gilts on LIGHT volumes; bad = good; 10s vs 4.25; Don Regan; bond traders capitulate ...
Good morning … if BAD is good than aDURABLE Goods was GREAT …
ZH: US Durable Goods Orders Collapsed In January - Biggest Drop Since COVID Lockdowns
ZH: WTF Is Going On With The Conference Board's Consumer Confidence Data?After rebounding strongly from November to January, US Consumer Confidence tumbled in February, according to the latest survey from The Conference Board, beating expectations across the board.
… But, for the fourth straight month, The Conference Board revised its consumer confidence data significantly lower. In fact January's was the biggest downward revision since Feb 2022...
… oddly enough USTs didn’t get the memo and remained WITH concession ahead of the 7yr auction …
ZH: Yields Slide After Solid 7Y Auction, First Stop Through Since October
… so, yields slide and USTs bear steepened as the day came to an end. And with that — BEARISH — idea in mind, a look at 10yy …
… I spy with my little eye a couple things … first, an UPTREND (red line) and within that uptrend, a bullish momentum indicator (trend your friend until it bends…?) and with that bending in mind, IF / when we were to take out 4.25% (resistance), I’d be willing to bet those who were adamant about waiting for cheaper levels to add duration, will turn (FOMO) and suggest that if you can’t have the yield level you’d love, love the one yer with …
Moving along, here is a snapshot OF USTs as of 705a:
… HERE is what this shop says be behind the price action overnight…
… WHILE YOU SLEPT
Treasuries are modestly higher with the belly of the curve modestly outperforming as Bunds, Treasuries and Gilts have linked arms overnight. DXY is higher (+0.25%) while front WTI futures are lower (-1%). Asian stocks were generally led lower by Chinese exchanges, EU and UK share markets are little changed while ES futures are showing -0.3% here at 6:45am. Our overnight US rates flows saw muted flows with systematic sellers seen in the belly during London hours; selling that had little impact on the outperforming belly this morning. Our London desk observed that curve positioning finally felt cleaner this morning, and we show technical reasons (the recent flattening move looking overdone) for that in our attachments today. Overnight Treasury volume was ~70% of average.… Had a private chuckle after logging in and noticing that 5-year Treasury yields were sitting at 4.30% during London's hours. As our first attachment shows, the bear trend in place since the start of this month appears intact but the deeply 'oversold' daily momentum reading (circled, lower panel) hints that higher rates are sneaking up on increasingly fewer investors. Moreover, a glance at the candles/price action of the past two weeks reveals that the amplitude of daily price swings [observed vol] has steadily diminished over the past few weeks. This would suggest that prices may be quite 'coiled' or trend-ready heading into tomorrow's PCE print-- or whatever follows that? Anyway, we thought it worthwhile to expand the scope of this morning's 5-year Treasury study to show why markets may be so flummoxed/complacent/disengaged/rangebound at the moment.
If we zoom out a bit, the weekly chart of Treasury 5yrs shows weekly momentum (lower panel) still looking locked in a ~multi-month (?) bear phase. Taken literally, this particular picture hints that the 2024 sell-off in bonds probably has legs still despite local supports (like 4.735% in 2yrs too) holding up recently.
Zooming out even further, the monthly chart of 5's (the 'prevailing winds,' if you will) still hints that the macro bull phase that emerged last fall (confirmed at November's closes)... remains in place since the oscillator lines in the lower panel haven't crossed back over and flipped up again. The point is that set-ups like these just described give this observer a pounding headache because there's more noise than signal. So more rangebound price action up ahead still? Confidence about the next +/- 20bp in 5yr yields remains at a low ebb here and hopefully you can see why this morning.
… NOT ALONE in noting difference in timeframe and what is important to any given author or paid / professional observer may NOT be relevant to YOU … and for some MORE of the news you can use » The Morning Hark - 24 Jan 2024 and IGMs Press Picks (who CONTINUES to be sportin’ that new, fresh look) in effort to to help weed thru the noise (some of which can be found over here at Finviz).
… and for some MORE of the news you might be able to use…
IGMs Press Picks - February 28 2024
NEWSQUAWK: US Market Open: US equities lower, Dollar bid and Kiwi slumped post-RBNZ as attention turns to US GDP and Fed speak … Bonds are incrementally firmer with specifics light and supply heavy, awaiting US GDP 2nd estimate …
Reuters Morning Bid: US tracking 3%+ growth; Apple downshifts, Kiwi surprise
Finviz (for everything else I might have overlooked …)
Moving from some of the news to some of THE VIEWS you might be able to use… here’s SOME of what Global Wall St is sayin’ …
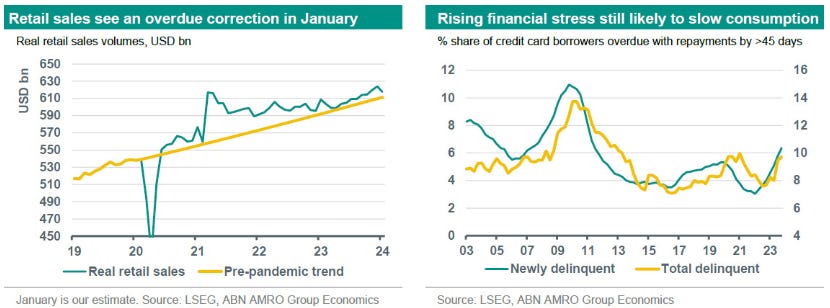
ABNAmro: US - Stronger growth unlikely to derail Fed rate cuts (in other words, damned the torpedoes, full steam ahead…)
We have raised our 2024 growth forecast on the back of the more resilient labour market. Still, we expect some slowdown in growth, given evidence of rising financial stress from high rates. Despite stronger growth, we still expect inflation to fall sustainably back to 2% by mid-2024, keeping the Fed on course to begin lowering rates at the June FOMC meeting.
BARCAP US Economics Research: February consumer confidence shows signs of pessimism creeping in
The Conference Board's index of consumer confidence fell to 106.7 in February, due to decreased optimism about both expectations and the current situation. The decline in February breaks a three-month string of increases in the index.
BNP Global macro: Get real
A regime shift in which real rates start to rise more significantly would be a game-changer for the market.
The recent sell-off in nominal rates has been predominantly driven by front-end breakevens; contrasting with the August to November 2023 sell-off, which was led by the back end and real rates.
The re-pricing so far reflects more of a recalibration of timing and size of central bank rate cuts, rather than a regime shift (with, at the extreme, a chance of hikes priced in).
We analyse market performance using our BERT framework, in which we define market regimes by US real rates and breakevens.
DB: US FX politics in Treasury “quotes” (Ruskin note and I’ve highlighted Don Regan comments only cuz … well, it’s personal — SEE HERE)
The market has become acclimatized to a relatively silent Administration when it comes to talking about the state of the USD, but this is highly unusual. Janet Yellen has said that the US believes in market determined exchange rates and this applies to both the USD and her trading partner currencies. Since these early Biden Administration comments, the Treasury Secretary has rarely been asked about the exchange rate. The US exchange rate policy is simple enough, and, at least in the hands of the present Treasury Secretary, it is deemed credible.
MS Global Macro Commentary: February 27
Upside Japan core CPI surprise sends 2y JGB yields to high since 2011; USTs twist-steepen; Fed's Bowman reiterates her baseline outlook; BRL outpaces LatAm peer gains; THB strengthens on tourism surge; AUD/NZD steady before RBNZ meeting; DXY at 103.81 (-0.0%); US 10y at 4.303% (+2.4bp).
2y JGB yields reach the highest level since 2011 (0.16%) after Japan core CPI (ex-fresh food) comes in at 2.0% y/y in January (C: 1.9%), but is impacted by a calculation methodology change.
US Treasuries twist-steepen in a quiet session, the $42bn 7y auction comes 0.2bp through and ends February coupon supply on an upbeat note.
Fed Governor Bowman reiterates it will “eventually” be appropriate to “gradually” lower rates, should inflation move sustainably toward target. But, she remains “willing to raise the federal funds rate at a future meeting should the incoming data indicate that progress on inflation has stalled or reversed.” …
UBS: Core capital goods orders now below shipments
… Core shipments increased 0.8% on the month, stronger than the 0.1% expected, and an acceleration from the upwardly revised December rate of 0.1%. If we look at the level core capital goods orders relative to shipments, the level of orders are now 1.4% below shipments. Generally, this would be considered a negative signal for the strength of investment going forward…
UBS: Consumers remain worried about the future
Conference Board confidence measure falls; estimates called for a rise …
UBS US Big Data: signals 'higher-for-longer' risk
The February US Big Data Growth Nowcast signal points to stability (+0.61) in m/m growth momentum vs. +/-0.75 acceleration/slowdown thresholds (Figures 1, 6). While not in the acceleration territory, it is the strongest since May or September 2023 for the following months. Relative to January reported data, the Nowcasts expect higher Manufacturing ISM (49.8 vs. 49.1) and positive momentum in Retail Sales ex. Autos & Gas (+0.1% vs. -0.5%) and Auto Sales (+2.7% vs. -5.2%), while Nonfarm Payrolls (215k vs. 353k) are more in line with the twelve-month average before the last two months' surge. Please see page 2 for detail. The growth momentum metric anticipates combined m/m growth changes across the monthly indicators, accounting for recent data volatility. Historically, stability favours moderate market risk (Figures 7-10). Though not an input to the growth signal, the Nowcasts also expect CPI inflation to remain elevated: headline (+0.36% vs. +0.30%), core (+0.42% vs. +0.39%). Note, that our economists' February CPI forecasts are lower: +0.35% headline and +0.27% core…
…Larger moves priced on the key Payrolls, CPI and FOMC days
The February Nowcasts are above consensus for Payrolls (215k vs. 180k con.) and core CPI (0.42% vs. 0.3% cons.), Figure 3. These are the key data points ahead of the March FOMC meeting that could reinforce sharper "higher-for-longer" market dynamics. While stock option prices reflect moderate moves on the data release days (Figure 2), the implied moves are above underlying volatility on the Payrolls and CPI days, reflecting the fact that inflation and policy risks are the key drivers of market risk sentiment.UBS: World at a Glance
Waiting for the data pendulum to swing back
The gap between US real GDP growth and the rest of the G7 over the last 6 months is at a 20-year high. The central thesis of most of our trading calls is that this can’t last, but the data so far disagrees. Given what is now priced, however, the risk reward over the next few months suggests taking a cautious view on equities, re-establishing received positions in fixed income, and being long volatility. When markets make new highs, 88% of the time they rise over the next 6 and 12m, but we’ve never seen markets make new highs when unemployment and intra-index volatility are this low.The danger the next few weeks, however, is that we expect another hot US CPI print, which could perpetuate current price action. We likely need to get that print out of the way, and see weaker consumption/employment data, before many of our more defensive trades can work. But with that caveat, we like receiving the US front end, and in equity prefer defensive positioning through software, healthcare, transmission and distribution utilities and defence stocks. In FX, we like being long high-yielders such as NZD and CAD against CHF . In credit, we don’t see an immediate trigger for spread decompression so stick with carry trades (favouring HY/LL and in Europe Fins vs Nonfins). In EM, risk premia are too compressed; we largely stick with local market receivers in Brazil/Mexico/Korea, while being generally short EMFX (we identify 7 currencies)….
… United States
Key Messages
CPI inflation and non-farm payrolls surprised on the upside in January, but retail sales fell, prior months were revised lower, and manufacturing production fell in January.
We expect real GDP expanded ~3.1% (Q4/Q4) in ’23. GDP then expands just 0.4% in '24E before reaccelerating to 2.4% in ‘25E.
The slower GDP growth should lead to a slower labor market and contraction that should raise the u-rate to 4.7% in ‘24E, helping to push core PCE inflation down to 1.9%, before rising to 2.1% in 2025E.
We expect the FOMC’s first cut at their May meeting with some risk of this slipping to June. With inflation back to target this year, we think the Fed will have considerable leeway to respond to weaker growth, returning the funds rate to 2.75 to 3% in 2024
Wells Fargo: January Durables Weakness Overstated by Volatile Aircraft
Summary
The 6.1% drop in durable goods orders overstates the extent of weakness. Nondefense aircraft was almost entirely to blame for the drop in orders, and its impact on core shipments also likely overstates the downside risk to Q1 real equipment investment.Wells Fargo: Downward Revisions Signal Consumer Confidence Has Yet to Recover
Summary
The Consumer Confidence Index fell to 106.7 in February amid downward revisions to past data, revealing confidence remains shaky and has yet to recover.
… And from Global Wall Street inbox TO the WWW,
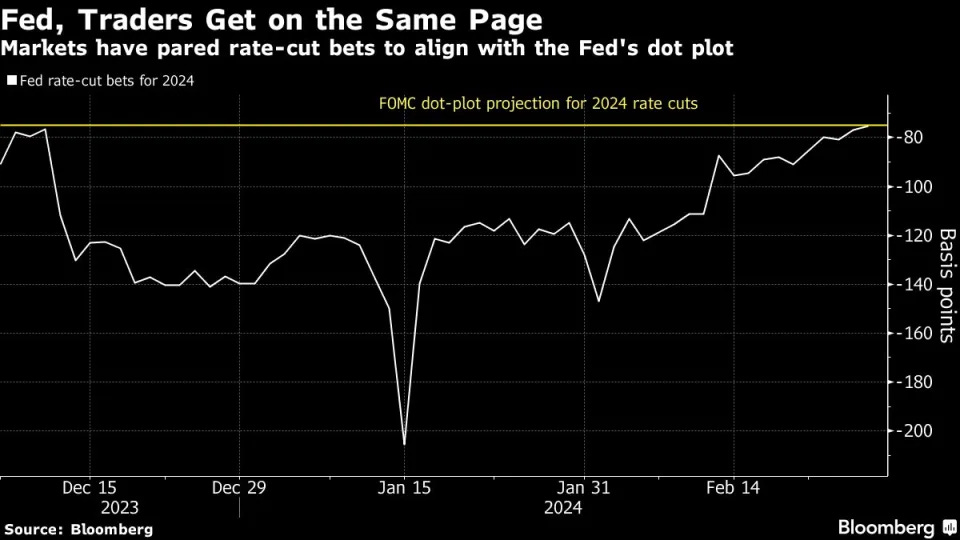
Bloomberg: Bond Traders Capitulate to Fed’s Outlook on 2024 Rate Cuts
December swap rate rises, pricing in three quarter-point cuts
Market in recent months had priced in at least six cuts
Bond traders no longer expect the Federal Reserve to lower interest rates by more than 75 basis points this year, bringing their view in line with what Fed policy makers have indicated is the likeliest outcome.
Swap contracts that predict decisions by the US central bank repriced to higher rate levels, with the December contract’s reaching 4.58% on Tuesday and only 75 basis points lower than the effective federal funds rate of 5.33%. The Fed’s target band for that rate has been 5.25%-5.5% since July.
Market-implied expectations for what the Fed will do have been converging toward the median of policy makers’ latest quarterly forecasts made in December. However, even that amount of interest-rate cuts is in doubt, with some investors contemplating the possibility that additional rate increases will be needed.
“The air has been taken out of the bubble of over-expectation of rate cuts,” said Tony Farren, managing director in rates sales and trading at Mischler Financial Group. “The market right now is fairly priced.”..
Bloomberg 5 Things You Need to Know to Start Your Day: Asia (a visual says what you need to know…)
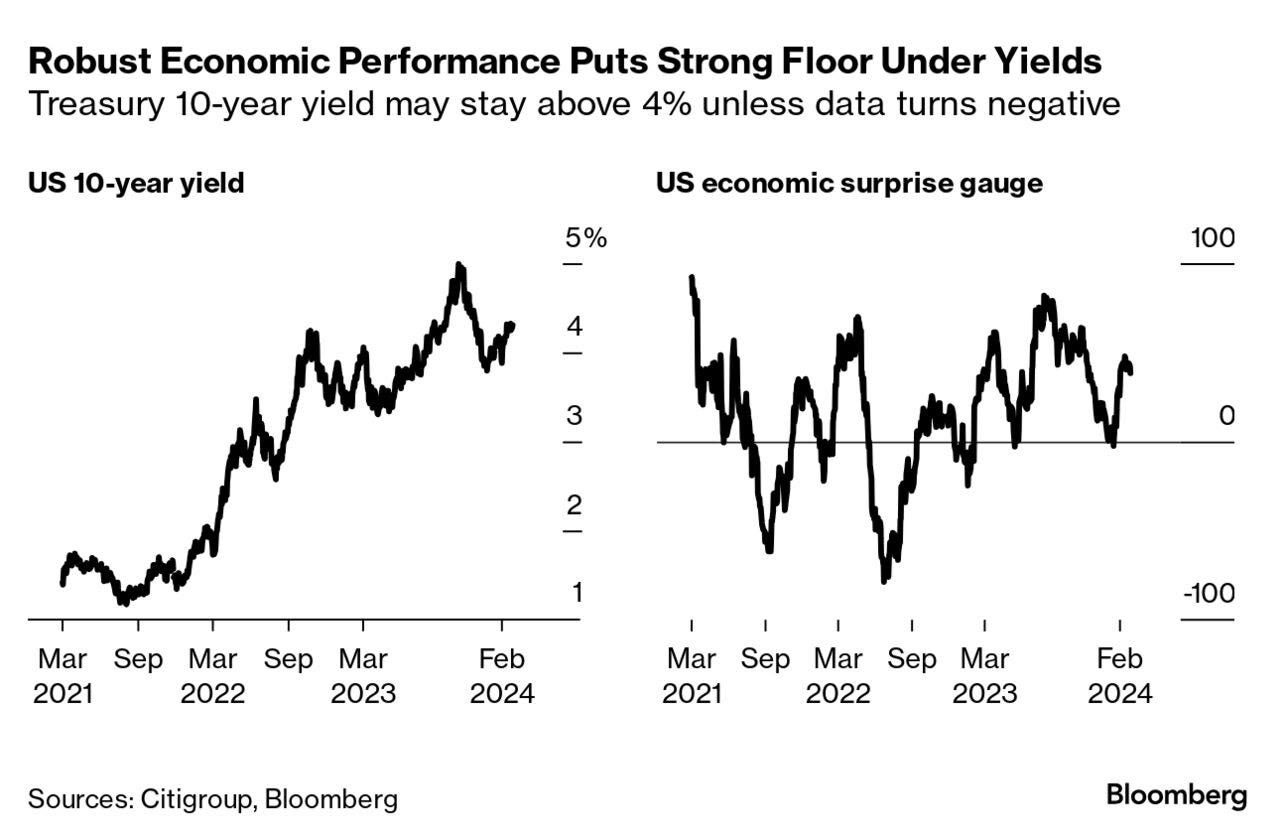
… Treasury yields are grinding higher as a flood of corporate issuance piles pressure onto a vulnerable market. Even absent that immediate trigger, a sustained rebound for bonds looks like unlikely as long as the US economy remains resilient. The late-2023 Treasuries rally was partly fueled by the Federal Reserve’s shift away from further interest-rate hikes and toward possible reductions. However, the backdrop for that was a serious deterioration in the data pulse that saw Citigroup’s US economic surprise index turn negative for a day, on Jan. 16.
The rapid turnaroud in readings on US activity coincided with a barrage of Fed pushback against bets on rapid rate cuts to send yields jumping back up. And at least some of that flood of issuance could be slated back to the stronger economy — with acquisition funding playing a major role in motivating sales.
That means yields have a pretty solid floor under them unless the economy starts to visibly crack. A sustained shift to a negative surprise reading may be needed to send 10-year yields back under 4%.
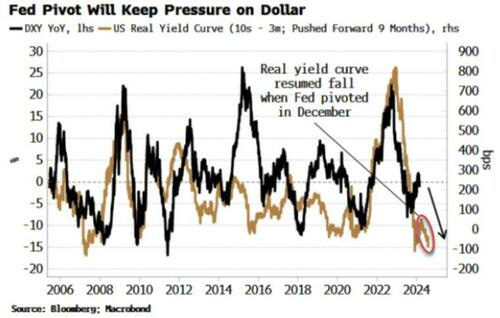
Bloomberg (via ZH): Fed And Treasury Ensure Dollar Downside Is Ahead
… The real yield curve had been steepening last year, as longer-term real yields were rising more than shorter-term ones, due in part to the influence of rising term premium. That would have anticipated a rising dollar. The real yield curve then began to re-flatten, which continued even after the Fed performed its verbal volte-face in December, as longer-term real yields have risen much less than short-term ones.
The DXY index is up ~2.3% this year, versus the average of 1.4% in the first two months of the year (data back to 1980). But the dollar typically sees all its net gains in the first three months of the year (1.7%) versus an average decline of 0.9% through the remainder.
Net positioning in the dollar is flat, leaving speculators free to move with or against it. They should favor the latter, and not be deterred by recent dollar strength (which is fairly unremarkable), and instead look to the seasonally negative latter three quarters of the year, given extra credence by fiscal and monetary policy that will continue to be a headwind.
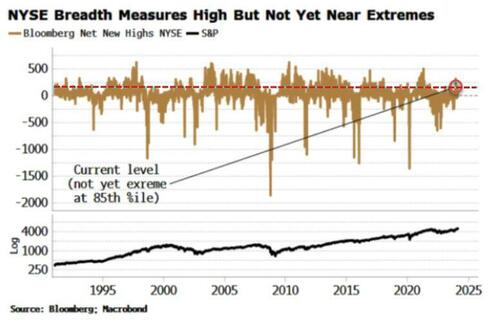
Bloomberg (via ZH): Stock Bull Market Might Just Be Getting Started, But...
… Furthermore, the rally might be on shakier legs if sentiment and technicals were overly bullish, but they are not yet historically stretched. The net number of stocks making new 52-week highs, the number trading above their 200-day moving average or their upper Bollinger band, and the advance-decline line are all high but have been higher. Moreover, sentiment is net bullish but not at extremes, while retail allocation to stocks is only at its 5-year average.
Leadership is narrow, with only a handful of stocks driving the advance, but there is little historically to show that this leads to sub-par returns. And when markets eclipse new highs, as the S&P did a few weeks ago, it acts as a psychological all-clear that we are indeed in a new bull market. Whether you agree that’s justified or not, the catch-up money that floods the market creates its own momentum.
No bull market comes without risks and this one is no different. The biggest is a recession. While, as mentioned above, that does not look likely in the near term, a sudden and unanticipated economic slump (either endogenous or due to an exogenous shock) would decimate returns. Also, a bull market that does not begin either during a recession or within 18 months of one is unusual, with only one postwar example (1966).
Equities experience their largest drawdowns in recessions, and given there is little ex ante to indicate one is coming in the current environment, it would likely be particularly devastating.
A blow-off top is another risk. Even then, despite the upset one would cause, it might not be enough to kick-start a new bear market. Inflation, too, will pose a risk to stocks, but to their real returns, unless price growth’s revival is particularly abrupt or steep (bull and bear markets are, sub-optimally, based off nominal returns). A persistent bear-steepening of the yield curve would be the sign the rally is at risk.
To misquote John Templeton, bull markets are born on pessimism, but they grow on liquidity. As long as excess liquidity is supported, the market is primed to keep grinding higher, regardless of how cynical you might be.
Bloomberg: A gap like Secretariat opens between economy, Fed (Authers’ OpED)
There’s never been a lag between changes in monetary policy and actual impact quite like this one.
Why the Lag?
Milton Friedman, the godfather of monetarism, famously declared that monetary policy worked with a lag. Change the supply of money, or change the rate of interest, and its effect would only show up in the big economic aggregates more than a year later. But since the unprecedented shock of the pandemic, it’s experiencing the longest lag in history. Secretariat-like, the economy continues to gallop far ahead of the Fed. The dramatic rise in interest rates engineered by the Federal Reserve has, to date, had little discernible impact on economic growth or employment. Working out just why this has happened now becomes critical both for the Fed and investors as they try to navigate a course through the post-Covid world.One explanation, from keepers of the flame of monetarism, is that the supply of money remains far ahead of its long-standing trend. If we look at month-on-month changes in M2, a broad measure of money supply, what happened in the early months of 2020 stands out as an unequaled dose of adrenalin. It’s true that M2 has declined much of the time since the Fed started hiking rates in 2022, and that it’s the change at the margin that normally matters — but this was quite a shock:
Tim Congdon, a former adviser to Margaret Thatcher and now head of the Institute of International Monetary Research, points out that by an even broader measure called M3, December saw an increase of almost 0.6% (an annualized rate of 7.2%). In the six and three months to December, he says, the annualized rates of increase in M3 were 3.1% and 4.6% respectively — consistent with steady economic growth, and also very surprising in the context of rising interest rates. His suggestion is that the federal government is funding its deficit by borrowing from banks, which has the effect of increasing money in circulation…
…That’s one way monetary policy is out of kilter with previous episodes. A second is suggested by old friend Jim Paulsen, a long-term economist and investment strategist who’s now publishing a Substack newsletter in retirement. He argues that this tightening cycle is unlike any before it because the hiking didn’t start until inflation was virtually at its peak. The long gap while rates stayed effectively at zero and inflation surged toward 9% is marked on the chart:
That goes a long way toward explaining why the lag is operating differently this time. Rates have risen (a depressing effect on the economy) at the same time as inflation has come down (which should stimulate the economy) and have canceled each other out, just the way as the effect of the preceding inflation that was cushioned by zero interest rates.
FRBNY: How and Why Do Consumers Use “Buy Now, Pay Later”? (reminds me of THIS)
Unlimited: Far From Perfect: Inverted Yield Curves Don't Reliably Predict Recessions or the Direction of the Markets (this counter TO what was noted YESTERDAY - and here over on X … i ‘report’ U decide … who ya gonna believe …?)
… Predicting Economies Is Hard, Stop Looking for the Golden Goose
Those folks who have been around macro long enough appreciate that predicting what is likely to transpire in the economy is hard. There are always significant cross cutting pieces of data that will suggest expansion and contraction at any point in time. That challenge magnified post covid where supply & demand bullwhips have also degraded many traditional measures and linkages.
With so much uncertainty more information is better. Those folks who have navigated the last couple years well have flexibly incorporated a wide range of data to get a comprehensive picture of the economy and adjusted their positions, particularly during periods of extreme market positivity or pessimism. Those that were stuck on single indicators struggled to find the signal through the fog.
It is time to retire yield curve inversion to the dustbin of history. It is a mediocre predictor of recession over a time frame relevant to investors and it sucks as an equity indicator.
… THAT is all for now. Off to the day job…






4-23-79 WOW, I'm racking my brain trying to remember WHAT I was doing at age 7 then, Stepmommie from Hell #2 hadn't arrived on the scene yet....I remember 1981 much better, the Raiders winning SB#15, 1st SB I remember watching...the 1st Space Shuttle successful launch, and landing, those were fun, exciting times....
Don Regan, I vaguely remember the name. After studying that list and each of those Tres. Sec quotes, Don appears to be the most honest, or the least of the liars. I've learned just a little since 1979....I'll give Don a pass, but his successor James Baker III is a straight LIAR, considering he was negotiating the Plaza Accords at the time, which resulted in what, a 40% decline in the dollar vs the Yen subsequently?
Great letter !!!
That's one FLAT Yield Curve....2yr - 30yr....Delta is -.26bps