Global equities are meaningfully weaker overnight with most 2.5% declines across European bourses and 0.5% to 1.5% losses across Asia.
China posting a 1.4% gain. Chinese non-mfg PMI data beat expectations and mfg PMI was largely in line with expectations.Weak industrial output data weighed in Japan. Bank of Sweden hiked rates 50bps. Softer than expected import price data in Germany spurred a rally in bunds.
… European sovereign markets are rallying and bunds are 10 bps richer and with rest of complex following advances of 5-10 bps richer.
Eurodollar futures are rallying as well late 2022 dates 10 bps richer and the term structure generally 7 bps richer across the board.
U.S. Treasuries are bull steepening with the front end (2s, 3s, and 5s) leading the way, all about 5 bps richer.
Credit spreads are wider, particularly in Europe with cross section of 5-15 bps cheaper and U.S. IG is off 3-4 bps and HY looking 7-15 bps cheaper this morning.
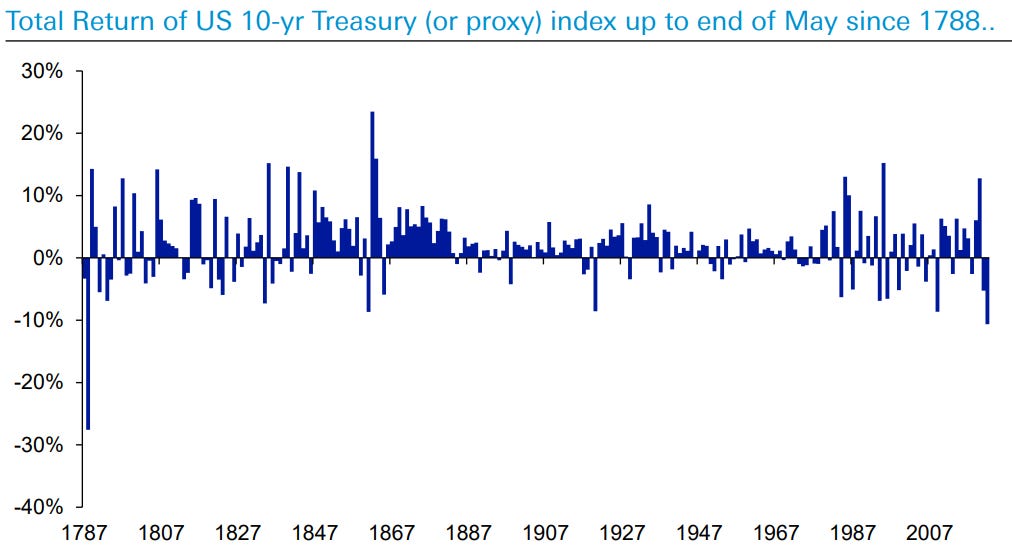
As the quarter and H1 2022 come to an end, we’ll continue to hear of return horror stories … Things like this, from CNBC
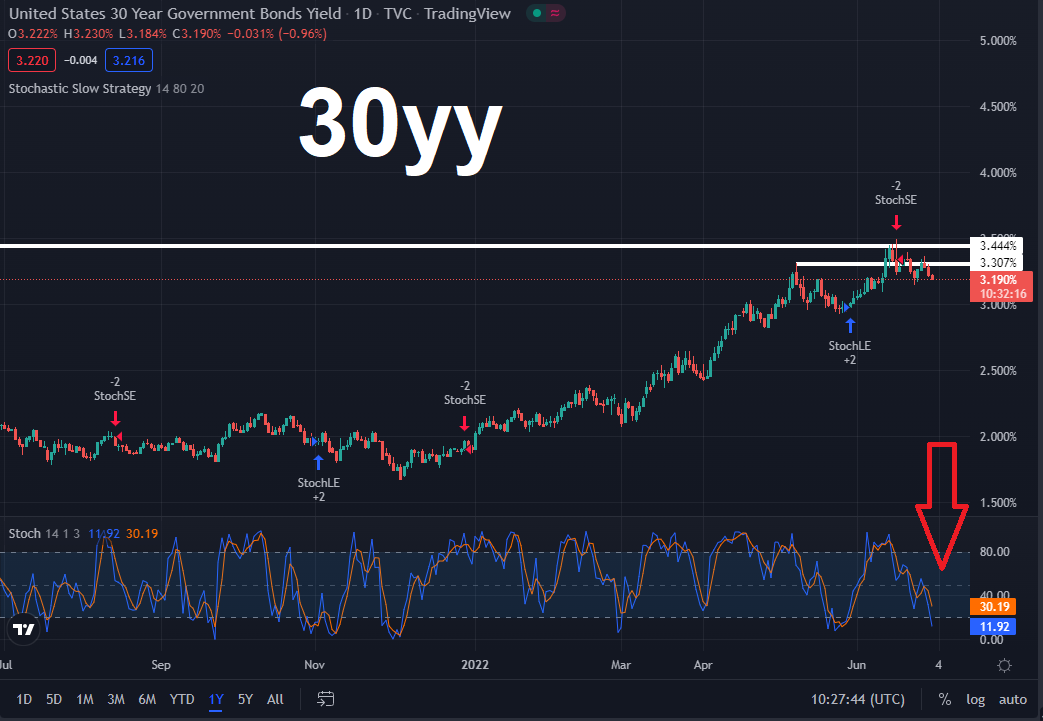
Meanwhile, equity futures remain offered and this is keeping a bid underneath the bond market, driving the longer end into (nearly) overBOUGHT territory,
It’s not to say bond market cannot get / STAY overbought longer than one might think, it’s just some food for thought.
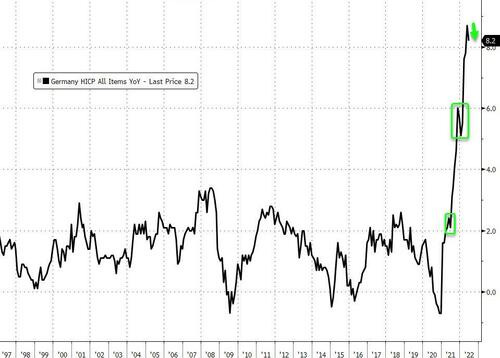
German Inflation Unexpectedly Eases In June, But...
German inflation unexpectedly slowed in June, with harmonized CPI slowing from +8.7% YoY to +8.2% YoY, dramatically below expectations of a rise to +8.8% YoY. Notably, we have seen these 'dips' in inflation before on this surge, so let's not get too excited...
As a former card carrying member of Team Transitory the ‘good news’ from Germany which did supply a bit of a BID for bunds that ultimately helped USTs, does need to be taken with an extremely large grain of salt…
… here is a snapshot OF USTs as of 723a:
… HEREis what another shop says be behind the price action — excerpted from morning commentary titled, “Breaking Breakevens”
Overnight Flows Treasuries were better overnight as yields continue to fall into month-end. Overnight volumes were modest with cash trading at 82% of the 10-day moving-average. 5s were the most active issue, taking a 36% marketshare while 10s were second at 24%. 2s and 3s combined to take 30% at 17% and 13%, respectively. 7s managed 7%, 20s 1%, and 30s just 3%. We’ve seen buying in 2s and two-way flows in 10s. We’ve also seen better selling in the long-end of the curve.
… It's month-end and as such flows will be in focus. All else being equal, we anticipate duration will benefit once this morning’s reports are absorbed and attention (appropriately) shifts toward the quickly-approaching long weekend. One source of buying interest that has remained conspicuously absent is the Japanese investor base. The weekly MoF data illustrated this point and showed the nation was net sellers of overseas notes and bonds totaling -$11.8 bn during the week of June 24 versus sales of -$3.6 bn in the prior week. This marks the fifth consecutive week of selling and during 2022, Japanese investors have sold a net of -$89.4 bn. While this series includes other sovereign issuers, the vast majority of it has historically been US Treasuries and is certainly consistent with the anecdotes related to the flows from this sector.
… and for some MORE of the news you can use » IGMs Press Picks for today (30 June) to help weed thru the noise (some of which can be found over here at Finviz).
A couple MORE things from Global Wall Streets inbox which may hold some funTERtainment value ahead of month/qtr/half-years end.
THIS from THE bank which claims (in name at least), to represent America, updating where ‘the indicators stand’
Downside risk remains, but there are green shoots
SPX: Higher path since 1930s but with plenty of big dips After the 1929 market crash and downtrend into a 1932 low, the S&P 500 (SPX) has trended higher, surpassing the 1929 peak in 1954. Intra-day data show an early January into mid June cyclical bear market of 24.5%, which corrects the 120% rally from the March 2020 low. Chart 1 shows that big rallies over the years get interrupted by sizeable corrections, but the SPX has trended higher over time, especially after bullish breakouts in 1950, 1950, 1980 and 2013
… Indicator to watch: 12-month ROC for margin debt After peaking at 71.6% in March 2021, the 12-month rate-of-change (ROC) for FINRA margin debt has dropped to a new cycle low at -12.61% in May. We consider a move below zero as oversold, but a negative 12-month ROC can persist and with deeper oversold readings. Regaining zero after moving below -10% on the 12-month ROC can help confirm equity market lows and/or bottoms, which means that this is a key indicator to watch in the months ahead.
Note to self — NOTHING on rates. OKIE DOKIE. Moving on, then to THIS from BBGs John Authers
Inflation almost seems passe. The worry of the moment is now economic growth. That’s not unreasonable, as the latest update shows US gross domestic product declined at an annualized rate of 1.6% in the first quarter. With the huge exceptions of the Covid-scarred first two quarters of 2020, this was the weakest US growth since the spring of 2009:
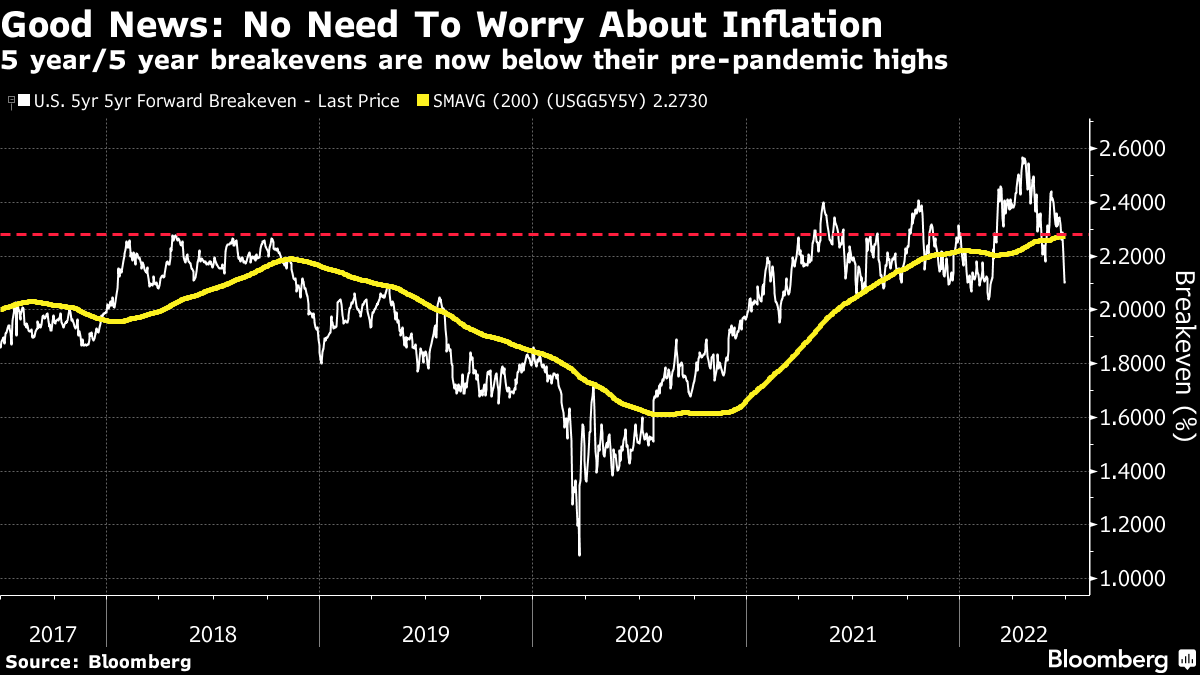
That has had the effect of seemingly eliminating concerns about inflation, even though the battle against it has barely begun. Breakevens, derived from yields on inflation-linked bonds, have dropped all around the world. The 5-year, 5-year forward breakeven, which aims to capture average inflation for the five years starting five years hence and is the measure most closely followed by the Federal Reserve, has now dropped below its level from much of 2018, before the pandemic. Fast approaching the Fed’s target of 2%, the bond market is saying that inflation is no longer anything to worry about:
And then there’s this one from a large German bank
Several weeks ago we argued that, while traditional recession probability models were consistent with relatively low risks given today’s data, these probabilities were likely to rise materially based on the market pricing of future yield curve movements and the Fed’s need to tighten financial conditions (see “Expect recession probabilities to rise”). Since that time, recession anxieties have reached a fever pitch in markets, as tightening financial conditions have been followed by weaker-than-expected data in a few sectors, including housing and global manufacturing.
In an attempt to always be on the lookout for improvements in our modeling frameworks, in this brief note we take lessons from a recent Fed paper on recession probabilities and combine our baseline model with our measure of the Fed's distance from its targets. The primary conclusion from this analysis is that incorporating how far the economy is away from its targets improves the performance of our baseline recession probability model. In the current context, this enhanced model points to considerably higher recession probabilities in 2023 even if financial conditions do not tighten further. Specifically, the model including the distance from the Fed's targets displays a two-thirds probability of a recession in 2023, versus a 40% predicted probability from the baseline model that excludes this important variable. These findings support our view of a recession occurring in 2023 (see "Frontloaded tightening to accelerate a deeper downturn").
You can pretend the bond market doesn’t matter all you want.
But I’m here to tell you that this $115 Trillion + market that we call “bonds” is what’s moving things around here.
It starts with credit.
If there is stress in credit, then you’re going to see the implications across markets.
An easy way to see this is to look at the relationship between high yield bonds and treasuries. As this line is declining, those are credit spreads widening.
I don’t see any reason why the S&P500 should have any sort of sustainable rally without a contraction in those spreads.
We’re currently seeing the opposite…
Emphasize CURRENTLY … Wondering IF these ‘all stars’ have read latest from Liberty Street. I mention it as it appears the WSJhas noting,
New Fed Tracker Shows Rising Strains in Corporate Debt Gauge indicates pressure on investment-grade corporate bonds, though it remains far below levels hit in crises
… On the index’s zero-to-one scale, where lower numbers signal calmer conditions, the latest data show a distress reading of 0.36 for high-quality bonds, a significant rise compared with levels as low as 0.08 last November. Despite the climb, the index is well below records from previous crises, such as the 2008 financial meltdown.
HEREis a visual of the data from The Fed with a June 2022 Update
Corporate bond market functioning appears healthy, with the overall market-level CMDI below its historical median.
Market functioning is somewhat more strained in the investment-grade segment of the market.
Finally, a couple things that make you go, hmmmmm.
First up is current scene from your local bank as you attempt to get a home loan
NEXT is, well …
AND one for the green new dealers and green thumber’s