Good morning … If supply constraints hitting oil and so, driving gas prices higher, a gas tax ‘holiday’ (ahead of summer driving season and elections) will create MORE demand thereby driving prices HIGHER … what next, beer tax holiday? No homework? Question: will said gas tax holiday offset high/rising cost of your ARM?
Oh, forget it. JPOW @ 930a delivering semi annual mon pol report (aka Humphrey Hawkins) can be viewed HEREand this SHOULD be finished up and attentions returned TO the bond market at 1pm — got 20s?
… HEREis what another shop says be behind the price action, you know,
WHILE YOU SLEPT Treasuries are higher and the curve steeper this morning as Gilts and EGB's drag Treasuries higher amid risk-off conditions (stocks, metals, energy and crypto all weaker). DXY is little changed while front WTI futures are notably lower (-4.5%). Asian stocks fell pretty hard (KOSDAQ -4%), EU and UK share markets are all in the red (SX5E -1.8%, FTSE 100 -1.35%) while ES futures are showing -1.35% here at 6:50am. Our overnight US rates flows saw a quiet Asian session where turnover was concentrated in the under-performing 2y point. Some back-end buying was noted there and the same was true in London's AM hours where EU real$ and credit-linked names bought the long-end as well. Asian real$ sold 2's again in recent hours. Overnight Treasury volume was ~70% of average all across the curve (just 58% of average volume in 20yrs- not good on auction day).
… and for some MORE of the news you can use » IGMs Press Picks for today (22 June) to help weed thru the noise (some of which can be found over here at Finviz).
Meanwhile, from some of Global Wall Street’s wiz kids,
Not sure why it is BUT … when I see the biggest brains on the block talk about how fast conditions have worsened, I’d imagine morning meetings there be like THIS
Anchorman (and any further attempt to lighten the mood)aside, from the CHARTS (and 1stBOS) department,
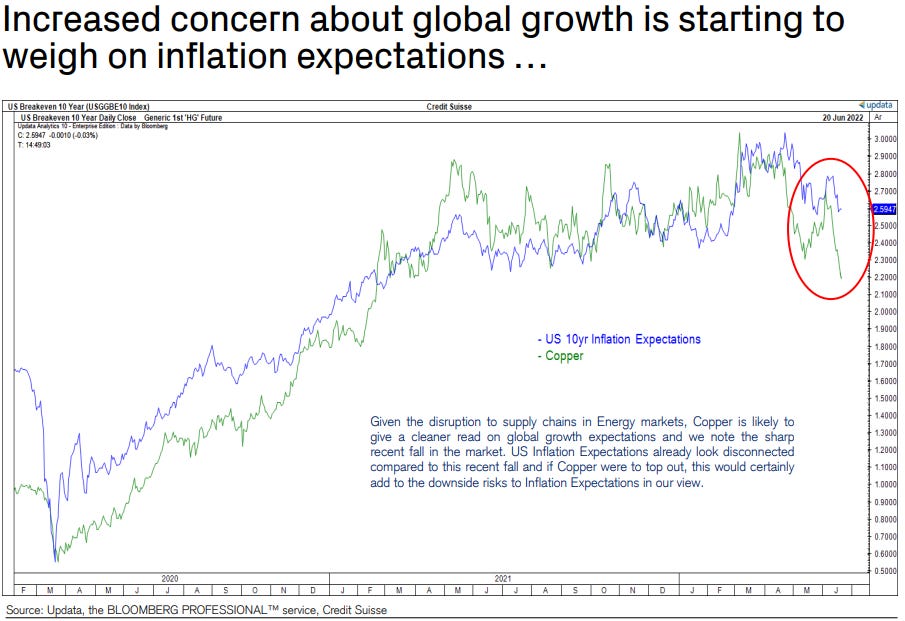
Increasing fear of slowing global growth is rearing its head and in our view will start to replace inflation as the major focus for investors going forward as we see whether or not these concerns are justified. From a technical perspective, we are starting to see a deteriorating picture for Commodities and especially Industrial Metals, in line with these concerns. Importantly, no major tops have been established here as yet but the risk for these are building in our view and if confirmed would mark a further worrying negative turn of events.
…and weakness in Copper and global growth concerns is starting to weigh on Inflation Expectations and although we maintain our view from late April for Inflation Expectations to stay rangebound, downside risks are building in our view.
Never a fan when technical analysts go to the charts for economic inputs as I don’t see things from the economic world as ones which fit with that sort of analytics … be that as it may, charts are charts …
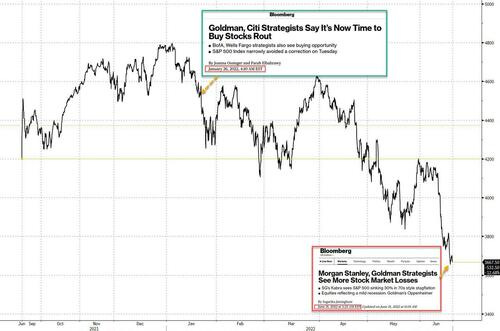
Something for everyone? Stock jockeys and bond bros both hurting? Feel better? I don’t. Need / want MORE on stocks — here’s what you’ll need to know, via ZH
… To learn from history in the current constellation of risks, we have to go back (at least) to the 1970s -- if our sample contained only 21st century data (last 22 years), we would be making conclusions about the double-digit inflation based on the period of its sub-3% regime.
Current levels of CPI define a boundary between the 1970s and post-1980s. The Volcker area of CPI above 6% is highlighted in the chart (1 & 2). This period corresponds to high inflation and uber-hawkish monetary policy. Between Nov-1977 and Nov-1978, CPI remained range-bound around 6%. During that time, the Fed preemptively raised rates from 4.75% to 6.5%. As inflation increased to 8.45% in the subsequent 12 months, Volcker’s Fed delivered another 325bp, pushing the short rate to 9.875%. This should be contrasted with the current Fed: Since Mar-2021, Core CPI rose by nearly 5% while, during that time, the short rate increased by only 150bp.
… We think risky assets could continue to trade in a ‘fat and flat’ range until the growth/inflation mix turns more friendly with convincing signs that inflation is peaking and growth momentum stabilizing. Until that happens and with both macro and market-based models pointing to higher and more front-loaded recession risk, we would remain N equities tactically and OW commodities and cash…
Jumpin’ the shark here a bit, no? nothing wrong with aspirations!! O/W cash reminds ME of
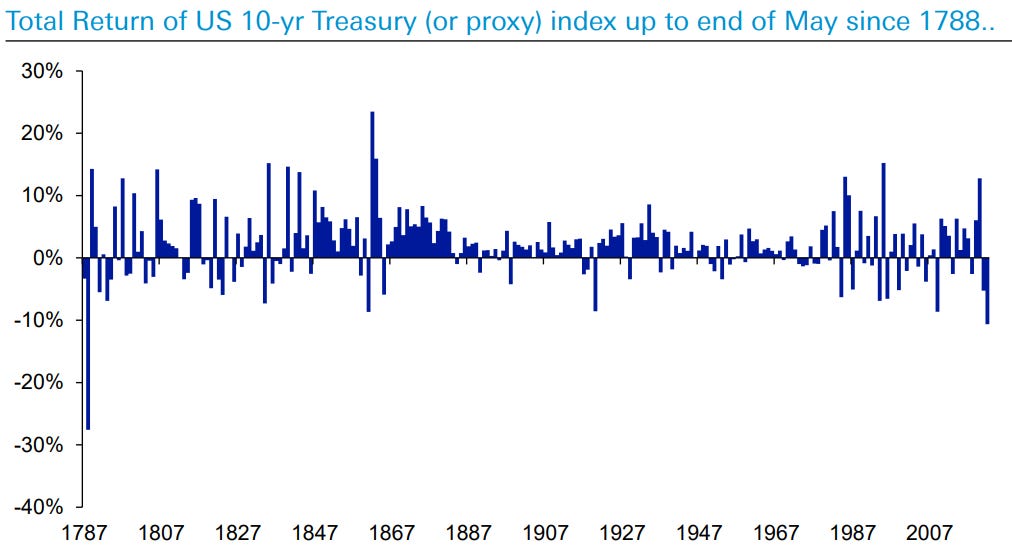
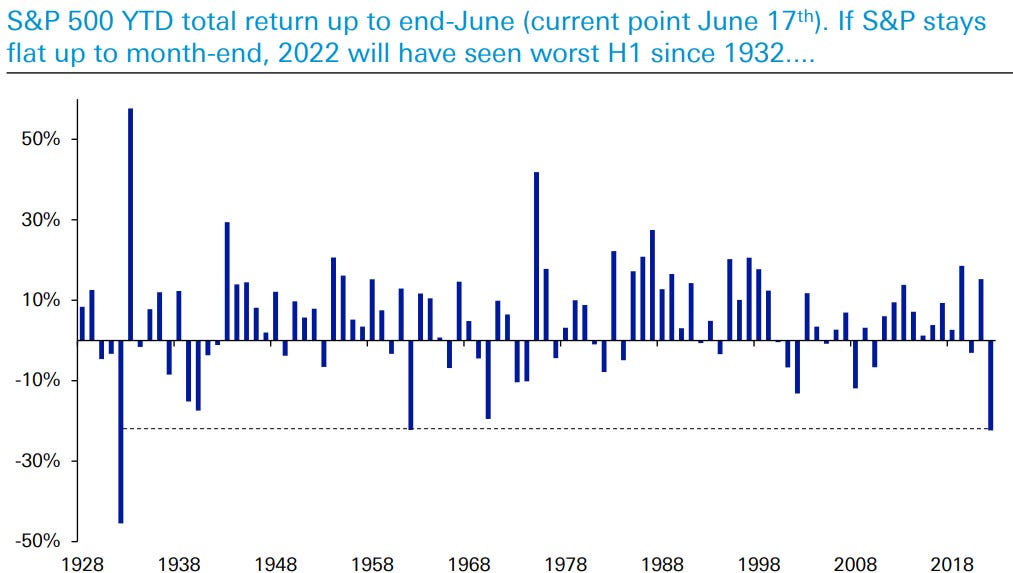
That said, a couple visuals from THE REPORT re RATES and performance relative to stocks and ‘flation peaks
The path for 2-year rates is generally more clearly skewed to the downside past the inflation peak (Exhibit 6). Front-end rates tend to more directly reflect monetary policy shifts and Fed fund rates have fallen in 7 of the 11 peak inflation instances we consider in our analysis. Of course, the level at which inflation peaks will matter in shaping the monetary policy reaction function – our economists are concerned the Fed will feel compelled to respond forcefully to high headline inflation and consumer inflation expectations if energy prices rise further, even if activity slows sharply.
We think the potential for relief for risky assets from an inflation peak ultimately depends on growth…
Okie dokie … ahead of the Fed chair testimony,
UBS: The Fed Chair who cried “wolf” US Federal Reserve Chair Powell testifies to Congress. Powell’s policy style is more the bumbling of former Fed Chair Burns than the shock and control of former Fed Chair Volcker. Inflation control today is less about wages and more about profits and pricing power. But the questions for investors are: Has consumer price inflation (or just gasoline prices) become the inflation target? With forward guidance trashed, why should anyone believe anything Powell says?
Markets are flip-flopping between recession fears and inflation fears. Today it is recession fears. Real wage growth is terrible in most major economies. However, consumers are cutting savings rates or increasing borrowing in order to support demand—limiting the growth slowdown. The reduced saving/increased dissaving depends on job security…