ZH: Fed Unexpectedly Kills Bank "Free Money" Bailout-Fund Arbitrage Scheme As It Ends BTFP Program
…As we explained before, a completely perfect and riskless 'free money' arbitrage was available to those banks who could lodge collateral with The Fed at its BTFP facility receiving cash at par (at a cost of OIS+10bps) and then post that cash earning Fed Funds rate on it, pocketing the difference.
The difference - at its peak - amounted to over 60bps of free money from you, Mr. and Mrs.Taxpayer (implicitly), to the bankers for doing absolutely nothing at all…
… Read on but generally speaking, this ‘subsidy’ …
… And speaking about being GONE … If the Fed wanted to remain ‘easy’ (cut) isn’t it odd they’d do this? NO, likely not as there are seperate and different dynamics here at play, to be sure BUT … general premise remains — BTFP subsidy eliminated is a form of restriction being imposed. Less profit for banks means less lending activity, generally speaking, i’d THINK … and so …
...In a historic shift on 25 January 2012, U.S. Federal Reserve Chairman Ben Bernanke set a 2% target inflation rate, bringing the Fed in line with many of the world's other major central banks.[24] Until then, the Fed's policy committee, the Federal Open Market Committee (FOMC), did not have an explicit inflation target but regularly announced a desired target range for inflation (usually between 1.7% and 2%) measured by the personal consumption expenditures price index.
… remains to be seen
How ‘bout those 6 rate CUTS this year …
ZH: US PMIs Unexpectedly Soar In January Amid Manufacturing 'Renaissance', But...
… for more on the great HUGE BIG ‘ole but, see below and for now, a quick recapAthon of yesterdays 5yr auction (which was of great interest to at least a couple I know out there on Global Wall St — detailed this past weekend HERE — and hopefully NOT a precursor for this afternoons 7yr)
ZH: Catastrophic 5Y Auction Tails Most Since Sept 2022, Sends Yields Surging
… um … PADDLES. STAT. Send over to trading floors of the firm(s) mentioned over the weekend as well as any / all clients blindly following along (and, well … ME too I suppose !!)
Yet another reminder of why I’m no longer in that seat … and I say that trying to NOT confuse here, causation with correlation … But I was surprised, to say the least.
AND … lets go ahead and jump right in and apply algos and scientific method TO this afternoons liquidity event … a look at 7yy
… and with that picture, have I muddied the waters ‘nuff? Sorry … momentum (stochastics, bottom panel) appear overSOLD and so that COULD lead one to think 7s have a concession and might just be buyable. They might have thought same ‘bout yesterdays 5y (and if you read on, you’ll note one of those firms staying LONG belly) so we’ll continue to monitor yields current UPTREND which is challenging Dec FOMC PIVOT …
… All told, YESTERDAYs market recap …
ZH: Big-Tech Bid, Bonds & Bullion Battered As 'Better' Data Made Doves Cry
… when. doves. cry …
… or get squashed by a couple ton Rhino …
… AND … here is a snapshot OF USTs as of 730a:
… HEREis what this shop says be behind the price action overnight…
… WHILE YOU SLEPT Treasuries are modestly higher with the curve a hair flatter, outperforming EGB and UK markets ahead of a brace of 8:30am economic data releases here. DXY is little changed while front WTI futures are higher (+1.25%). Asian stocks were mostly higher with strong gains in Chinese shares again, EU and UK share markets are modestly lower while ES futures are modestly higher (+0.1%) at 7:10am. Our overnight US rates flows saw better buying in the long-end from real$ during Asian hours. London's AM hours were described as 'orderly' with some dip buyers emerging in 7yrs alongside interest to flatten 5s10s (see attachment on that). Overnight Treasury volume was about average overall with relatively high average turnover seen in 3yrs (151%) and 5yrs (139%) overnight.
… and for some MORE of the news you can use » The Morning Hark - 25 Jan 2024 and IGMs Press Picks (who CONTINUES to be sportin’ that new, fresh look) in effort to to help weed thru the noise (some of which can be found over here at Finviz).
Moving from some of the news to some of THE VIEWS you might be able to use… here’s SOME of what Global Wall St is sayin’ …
DB: Refunding preview: Locking in a final round of coupon increases
We expect the Treasury to increase nominal coupon auction sizes one last time, following through on its guidance from November.
While the November refunding entailed a surprise moderation to longer-maturities increases, we think the Treasury will prioritize commitment to its regular and predictable philosophy this time by maintaining the same pace of increases as November for the upcoming quarter.
In TIPS, concerns of the global inflation trend weakening the demand for TIPS will be weighed against the recent development of Germany ending its sales of new linkers, likely nudging the Treasury in the direction of making further increases in the 5-year and 10-year sectors.
On buyback timing, we think the chances favor an implementation at the upcoming meeting. We look for $10bn per month in liquidity-support buybacks across the nominal coupon curve and in TIPS to start.
Overall, there should be fewer potential surprises compared to the last two refunding events, and trading opportunities are more limited to RV than in outright duration.
JEFF: February Refunding Preview: Expect Coupon Auctions to Ratchet Higher Once Again
Key Points ■ We expect that Treasury will increase coupon auction sizes along the same lines as they did in November, with $3B monthly increases in 2- and 5-year notes, $2B monthly increases in 3-year notes, and $1B monthly increases in 7-year notes throughout the quarter. We also expect a $2B shift higher in 10-year note auctions and reopenings, a $1B shift higher in 30-year bond auctions and reopenings, and a $2B shift higher in 2-year FRN new issues and reopenings. We also expect $1B increases in 5- and 10-year TIPS auctions, and no change to the sizes of 20-year bonds or 30-year TIPS. ■ Treasury has been issuing a tremendous amount of bills since the debt ceiling was suspended in early June. The market has absorbed them well, and can continue to support this pace of issuance for the near-term, but Treasury is appropriately shifting the focus on terming out the debt. ■ Borrowing projections will likely be revised somewhat lower, given Treasury's solid tax receipts in Q4, and a higher than expected cash balance to end the quarter. ■ Along with the auction size guidance, Treasury will provide more detail on the buyback program. However, we do not expect that buyback operations will begin until May.
We expect little change to the statement and no signal of an imminent cut. The rotation of voters tilts a bit less favorable for an early cut. Discussion will center on inflation and the rates path ahead, and the balance sheet. Our strategists stay long UST 5y.
S&P Global flash manufacturing PMI edges into expansion This morning's S&P Global manufacturing PMI headline moved up 2.4 points to 50.3 in the flash January reading, a 15-month high that printed stronger than our (46.0) and consensus (47.6) expectations…
UBS: January Nowcasts Suggest Stable Start to 2024
… Nowcasts point to stable inflation print coupled with continued strength in retail spending
Stocks and Politics The 2024 Presidential Election is just 286 days away, and Bespoke will be covering the race as it relates to markets and investing every step of the way for subscribers. Breaking down market historicals is one of the things Bespoke is most known for, and we've got a number of reports currently available that can help investors stay grounded when politics and markets collide. In a report published for premium subscribers today, we've looked at the S&P 500's historical performance during Presidential Election Years. The chart below is one of a few from this report, and it shows how the S&P has done throughout Election Years depending on whether a Democrat or Republican is currently in the White House leading up to Election Day.
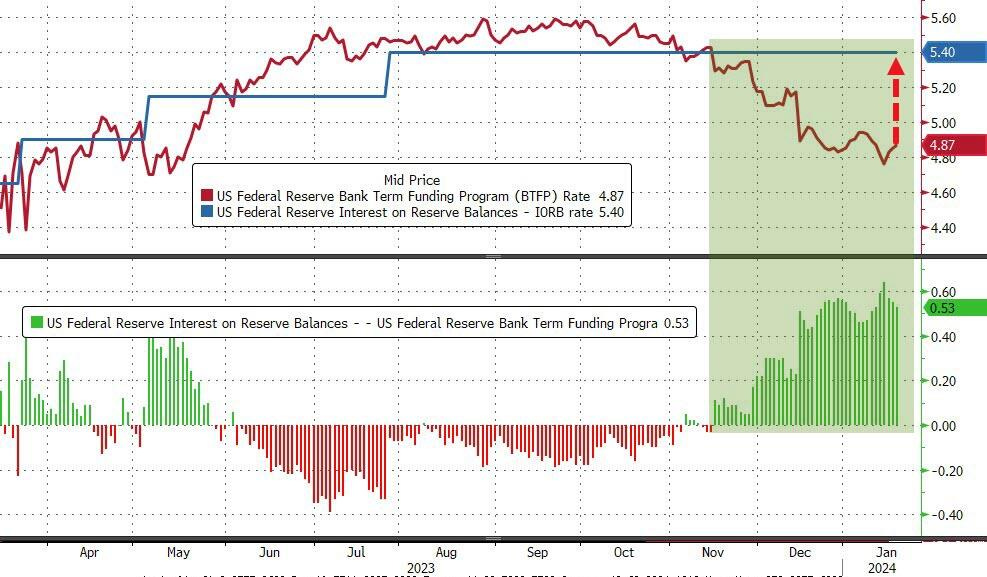
Bloomberg: Fed Raises Rate on Emergency Loan Program to Stop Arbitrage
Bank Term Funding Program will expire on March 11 as planned
Banks will see higher rates to borrow effective immediately
… But effective immediately, the adjusted interest rate for borrowing will “be no lower” than that of reserve balances in effect on the day the loan is made, the Fed said on Wednesday night.
That rate on reserve balances, which typically moves in tandem with the Fed’s benchmark federal funds rate target, is currently 5.4% — compared with the lending program’s 4.88%, which is tied to market interest rates. Those had fallen in recent weeks on expectations of Fed rate cuts.
“This rate adjustment ensures that the BTFP continues to support the goals of the program in the current interest rate environment,” the central bank said in a statement, adding that no other program terms have changed.
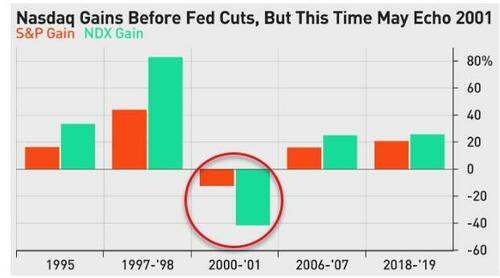
Bloomberg (via ZH): Dotcom History Rhymes For Nasdaq As Fed Cuts Loom
Authored by Ven Ram, Bloomberg cross-asset strategist,
History shows that stocks are well poised to gain before the Federal Reserve starts slashing rates, but daunting valuations for technology names suggest that the S&P 500 may outperform the Nasdaq in the first half of the year.
Both the S&P 500 and Nasdaq 100 baskets have traditionally rallied in the interregnum between the end of a Fed tightening cycle and the start of policy loosening, except on one occasion: the 2000-01 cycle, when the markets were caught deep in a bubble.
In the run-up to the rate cuts of 2001 — when the Fed slashed its benchmark rate by a whopping 475 basis points - the S&P slid more than 12%, while the Nasdaq slumped 42% as buyers’ remorse start to grip the markets after the dotcom mania had run its course. Given the humongous rally in technology stocks over the past year, we may well see a repeat of that cycle.
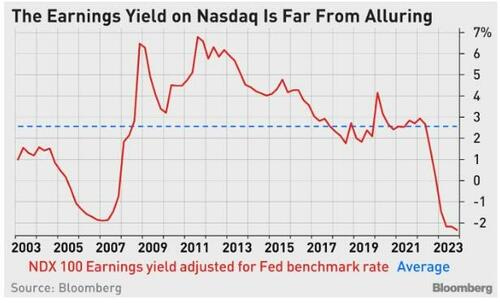
While valuations of technology stocks may not be as daunting as they were then, the Nasdaq is trading far from levels that many investors would consider reasonable.
At current levels, the Nasdaq 100 offers an earnings yield that is the lowest in relation to the Fed funds rate since the days before the dotcom bubble burst.
In fact, the 3.25% prospective earnings yield on stocks is tantamount to the basket trading as though the Fed’s fund rate has already fallen to those levels, even assuming that they can trade pari passu with the benchmark rate.
The fair value of the Nasdaq is 12,877 when the technology basket is viewed as a long-duration bond.
Under conditions of stable long-term interest rates and steady dividend growth rates, that valuation can’t turn on a dime.
That fair value suggests that technology stocks are now trading at a rich premium of more than 30%. That excess may be thought of as the price that the markets are assigning to the growth potential of artificial intelligence.
While some of that enthusiasm may be condoned, history shows us that traders often have he right idea, but the wrong price — and that may be the case with estimating the potential of AI-related stocks, too.
In comparison, the S&P 500 is trading more or less where it is indicated fair.
While fully valued at current levels, the froth — given a fair value of 4,632 — is within acceptable limits, especially against a backdrop where a Fed pivot may stoke earnings growth.
The Nasdaq 100 has rallied about 3% so far this year ahead of expected rate cuts.
Coming on top of stunning gains of almost 55% last year, technology stocks have priced in all the good news out there and more — making them vulnerable to a bigger correction than brick-and-mortar stocks.
Calafia Beach Pundit (former WAMCO): More disinflation, no recession, US king of the world
…For most of the past two years the world has fretted that, in order to wrestle inflation down, the Fed would have to raise interest rates by enough to cause a recession. Not surprisingly to those in the know, they have achieved the former without the expense of the latter. For the past several months the world has fretted that the Fed might be slow to reduce interest rates, and that this would jeopardize the economy's prospects. While it's true that the economy has indeed slowed (see Chart #2 in my last post), there are still no signs of a recession: credit spreads remain quite low, implied volatility is low, corporate earnings continue to impress, the dollar is still king, banks continue to lend, and the stock market continues to rise. All this despite crushing tax and regulatory burdens, mounting geopolitical tensions and a feckless national government. In the fullness of time we'll find out who, if anyone, deserves the credit or the blame for what lies ahead.
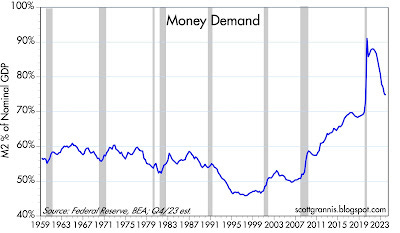
The charts that follow provide an update of the critically important M2 story plus an overview of some of the important macro developments in the world economy…
… Chart #3
Chart #3 is an another (and possibly a more intelligent) way of observing the demand for money. It divides M2 by nominal GDP, and that in turn tells us approximately how much of our annual incomes we prefer to hold in the form of readily spendable money. Money demand exploded during Covid, and then collapsed. The explosion in the demand for money meant that most of the $6 trillion in M2 money "printed" by the Fed and the banking system from 2000 through 2021 was happily stored by the public, socked away under mattresses and in bank savings and checking accounts. It wasn't spent, and so it didn't fuel inflation. But as the demand for all that extra money faded (and as the economy gradually normalized), most of the money was spent and that fueled an uncomfortably large rise in the price level (a process hastened by supply-chain shortages). The Fed was slow to understand all this, and was thus slow to raise interest rates. Fortunately, the Fed's higher interest rates eventually offset the decline in the demand for money because they made holding money more attractive. Interest rates are still relatively high and M2 is no longer declining, which is why we are likely to see further disinflation.
… Chart #6
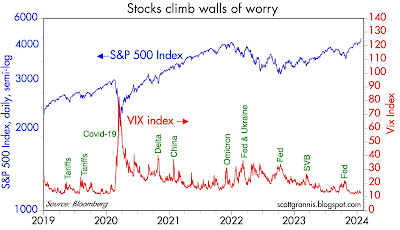
Chart #6 compares the level of the S&P 500 to the level of the Vix "fear" index (a measure of the implied volatility incorporated in option prices). Rising fears typically result in lower stock prices, and vice versa. Today the stock market is reasonably comfortable, and prices have attained new highs.
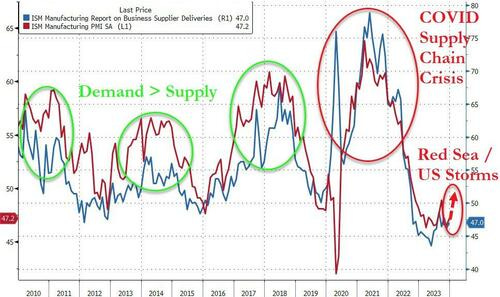
ZH: US PMIs Unexpectedly Soar In January Amid Manufacturing 'Renaissance', But...
… But... and it's a big but...
Don't get too excited about the super-hot US PMIs.
They did it again - Lead times lengthened for the first time in over a year and to the greatest extent since October 2022.
S&P Global interprets that a positive in their model - longer lead times must mean demand overwhelming supply, hence 'good' news.
But in this case - just as we saw during the COVID lockdowns - the longer lead times are supply-chain bottleneck issues (Red Sea and US storms) - and not at all a positive.
"...firms noted broadly sufficient availability of materials at suppliers, challenging trucking conditions due to storms and transportation delays reportedly weighed on vendor performance
Purchasing activity at manufacturers continued to contract, with firms also depleting pre-production inventories further, but both rates of decline eased on the month.
Stocks of finished goods saw a renewed expansion, indicating the fastest rise in post-production inventories since November 2022."
Does that sound like the message of an "expanding" manufacturing sector?


That picture is not a rhino, its a hippo. Great illustration nonetheless :)
Whether it's a rhino or hippo (I'm ignorant of the difference!) why does my minds eye see Orange Man sitting atop Haley & cohorts I wonder....