Good morning / afternoon / evening <please choose one that best suits>
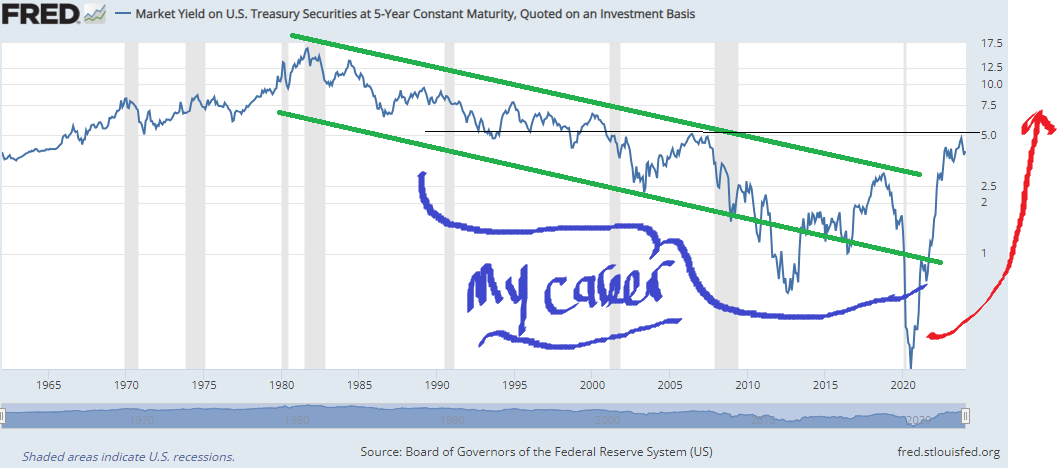
I couldn’t help myself and wanted to pass along an unprofessional look at 5yr yields ahead of markets open this evening largely because there’s so much ‘talk’ about it — The Belly.
First up a LOG SCALED LOOK back TO 1965, via FRED — thanks, Fred — for some context …
… and it’s precisely here and now that a couple / few out there (MS, JPM) are out suggesting one BUYS the belly … 5s. And that’s terrific. I’ve no comment on them — good or bad — and tip my hat to any / all still in the game making these large calls.
There are so many macro FUNduhMENTALS going on at the same time with inflation clearly moderating.
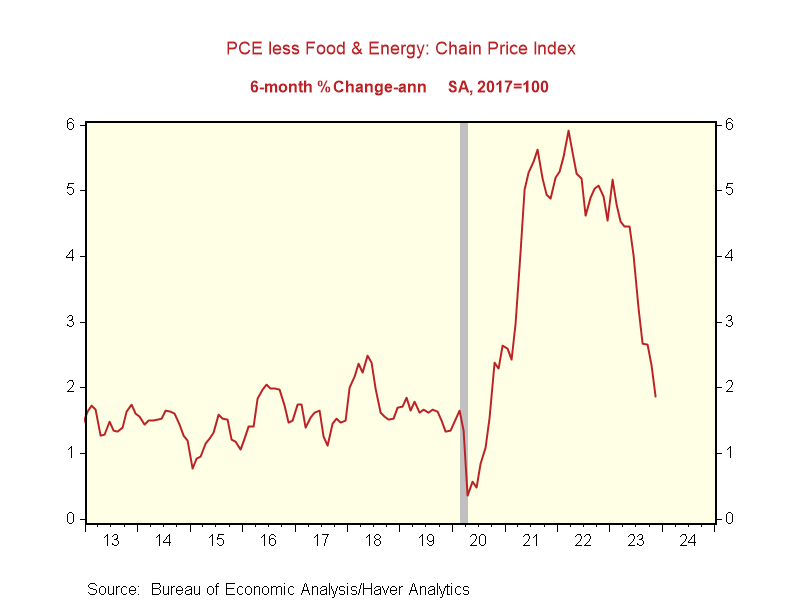
BMO noted / visualized 3mo, 6mo and 1yr annualized core PCE (HERE) while the Fed is currently working on QT. (QE is easing SO QT is, then the opposite OF QE, right — and so, fighting INflation which some would point to as moderating already) …
Clearly the Fed concerned with level of reserves in the banking system (March 2023 rang that bell?) and need to moderate QT might be something Fed uses as a way to satisfy those uber rate CUT doves playing for 6 rate CUTS this year?
2024 remains unclear and interesting because just as the Fed attempts to become less hawkish and Fedspeak / policy becomes more supportive — PCE moderating — you get an economy that seems to be NOT moderating as many / most forecast (ReSale Tales, UMICH?).
Fed and any / all in the game of rates forecasting and setting of policy, certainly have their work cut out for themselves.
Back TO The Belly — garnering much interest in the week just past and which lies ahead…
… and so, regardless of ones RATE CUT view and all dynamics running in the background, I’d say a daily chart of 5s (and what all every one else ‘out there’ saying / selling) does make 5s — The Belly — look attractive here and now or with more concession into the liquidity event (auction).
My partner / mentor and my dad constantly reminded me — keep your friends close and your STOPS closer … More as the week gets under way.
Now … AND in addition TO what Global Wall Street was saying / sellin’ — noted yesterday HERE (where I’d note BMO booked profits from long 10s and looking into 2s10s flattener despite ‘24 being The Year of the Steepening (again) … all while NWM staying BEARISH 10s and MS picking up duration (5s) ahead of this coming weeks 5yr auction!)
BNP Sunday Tea: To fade or not to fade? (message here is that FADE = BUY … in some way/shape/form)
KEY MESSAGES
After re-pricing higher of front-end yields in the eurozone and US, we recommend hedging risks of earlier or larger cuts.
In FX, we favour gradually adding to USD shorts, as risk premium is elevated, and valuations are supportive.
UK in focus: Following stronger inflation data, PMIs are set to garner market attention this week. We reiterate that GBP convexity appears cheap in FX vol.
… In rates, however, we see opportunities emerging after recent moves. We started the year cautioning against a back-up in yields, as the market had moved too far too fast. We noted 4.20% and 2.35% in UST 10y and bunds, respectively, as the levels above which we would consider longs – this view remains unchanged and we are neutral on duration (see DM Rates Strategy - Outlook 2024: Levels to long for, dated 10 January).
We are bullish on the front-end, however, and this week we added two trades consistent with that view in the eurozone on an outright basis and the US through a limited risk options structure (see EUR rates: Receive ECB April meeting, dated 16 January; and US rates: Hedging risks of earlier or larger cuts, dated 16 January).
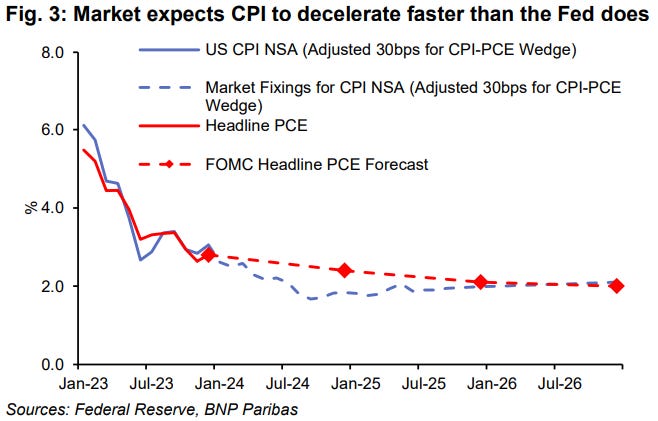
… As highlighted last week, core PCE looks poised to be annualized at or below the Fed’s target on a 3m and 6m basis at upcoming meetings. To the extent the Fed, in pursuit of a soft landing, conditions its decisions more heavily on the softer core PCE measure, we think the assessment should be supportive of breakevens at a point where the core CPI versus PCE wedge is wide by historic standards. We’ve added a 5y breakeven long to our trade idea portfolio on the view that the core PCE picture, coupled with relatively soft implied inflation for the next year, presents upside risks to traded inflation. Inflation longs are also a useful overlay to steepeners or outright received positions, in our view, as the market’s comparatively optimistic view on inflation normalization helps to explain the extent of cuts priced in the front-end (Fig.3).
…Treasuries Add duration exposure via 5-year notes
The front-end has remained relatively well anchored as the FOMC shifts focus from inflation to the restrictive stance of monetary policy, while the long end has been supported by stronger data and a sharp rise in market-based inflation expectations
With yields back at their highest levels since early-December, TIPS breakevens somewhat rich in our framework, and positioning more neutral, we are turning more constructive, and recommend adding duration in 5-year Treasuries
Despite the aggressive bear steepening recently, most long-end pairs remain too flat relative to the market’s Fed policy and inflation expectations, and the Fed’s share of the Treasury market, though this mispricing is much smaller than a month ago: maintain 5s/30s steepeners and 2s/5s flatteners
Foreign investors purchased $92bn long-term Treasuries in November, driven by large purchases from private investors. Investors domiciled in the Euro area and the UK represented the largest sources of net buying, while Chinese investors represented the largest source of net selling
… Against this backdrop, we are turning more constructive, for a number of reasons. First, yields have risen considerably from their late-2023 lows. Second, if TIPS breakevens narrow, this should support a bullish stance on nominal Treasuries. Third, the technical backdrop seems more favorable: our Treasury Client Survey index has retraced to average levels, and the share of neutrals has risen to the highest since May 2023, when the debt ceiling debate was at the forefront (Figure 17) Nearly 70% … This share is more than 1.5 standard deviations above its decade average, and could indicate relatively low conviction from our investor base given the combination of strong data and dovish Fedspeak. More broadly, a crosssection of position indicators reinforce this theme: Figure 18 shows 1-year z-scores for our favored positioning metrics, and most are very close to average levels, though it’s notable that CTA positioning has swung from long to short as long-end Treasuries have broken above key moving averages. Our macro hedge fund beta appears very long relative to it’s trailing 1-year average, underscoring the risk of further long liquidation, but we note that this indicator can turn relatively slowly, as it is based off a rolling 6-weeek regression. Given these factors, we recommend adding duration in 5-year Treasuries (see Trade recommendations).
MS: Sunday Start | What's Next in Global Macro: When in Doubt (precap of what he’ll say tomorrow in US Equity Weekly Warm Up …? THINK S&P EQUAL WEIGHT while everyone else distracted by ‘NEW ALL TIME HIGHS … )
… In our view, we remain in a late-cycle environment during which markets will oscillate between accelerating and decelerating growth narratives. The data continue to support this view, with both positive and negative data points materializing on the economy and earnings – a continuation of the crosscurrents we saw in 2023. However, as noted, asset prices are materially higher than three months ago, thanks mainly to the Fed’s transition from “higher for longer” to “we’re done hiking and likely to be easing in 2024.” In addition to the timing and pace of interest rate cuts, investors are also starting to ponder if and when the Fed will end its quantitative tightening (QT) campaign. Since embarking on this latest round of QT, the Fed’s balance sheet has shrunk by nearly US$1.5 trillion. However, it’s still about US$500 billion above the June 2020 levels which followed the ~US$3 trillion surge to offset the impact of Covid lockdowns. That the Fed’s balance sheet has normalized to desirable levels is debatable. Nevertheless, our economists and strategists think the Fed will begin to taper QT starting this summer (see Earlier Start, Slower Taper). More importantly, we think equity prices now largely reflect this shift and it remains to be seen whether it will lift the path of growth in and of itself…
… While lower-quality cyclicals outperformed during the final two months of 2023, we believe this was mainly driven by short-covering and performance-chasing into year-end rather than a more sustainable change in leadership based on a full reset in the cycle. So far in 2024 the laggards of 2023 are back to lagging and the winners are back to winning. When in doubt, it pays to go with the highest probability winner. In this case, it’s high-quality growth. We will explore this in more detail in tomorrow’s Weekly Warm-up.
… And from Global Wall TO us regular folks trying to play along at home here, a couple / few links which caught MY (former fixed income professional) eyes
Apollo: Upward Pressure on Goods Inflation (um … )
Normally, 200 ships travel through the Suez Canal from south to north over a week, but that number has recently declined to 100, see the first chart.
For the Panama Canal, northbound traffic has also declined 50%, from 90 ships per week to 45, see the second chart.
The third chart shows that the price of transporting a container from Shanghai to Rotterdam has tripled.
The bottom line is that higher transportation costs are putting upward pressure on goods inflation.
Source: Bloomberg, Apollo Chief Economist
Source: Bloomberg, Apollo Chief Economist
Source: BEA, Bloomberg, Apollo Chief Economist
Bloomberg: Five Charts Showing the S&P 500’s Wild Ride Back to Record Highs
Magnificent 7 tech companies lead stunning rebound from 2022
AI hopes, rate-cut bets help to keep momentum in stock market
Sam Ro from TKer: The long game remains undefeated (inflation coming down and economy seems to be growing — and more — all in all a great recap of what all is going on ‘out there’ making 2024 so funTERtaining — and difficult — to pre commit to any trade / investment / rate cut / hike trajectory!! … finally, check out excerpts / quotes from Druck, Pete Lynch and Buffet, to name a few…)
The stock market bottomed in October 2022, months before the Fed stopped hiking rates and even before it clearly signaled a dovish pivot in its approach to monetary policy — which makes sense when you remember the stock market is a discounting mechanism.
… High and rising interest rates don't spell doom for stocks Generally speaking, rising interest rates are not welcome news for the economy and the stock market. They represent higher financing costs for businesses and consumers. All other things being equal, rising rates represent a hindrance to growth. However, the world is complicated, and this narrative comes with a lot of nuance. One big counterintuitive piece to this narrative is that historically, stocks have actually performed well during periods of rising interest rates.
… Finally, if the economic calendars offered HERE YESTERDAY weren’t / aren’t enough …
The week ahead should be another good one for our "immaculate disinflation" scenario…
… December's personal income report (Fri) should show that consumers are still doing what they do best and that the PCED inflation rate continues to moderate. The core PCED less shelter measure of consumer prices rose 2.4% y/y during November. December's comparable readings for the CPI and PPI were lower at 2.2% and 2.0% (chart). Shelter has been slower to disinflate, but it has a smaller weight in the PCED than in the CPI.


Thanks.......