while we slept; "I’m so Bearish, I’m Bullish"; stocks vs bonds (hint stocks ALWAYS win the debate); curves / spreads in different inflation regimes; "Declining liquidity in the Treasury market"
Good morning … Was yesterday’s risk rally and bond market selloff enough of a ‘concession’ ahead of this afternoons 20yr auction?
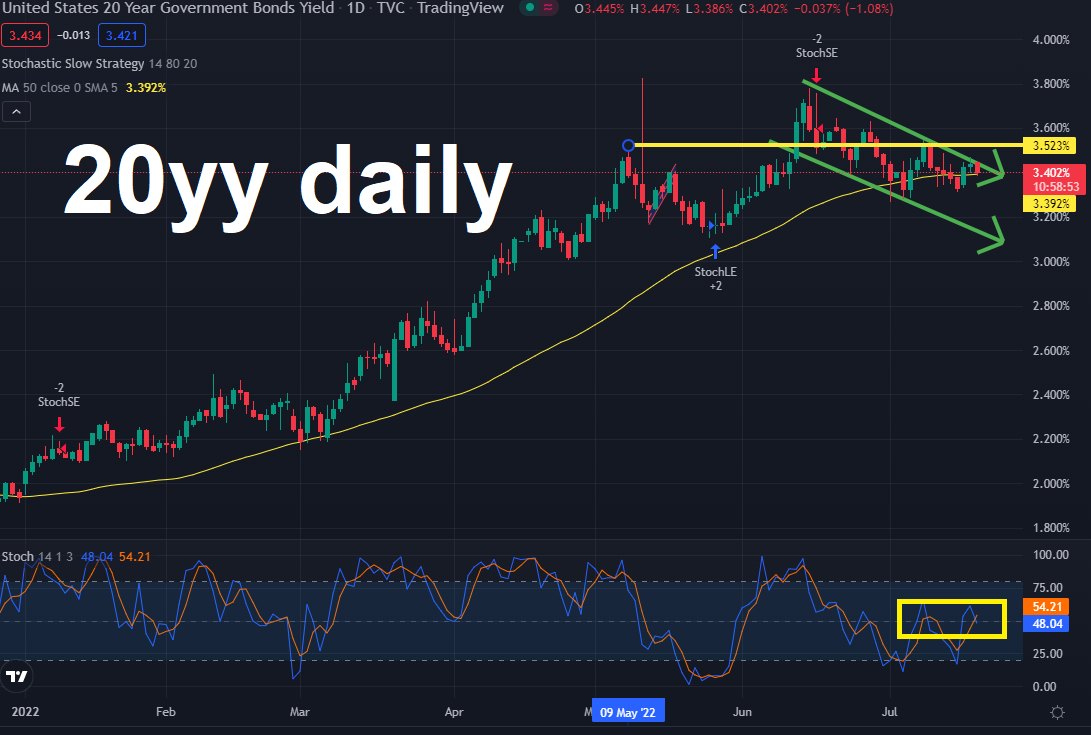
Yields have been in a marginal downtrend and momentum (yellow highlight - slow stochastics) would suggest to me that 20yy are neither rich OR cheap. Given the lack of (or DECLINING) liquidity which exists at the moment — yes it is typical of summer but continue reading for some research and visuals about the broader issue — I would not rule anything out. A bit more of a selloff here / now ahead of the auction could very well be viewed as concession rather than something much more nefarious at work. Just sayin’ …
… here is a snapshot OF USTs as of 728a:
… HEREis what another shop says be behind the price action, you know,
WHILE YOU SLEPT Treasuries are higher and the curve steeper ahead of a potentially consequential two days in Europe (ECB and Draghi decision). UK Gilts have notably out-performed this morning (despite an above-consensus print in headline CPI) amid summer-like conditions in rates markets. DXY is higher (+0.3%) while front WTI futures are lower (-1.3%). Asian stocks were paced higher by Japan's Nikkei (+2.67%), EU and UK share markets are modestly lower while ES futures are showing -0.15% here at 7am. Our overnight US rates flows saw listless activity in Asian hours with real$ selling of the long-end and buying of short paper noted. In London hours Treasuries caught a bid, 10's rallying 4bp as UK and EU markets spiked higher. Fast$ and CB bought intermediates along with bank interest in bills and short coups. Overnight Treasury volume was ~75% of average overall.
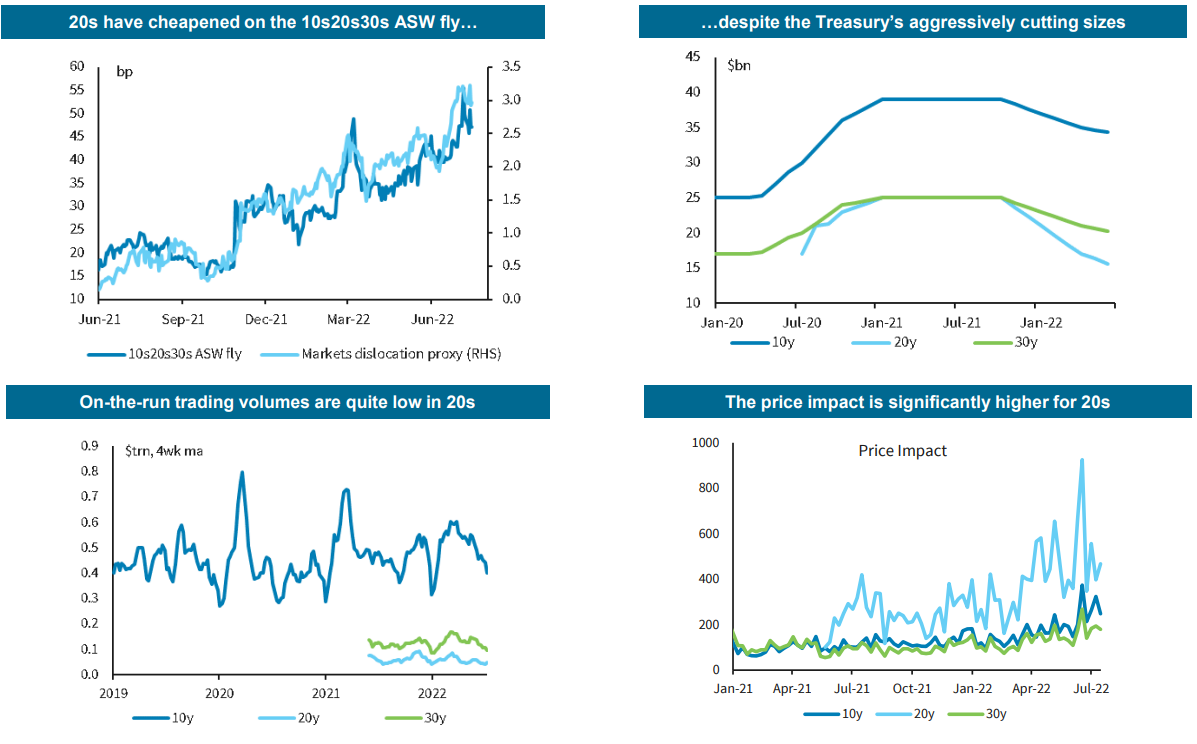
… Rangebound conditions, terrible liquidity (chart 3, compliments of RPM this morning) and less extreme positioning (chart 4, from RPM ) can do that we suppose. In this context, this afternoon's 20-year auction will be of interest given the 5bp of richening in 20yrs on curve (10s20s30s basis) since Monday's closing levels. Despite that richening, 20's will still likely go into this afternoon's auction at the cheapest levels on curve for an auction day since the series was first returned in May 2020. Our 5th attachment of the 10s20s30s 'fly highlights the cheapening trend for 20's on curve that has been in place since the spring . Mix a "dead" issue (client comment yesterday) and limited liquidity and anything can happen today? If there is some good news for 20yrs, their above average turnover in the past few trading sessions (238% of ave volume overnight) could be taken as a mild positive on the assumption that there may be a set- up for it? We'll see...
… and for some MORE of the news you can use » IGMs Press Picks for today (20 July) to help weed thru the noise (some of which can be found over here at Finviz).
As far as a few items (sellside observations, if you will) makin’ the rounds
BAMLs Global Fund Manager Survey SAYS:
I’m so Bearish, I’m Bullish
The Full Capitulation: July BofA Fund Manager Survey (FMS) shows dire level of investor pessimism…expectations for global growth & profits all-time lows, cash levels highest since “9/11”, equity allocation lowest since Lehman, BofA Bull & Bear Indicator remains “max bearish” 0; H2’22 fundamentals poor but sentiment says stocks/credit rally in coming weeks.
FMS on Macro: global growth expectations slump to net -79%, all-time low, recession anticipation highest since May’20 (Chart 1); everyone (net 76%) expects inflation to fall (great lead indicator for short rates – Chart 5) but mood still “stagflationary” & investors want corporates to shore up balance sheets (50%) not increase capex (29%) or buybacks (15%).
While this is quite interesting, leave it to John Authers / BBG to point out in his morning comment (‘Full Capitulation’ Could Mean Opportunity Knocking) this tidbit which again, not many seem to be caring about
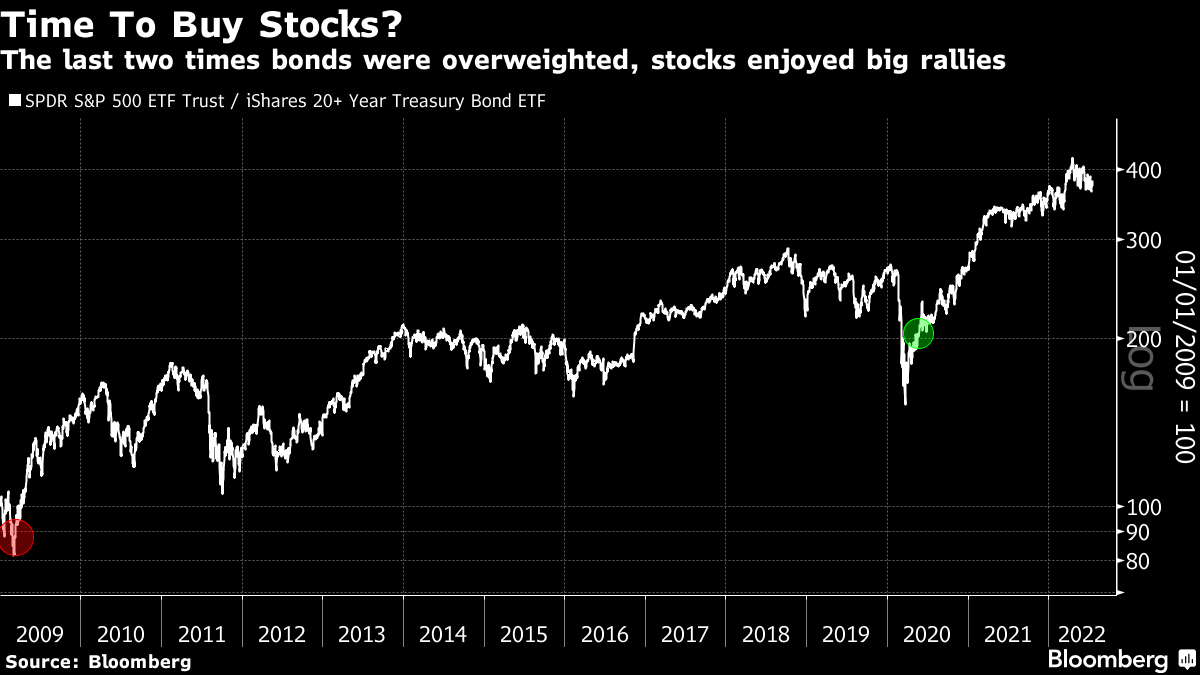
… It’s very unusual for big fund managers to be overweight in bonds relative to equities, and suggests deep negativity about the immediate outlook for the economy. And yet the latest edition of Bank of America Corp.’s monthly survey of global fund managers finds that they are now more underweight in stocks than bonds than at any time since March 2009, the month the stock market hit bottom after Lehman Brothers collapsed:
John continues
… At one level, this is awful. The people who deploy assets for the long term think it’s better to lend to the government (at what are still very low rates) than take a share in the profits of growing businesses.
At another level, opportunity might just be knocking. This is how stocks have performed compared to bonds (proxied by the SPY and TLT exchange-traded funds) since the beginning of 2009. The previous two times that the fund management community went overweight bonds — in the wake of the 2009 crisis, and during the first Covid lockdowns in 2020 — also turned out to be historically great times to go long in stocks.
ALWAYS and forever the TIME TO BUY STOCKS, right? Seriously, though, or not really, for more of the BAML note and even more snark, ZH
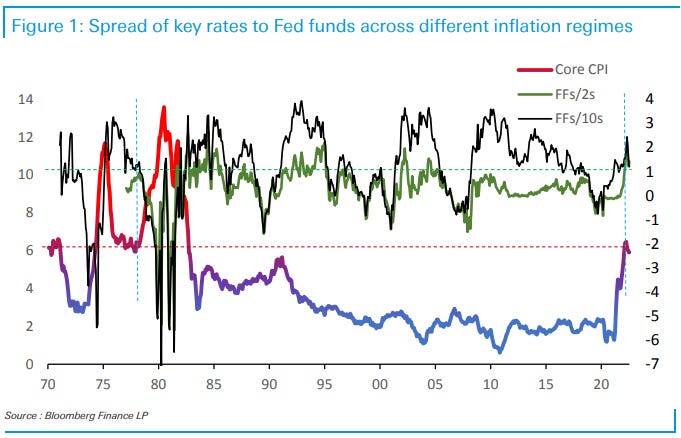
… For each 1% rise in core CPI, Fed would hike by more than 100bp – this was consistent across all three Fed chairmen during that decade. In contrast, since Mar-2021, Core CPI increased by 4.25% and we had only 150bp of rate hikes.
By those standards, the current Fed is way behind anything we saw in the Volcker’s decade. We do recognize that the 1970s cycle was taking place in a different environment and at much higher rate levels and so, to control for this difference, we look at spreads of different benchmark points to the Fed funds target (Figure). Current curve/inflation configuration is at the same point as it was in the early 1978. This means that different spreads, including 2s/10s slope, are roughly around the same levels where they were some 45 years ago. We highlight these two snapshots with vertical dashed lines.
What followed after Volcker’s appointment was an unprecedented pace of rate hikes and inversion of the term structure pushing 2s/10s beyond -100bp. At this constellation of risks, it is difficult to dismiss a further inversion trend of the curve, especially if inflation continues to rise. While the long end might resist upward pressures in anticipation of recessionary consequences of Fed’s hawkishness, the front end will have to submit to the forces of the inevitable. Even if these forces do not come to be realized, the market could easily front run the possibility of a continuation of the current trend.
With this in mind — the front end having to submit TO the forces of evil inflation and the Fed’s attempt to overcome — another issue facing the Fed (and Yellen’s Treasury) worth noting and keeping in mind. Liquidity (or the lack OF) is impaired in the summertime … A large British bank wrote / sent this one out mid-day yesterday (and I’ve excerpted a few charts of interest especially ones ahead of this afternoons 20yr auction)
US Treasuries: Declining liquidity in the Treasury market We look at measures of liquidity in the US Treasury market across three dimensions: 1) trading volumes across different security types, 2) transaction costs and price impact across tenors and 3) the liquidity risk premium demanded by investors. We find that there has been a worsening across all three.
Treasury trading volumes have declined in aggregate, particularly for longer-dated securities, off-the-runs and those between dealers and customers
…Turnover in cash Treasuries: A longer-term perspective
…20y sector has significantly cheapened on the curve, despite cuts in auction sizes, reflecting an increase in liquidity risk premium
With all of those CHARTS reflecting what looks to be a poor liquidity backdrop — more than just a regular summer doldrum — a few more from the CHARTS department via technical analysts at 1stBOS offering,
Key Technical Themes for the next 1-3 months
Finally, as summer doldrums continue to grip all markets and while declining liquidity may very well be ‘buried’ by that topical ‘lead’, here’s a graphic visual of how I feel about the lack of Treasury liquidity,