while we slept; goldilocks predicts goldilocks; doom and gloom predicted by stock-jockey; stocks vs bonds and will the REAL mortgage payment please sit down...
Good morning … SUMMER’S OVER. Kids back to school. A quiet start to the week (esp with renewed lockdowns in China) and the ECB meeting on Thursday. No better way to do this than to rip the band aid off and jump right in … here is a snapshot OF USTs as of 705a:
… HEREis what another shop says be behind the “Low Conviction Conditions”
… WHILE YOU SLEPT Treasuries are lower but off their earlier lows as German bunds strongly outperform (2y Germany -12bp lower). DXY is higher (+0.25%) while front WTI futures are modestly lower (-0.5%). Asian stocks were mixed (SHCOMP +1.36% though), EU and UK share markets are modestly higher while ES futures are showing +0.7% here at 7am. Our overnight US rates flows saw Treasuries play catch-up during Asian hours to global bond weakness yesterday. We saw selling of the front end to buy intermediates with the net DV01's showing overall better buying. In swaps, better paying in intermediates out of Asia was noted. Our London AM session was quite active with CB's buying the front end again. In the long-end, EU banks bought the 20y sector on ASW with 2-way activity seen in long P's. Overnight Treasury volume was about average overall with the highest relative average turnover overnight seen in 30yrs (124%)...
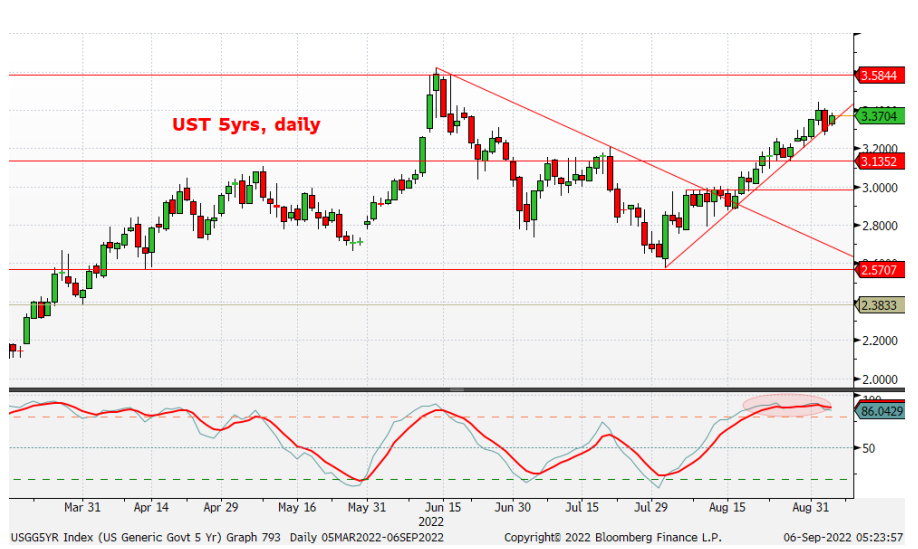
…Treasury 5yrs: Still locally oversold and still above their bear trendline this morning. Key support begins near 3.58%. Do have a look at the price action in 5yrs in the first half of August. 5's traced out another right triangle (as described for 2y spreads just above), ultimately taking out the support just under 3.00%, leading to where 5's are now...
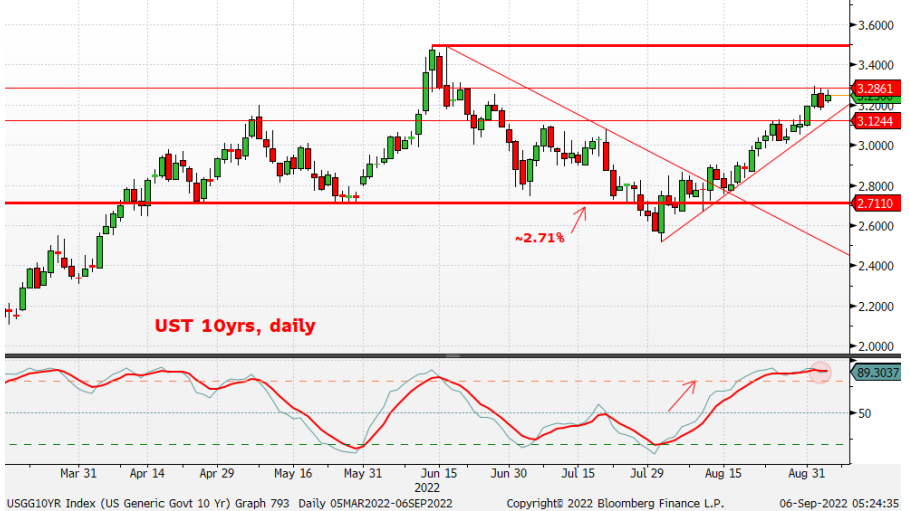
UST 10yrs: Some local support has emerged near 3.285%, best support presumably near 3.50%. Same story with 10's as with 5's: still in grips of bear trendline, still oversold. More range, it seems.
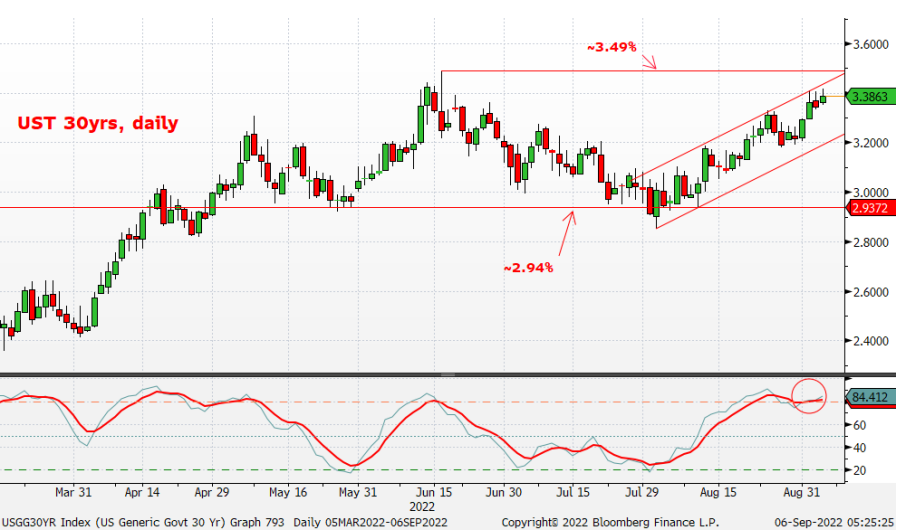
Treasury 30yrs: We've spotted the macro range as 2.94% to 3.49%. 30yrs also tactically 'oversold' and rates still biased upward and in the channel in place since the end of July. Not much more to say than that.
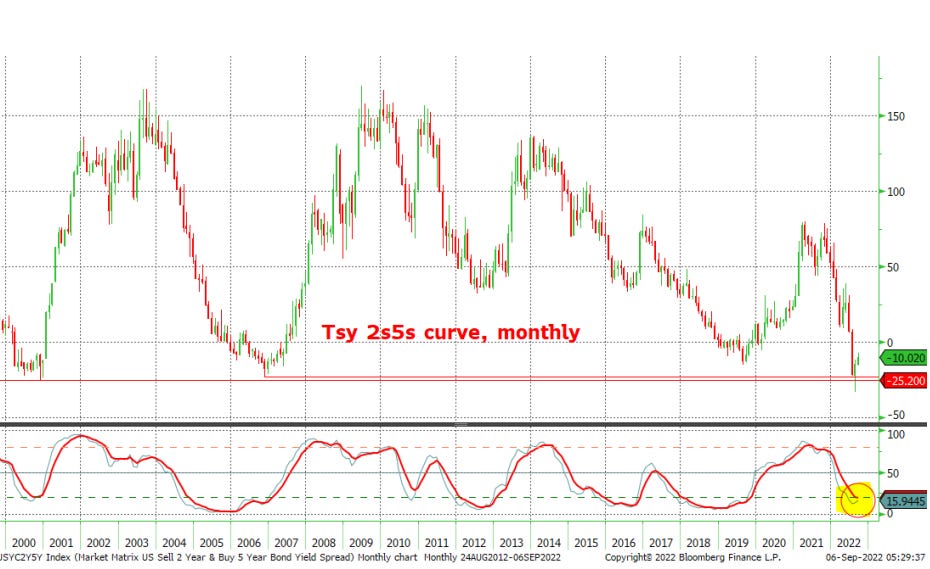
Treasury 2s5s curve, monthly: This curve's 2006 and 2000 cycle lows generally holding as a support zone despite a brief trip below 2000's low last month. This curve is long-term 'oversold' but there is scant evidence yet of a threat of a macro trend reversal steeper.
… and for some MORE of the news you can use » IGMs Press Picks for today (6 Sep) to help weed thru the noise (some of which can be found over here at Finviz).
In addition TO what Global Wall St noted HEREthis past weekend, a few additional items to consider and which may help as you plan your trades and trade your plans.
In short, gas supplies still quite front and center along with more lockdowns in China, goldilocks econ conditions will arrive (ie a pleasant slowdown not crashing recession (?)) and stocks, well, are headed lower…
Barclays
Global Macro Thoughts: European gas supply falls, China lockdowns rise Europe’s natural gas problems have worsened, as have China’s new lockdowns. But the US saw a Goldilocks jobs report, and could see a second mild core CPI print. After being bearish last week, and for much of 2022, we turn tactically neutral on risk.
Goldilocks’ latest, well, view of a goldilocks economy,
Since the FOMC started hiking the funds rate early this year, we have argued that the US economy can achieve a soft landing, even though the path is narrow. It requires sustained below-trend output growth, a rebalancing of the labor market via sharply lower job openings but only a moderate rise in unemployment, and a large decline in inflation. While much can still go wrong and our probability that a (mild) recession will start in the next year remains about one in three, we see some encouraging signs that the economy is moving toward all three of these goals.
MSs stock-jockey,
Fire and Ice Part 2 Is More About the Ice; Cutting Our EPS Forecasts Further 1H22 was challenging for most risk assets as the Fed pivoted more sharply than most expected. The de-rating for US stocks was punctuated by a brief growth scare in June, although valuations never reflected the true risk to earnings, in our view. Today, we quantify that risk and cut EPS forecasts.
Fire and Ice Part 2… Fire and Ice has proven to be an effective way to describe the first half of this year. Fed tightening in response to historically high inflation, the Fire, has weighed heavily on valuations for all asset markets. Meanwhile, growth has also disappointed...the Ice. While this combination proved challenging for most stocks, we think part 2 will turn out to be more Icy than Fiery as slowing growth becomes the bigger concern for stocks, rather than inflation and the Fed.
The Path from Here… while acknowledging the poor performance in equities year-to-date, we do not think the bear market is over if our earnings forecasts are correct. More specifically, we think the lows for this bear market will likely arrive in the fourth quarter with 3,400 the minimum downside and 3,000 the low if a recession arrives (in line with our well established base and bear case tactical views, respectively). From there, we think prices will recover to our base (3,900) or bear (3,350) case June 2023 targets. In the very near term, if back end rates fall, stocks may hold up or even rally until later this month when QT potentially increases and earnings estimates are likely revised lower.
We Make Downward Revisions to Our Earnings Forecasts... our leading models point to continued and increasingly significant EPS growth downside well into 2023. Specifically, we revise our 2022 base case EPS estimate to $220 from $225, our 2023 base case estimate to $212 from $236, and our 2024 base case estimate to $226 from $237. Our '22/'23/'24 base case estimates are now 3%/13%/14% below consensus, respectively. In our base case, 2023 now marks a modest earnings contraction (-3% year-over-year growth), though we do not embed an economic recession in this scenario. The logic here is that nominal top line growth slows, but remains positive (mid-single-digit territory), while margins contract materially (1-1.5% margin compression) driven by sticky cost pressures, particularly on the labor side…
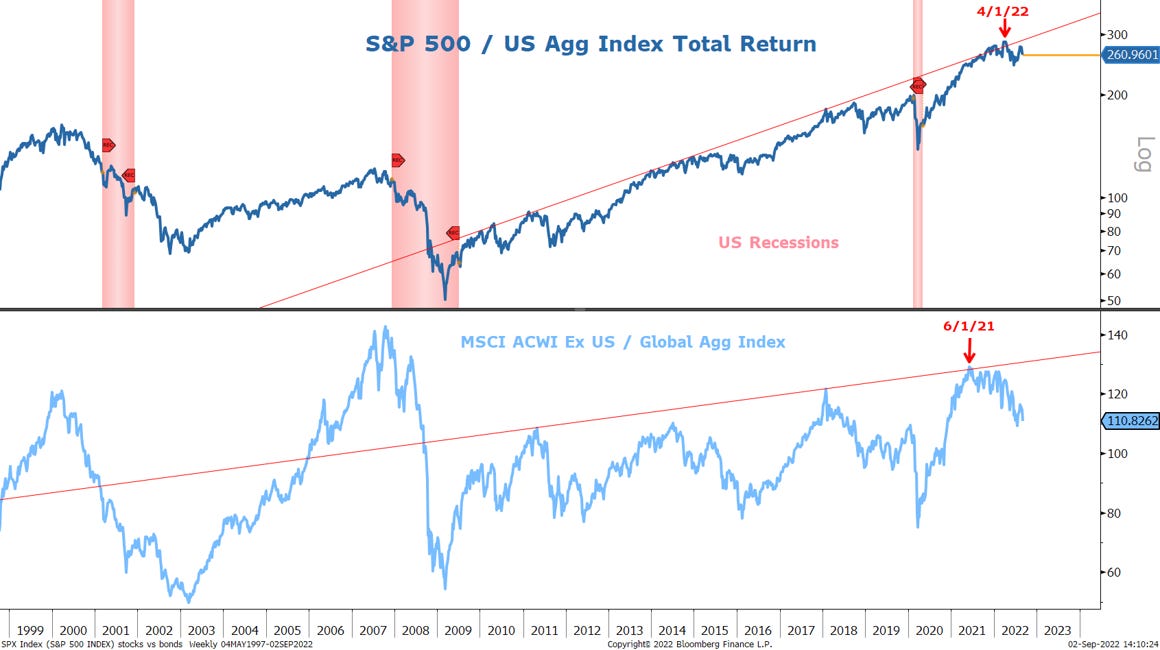
… As bad as it’s been for stocks, it’s been even worse for bonds on a risk-adjusted basis. More specifically, 20-year Treasury bonds are down 24% YTD and the Barclay’s Agg. Index is off by 11%. Finally, commodities have been a mixed bag, too, with most commodities down on the year despite heightened inflationary concerns. To wit, the CRB RIND index, which measures the spot prices of a wide range of commodities, is down 7% YTD. Cash, on the other hand, is no longer trash, especially if one has taken advantage of the higher front-end rates. Interestingly, most of the damage for bonds was front end loaded as the Fed made its pivot clear in January. We turned more positive on bonds versus stocks back in April. Since then, bonds have outperformed modestly but appear poised to see further outperformance technically and fundamentally if the second half brings more concern about growth rather than inflation as we expect. Outside the US, the picture is even clearer with bonds having outperformed stocks since June of 2021 with the global economy in far worse shape than the US.
Exhibit 3: Bonds Have Modestly Outperformed Stocks Since April but Appear Poised for More Relative Outperformance
In our view, asset markets are behaving right in line with the fire and ice narrative we laid out a year ago. In short, after ignoring the warning signs from inflation last year, and thinking the Fed would continue to ignore them too, asset markets quickly woke up and discounted the Fed’s late but historically hawkish pivot to address it…
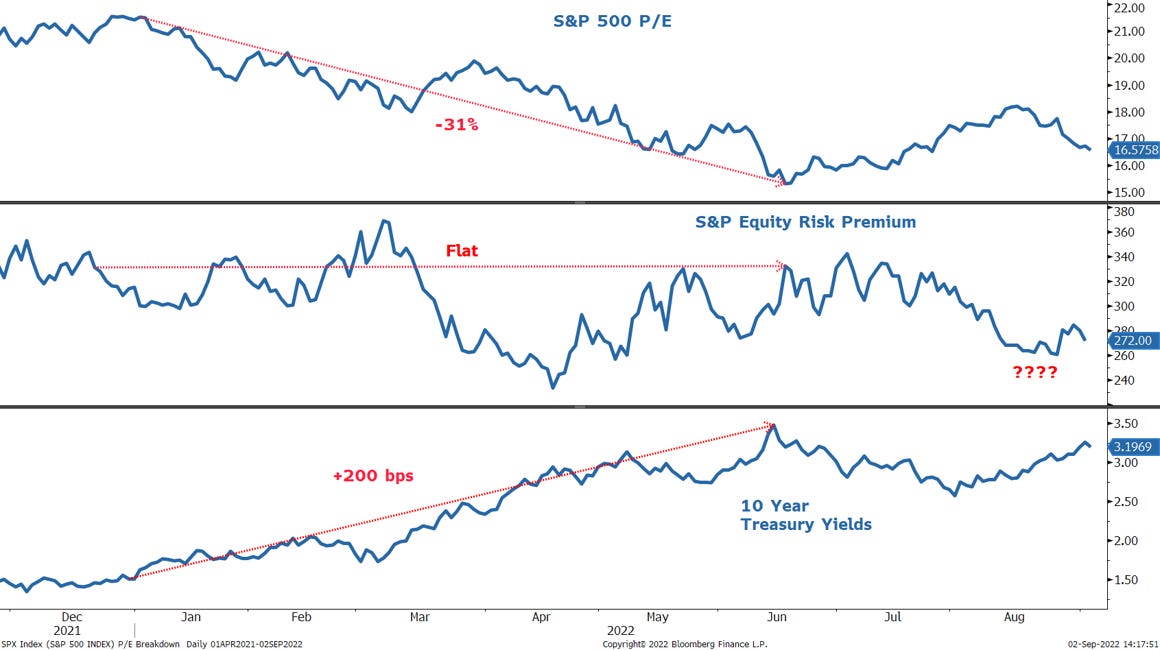
…While the June low for stocks and bonds was dramatic, we’ve consistently been in the camp that it wasn’t THE low for the S&P 500 in this bear market. Having said that, we are more confident it was the low for long-term Treasuries for this cyclical bear market in view of the Fed’s aggressive action that has yet to fully play out in the real economy. It may also have been the low for the average stock, given how poor the breadth was at that time, and the magnitude of the decline in certain stocks. Our more pessimistic view on the S&P 500 index is based on analysis that indicates all of the 30% de-rating in the forward S&P 500 P/E that occurred from December to June was due to higher rates. We know this because the equity risk premium (ERP) was flat during this period (Exhibit 4). Meanwhile, forward NTM EPS estimates for the S&P 500 have come down by only ~1.5% and P/Es are now ~8% higher. With rates now ~30bp below the June highs, the ERP has fallen once again, to just ~285bp. This makes little sense, particularly given the significant slowdown in earnings we think is still to come.
Exhibit 4: All of the P/E De-rating this Year Has Been Due to Higher Rates Not Growth Fears
For somewhat more on stocks vs bonds, Chart of the Day
Today’s chart answers that question by presenting the total return trend for both the S&P 500 and S&P U.S. Treasury Bond 20+ Year Total Return Index.
Today’s chart illustrates that, so far this century, U.S. T-bonds (orange line) have gained nearly as much as stocks (blue line) but with much less volatility.
Since 2009, however, stocks have outperformed.
Of note… T-bonds are currently in an inflation-induced bear market that is significantly greater than any previous correction this century.
Finally, from the nothing-without-consequence department, via Macro Alf
@MacroAlf The real mortgage payment on the median US house is now 10% higher than in 2007. Adjusting for the increase in median real wages since then (8-10% cumulative), in valuation terms the US housing market is exactly where it was in early 2007.