while WE slept: "fixed in the red"; 2s testing key support (CitiFX); "buyer strike on US assets continues" (DB); NAZ (not a)bubble indicator (DataTrek); USTs longs build & Hindsight Cap (BBG)
Good morning … Equity futures inch higher, Oil and bond YIELDS too …
Speaking of yields, we’ll now enter that period of the program where we wait for today’s ADP and tomorrows NFP before The Hampton Hedge gets fully deployed AND at the same time, waiting as patiently as possible for latest read from Dr. Lacy Hunt.
In advance of THAT, a quick updated visual as we sit right smack dab in the middle of the Rosie Range …
10yy DAILY: 4.25% is 50% of the 5.00 - 3.50 range … above 4.30% and …
… we’re likely to back and fill a bit … AND as we grind just North of this ‘middle’ I’d ALSO NOTE DAILY momentum (stochastics) overBOUGHT, cross and heading higher suggesting … dipORtunity ahead …
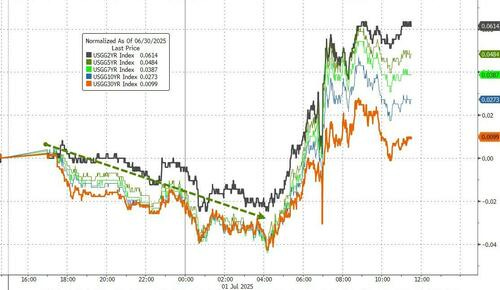
…Treasury yields soared today after some overnight buying. Rates started to rise on Powell's comments and then surged higher on the ISM/PMI beat (seemingly ignoring the construction data's dismal print). The long-end underperformed...
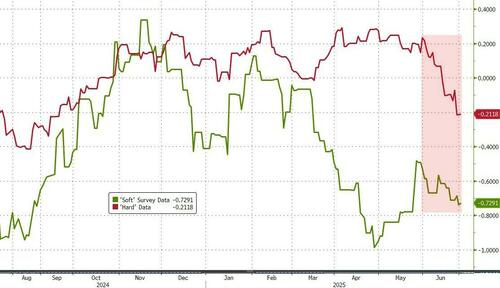
Meanwhile, as Bloomberg's Simon White noted today:
The wait might soon be over for President Donald Trump.
Federal Reserve Chair Jerome Powell has the cover to reduce rates as most of the soft, ie market and survey based, data has become sufficiently stressed, with Powell today indicating he would be open to a rate reduction as early as July.
The Fed historically first eases policy not when the hard data weakens – by then it’s often too late to stave off a recession – but when stressed soft data tells it to.
The Fed aims to nip a downturn in the bud by responding to weaker soft data. Whether stocks remain supported at current lofty valuations will depend on when and by how much policy is loosened.
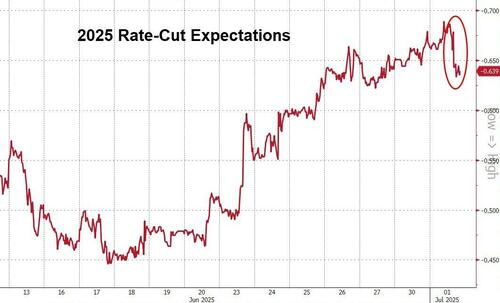
Rate-cut expectations dropped today also...
… and worth noting some of the good news helping stonks was also the bad news, at least in the form of the data …
ZH: Manufacturing Surveys Soared In June... But So Did Prices
ZH: Labor Market Rebounds As Job Openings Unexpectedly Soar
… AND I’ll be done here and move along TO the reason many / most are here (a read through of the Global Wall inbox) but first … here is a snapshot OF USTs as of 705a:
… for somewhat MORE of the news you might be able to use … a few more curated links for your dining and dancing pleasure …
NEWSQUAWK US Market Open: RTY outperforms, USD attempting to rebound with focus on the House and tier-1 data … Fixed in the red, Gilts lag after the UK Welfare Reform u-turn. USTs await data and fiscal updates … USTs also lower, though to a slightly lesser degree than the above peers. Holding at the low-end of a 111-20+ to 111-30+ band. A tick below Tuesday’s base and notching a fresh WTD low by half a tick. If the move continues, there is a bit of a gap until 110-25 from the week before.
The monthly ADP private payrolls report is due later in the day and, based on a survey of economists by Reuters, is expected to have risen by 95,000 in June, up from May's three-year low of 37,000, but below June 2024's 150,000 rise.
The ADP report usually lands two days before the more comprehensive monthly non-farm payrolls report and, although there is no correlation between the two, investors inevitably use ADP as some form of steer on what to expect from the upcoming government report.
Since hitting a COVID-era peak of 807,000 in late 2021, private sector payrolls growth has been moderating…
Finviz (for everything else I might have overlooked …)
Moving from some of the news to some of THE VIEWS you might be able to use… here’s some of what Global Wall St is sayin’ …
Construction continues in decline … leading / canary in the coalmine OR was it all more a top-line head-fake …?
1 July 2025 Barclays: May construction spending: Continuing to decline
Construction spending fell 0.3% m/m sa in May, driven by weakness in private spending. This comes alongside an upward revision to April that shows that spending was stronger than initially thought in the first month of Q2. These data raise our Q2 GDP tracker by 0.1pp.
… same shop with read thru on labor / demand …
1 July 2025 Barclays: May JOLTS: Labor demand hanging in there
Job openings increased to 7.8mn in May from 7.4mn in April, a second-consecutive monthly gain following an earlier dip. This came alongside similar turnover to April, with a slight weakening in hiring and roughly steady separations, as stronger quits offset a decline in layoffs and discharges.
… AND a note on mfg with a tariff impact …
1 July 2025
Barclays: ISM manufacturing: Adverse tariff fallout continues
May's ISM manufacturing estimates continue to point to weakness in the factory sector, with the PMI firming somewhat on mixed readings across major components. Today's estimates continue to point to intensifying cost pressures, which we expect to feed through to goods prices in the coming months.
… a few words from the best in the biz … on the data AND on how the dust settled …
July 1, 2025 BMO: ISM Manufacturing Mixed; JOLTS Unexpectedly Jumps to 6-Month High; UST Cheapen
ISM Manufacturing improved to 49.0 in June vs. 48.8 surveyed and 48.5 prior. Within the details of the report, the observation was made that, “In June, U.S. manufacturing activity slowed its rate of contraction, with improvements in inventories and production the biggest factors in the 0.5 percentage point gain in the Manufacturing PMI." Despite the rise in the headline measure, new orders unexpectedly declined to a 3-month low of 46.4 from 47.6 in May. Discouragingly for the looming payrolls report, the employment measure unexpectedly fell to a 3-month low of 45.0 vs. 47.1 surveyed and 46.8 prior. Prices Paid rose to 69.7 vs. 69.5 predicted and 69.4 prior. On net, there were several pockets of weakness that offset the improvement in headline sentiment.
On the employment side, JOLTS Job Openings unexpectedly increased to a six-month high 7769k in May vs. 7300k surveyed and 7391k in April. This brought the job/jobless ratio to 1.07 vs. 1.03 prior – the highest since January. The Quits Rate ticked up to 2.1% from 2.0%. The Hiring Rate decreased to 3.4% from 3.5%. The Layoffs Rate declined to 1.0% from 1.1%. All three components printed well-within their respective recent ranges. For context, since the beginning of 2024, the Quits Rate has oscillated within a 0.3 ppt range (1.9%-2.2%), the Hiring Rate within a 0.4 ppt range (3.2%-3.6%), and Layoffs Rate within a 0.3 ppt range (0.9%-1.2%)…
… Treasuries sold off on Tuesday as an unexpected jump in US job openings helped calm employment jitters. JOLTS climbed by 374,000 to 7.77 million, exceeding all estimates in the BBG survey and marking the highest level of job vacancies since November 2024. ISM Manufacturing improved a bit more than expected, although the sector remains in contraction and the major subcomponents offered a dimmer take on the economic outlook. Discouragingly for the looming payrolls report, the employment measure unexpectedly slipped by 1.8 points to 45.0 and the observation was made that, “For every comment on hiring, there were 3.2 on reducing head counts — one of the widest ratios since ISM began tracking employment comments — reflecting companies’ continuing focus on accelerating staff reductions due to uncertain near- to mid-term demand.” While a mixed set of details belied today’s improvement in JOLTS and ISM Manufacturing, the crosscurrents ultimately resolved bearishly in a move that was led by the front-end while duration outperformed.
Notably, near-term rate cut pricing was trimmed despite Powell’s openness to a July rate cut when speaking at the ECB central bank forum. When asked about the potential for a rate cut this month, Powell said, “I really can’t say. It’s going to depend on the data. And we are going meeting by meeting.” The Fed Chief added, “I wouldn’t take any meeting off the table or put it directly on the table. It’s going to depend on how the data evolve.” The Powell-induced bid for the front-end was ultimately overshadowed by the economic data as the market-implied odds of a rate cut on July 30th slipped back to 20% and 2025 cut pricing retreated below 65 bp. Powell reiterated that the Fed is expecting higher inflation readings over the summer months, but added that the impact could be “higher or lower, or later or sooner” than expected…
…After momentarily slipping below 3.70% in the morning, 2-year yields rose as high as 3.785% on Tuesday in a move that backfilled the June 26th opening gap that was linked to reports that Trump was considering an early nomination for Powell’s replacement. While 2-year notes are overbought on the daily chart, stochastics have begun to curl and a cross would leave ample room for a bearish retracement to extend in the near-term. The first technical hurdle in the path toward higher 2-year rates comes in at an opening gap from last Wednesday at 3.816% to 3.825%. Conversely, resistance comes in at 3.695%, a level that will likely define the bottom of the pre-NFP range barring a significant disappointment in tomorrow’s ADP report.
Interrupting this regularly scheduled funDUHmental recap / victory-lap-A-thon for some CHARTS …
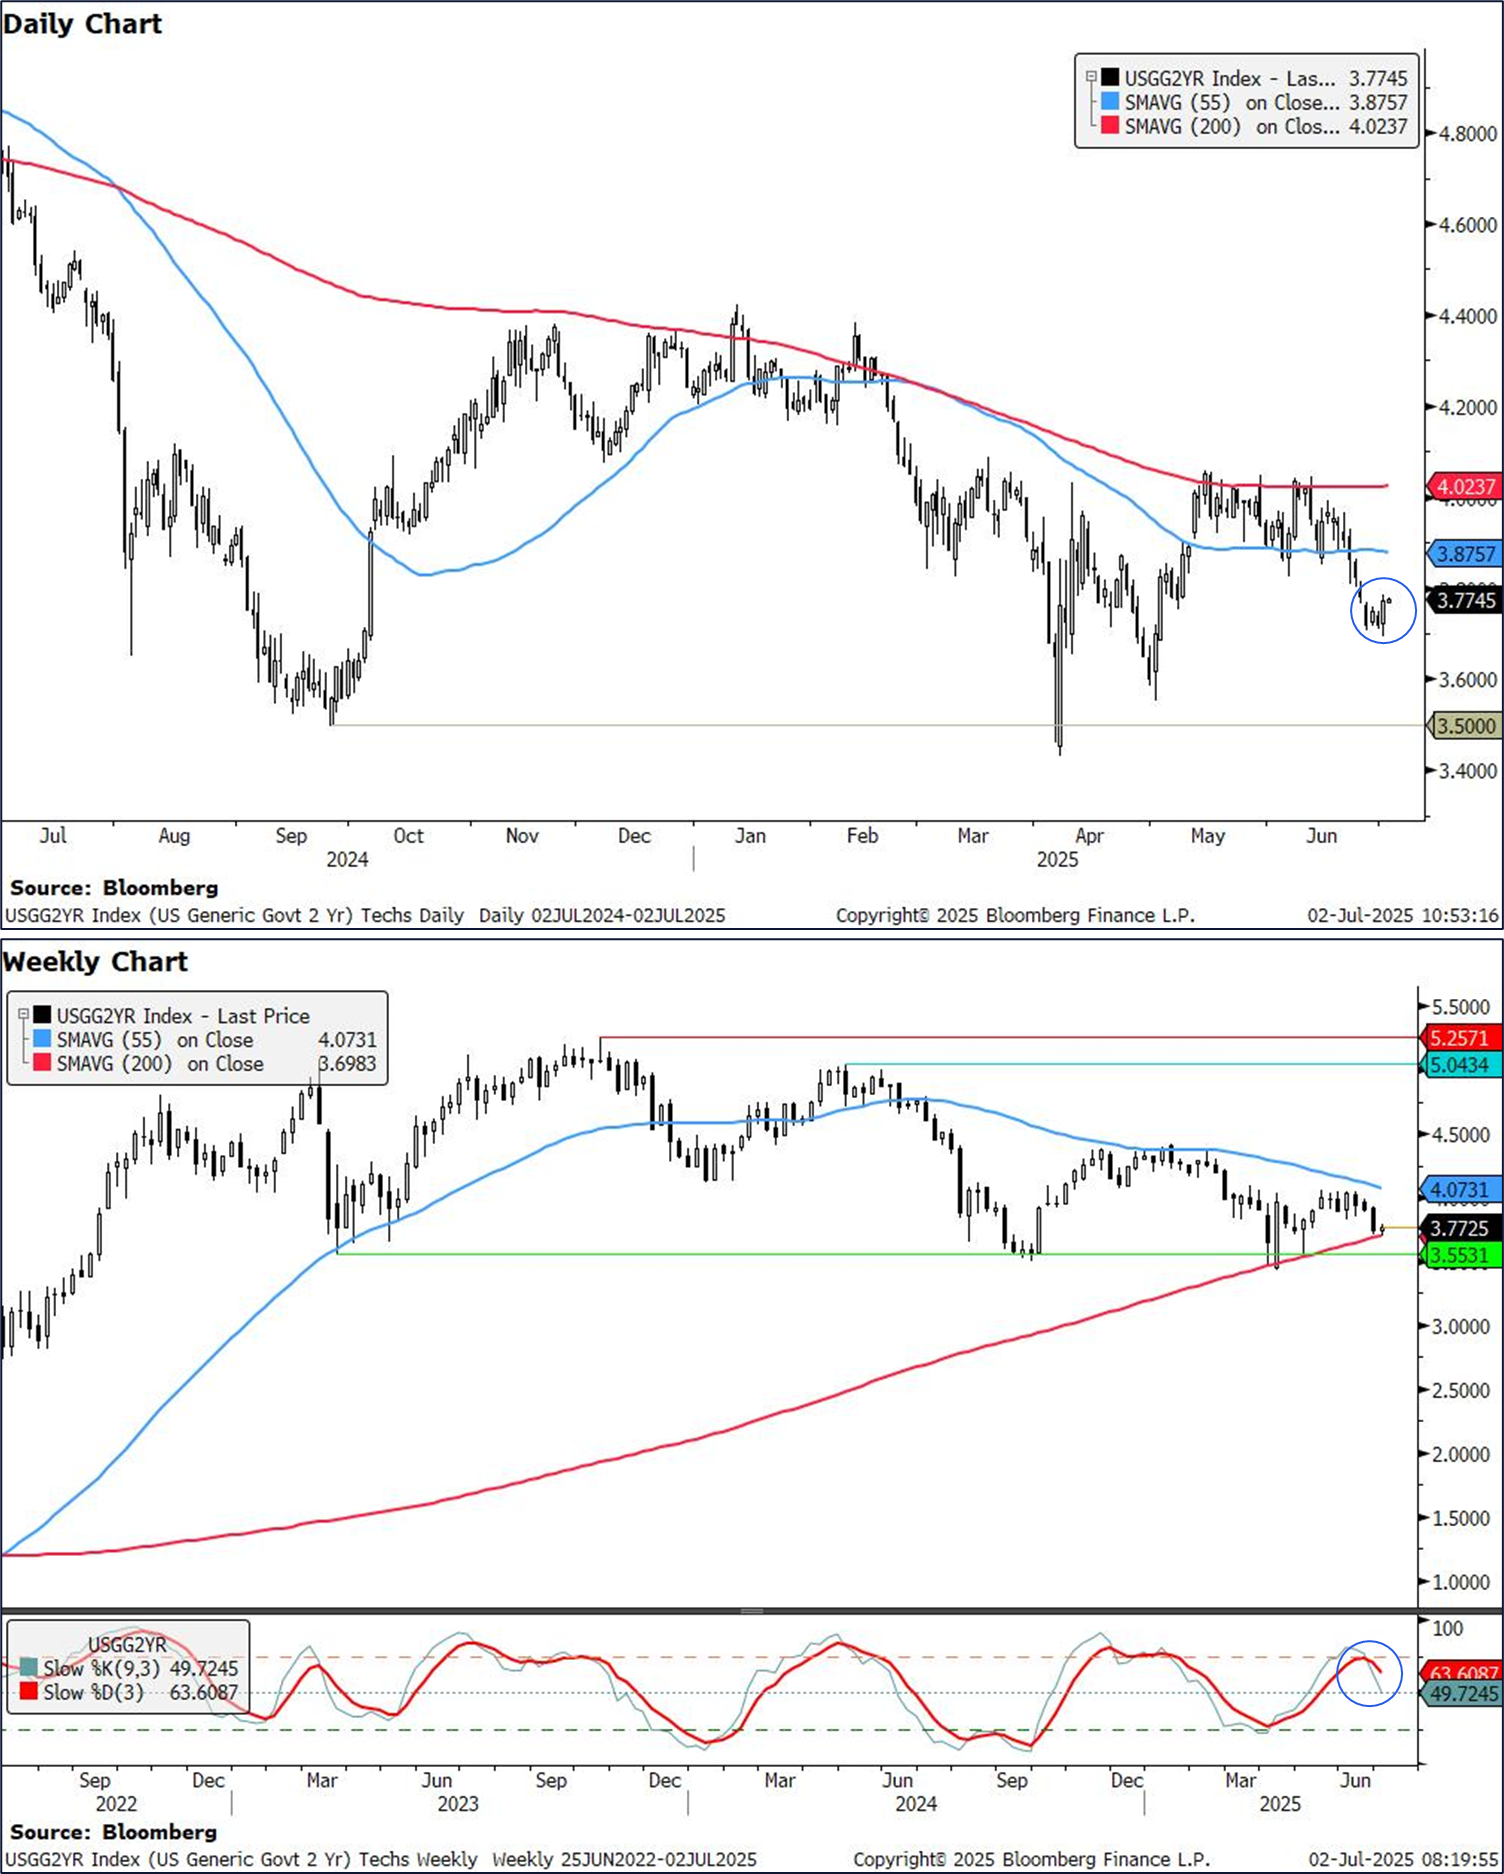
We take a look at levels to watch in US yields ahead of NFP later in the week. 2y yields are testing key support levels, and have posted an engulfing daily candlestick, suggesting we could see a short term move higher in yields. 10y and 30y yields look to continue their gradual moves lower.
US 2y yields
2y yields are testing the 200w MA of 3.70%, a key level which has held on 3 occasions this year. On top of that, markets posted an engulfing candlestick in the daily chart, which is an indicator that yields could see an uptick in the near term.
Between the candlestick formation and the strong support level at 3.70%, we think there is a reasonable case that yields could see a modest uptick, with clear resistance at 3.88% (55d MA). In the macro space, markets are pricing in about 2.5 cuts by the Fed by year end vs our economists’ expectations of three. Markets are pricing in ~20% chance of a 25bps cut in July, which seems fair to our traders and strategist at this stage. With Powell still keeping to his 'wait and see' messaging however, we could see a pullback in pricing at this stage, though we think a large move higher in 2y yields is unlikely to sustain.
A weak NFP print and further dovishness from the FOMC would be the main risk. A weekly break below 3.70% will be very technically significant since we have not been below the 200w MA since 2022. This would also be further supported by weekly slow stochastics Subsequent support is seen at 3.43%-3.5%, (April low, psychological level).
Source: Citi, Bloomberg
…30y yields
We have established a very clear short term downtrend since breaking above the 5% level in late May. Since then, we have closed weekly below the 55d MA at 4.86% while weekly momentum is also ticking lower. We think this move is likely to continue towards very strong support at the 4.57%-4.64% region (55w MA, April 30 low, and 200d MA). Resistance is likely at the 55d MA of 4.86%, followed by 5.0%
Source: Citi, Bloomberg
…Thank YOU, fan favored DB stratEgerist … no, no, thank YOU … on second thought, don’t thank anyone, just go out and BUY something with USD, will ya…
Why is the dollar collapsing? Every day there is a different narrative. We wrote last week that rising pressure on the Fed to be dovish (we dubbed it the "Pennsylvania Plan") as well as the massively front-loaded German fiscal announcements are helping dollar weakness. Leaving all this aside however, there is one important backdrop: foreigners are no longer buying enough dollar assets to finance America's huge current account deficit. Below we present a few charts using freshly released data to illustrate the point.
The buyer strike on US assets continues. Some have pointed to the April TIC data release as showing that the de-dollarization theme is exaggerated. Looking for evidence of dollar asset liquidation misses the point however: foreigners don't need to sell US assets to weaken the dollar but merely to say "no thank you" to buying more. This continues to be the message of the various high-frequency dollar flow metrics we have. Our ETF data have been pointing to a buyers' strike for a while. The alternative EPFR database which include a broader range of funds gives the same message: there is close to zero buying of US bonds (chart 1) and equities (chart 2) from foreign-domiciled funds over the last few months. US equities may well be rallying due to domestic buying, but foreigners just aren't interested…
… another fan favored stratEgerist from same shop on JOLTS …
… One of the most important developments of the last 24 hours was the latest JOLTS report of job openings in the US, which pointed to a tighter labour market than previously thought. On one level, it demonstrated continued resilience and strong labour demand, but investors responded by lowering the likelihood of rate cuts this year, which led to a small spike in Treasury yields across the curve. So the 10yr Treasury yield (+1.4bps) ultimately pared back its early decline (4.185% at the lows) and moved back up to 4.24% after getting as high as 4.275% as London went home. The 2yr yield (+5.3bps) moved up to 3.77% from a low of 3.696% before the data.
In more detail, the JOLTS report showed job openings were up to a 6-month high of 7.769m in May (vs. 7.3m expected). So that pushed back against the narrative of a softening labour market, and it raised the ratio of vacancies per unemployed individuals to 1.07. Moreover, the details pointed in a similar direction, with the quits rate of those voluntarily leaving their jobs back up to 2.1%. So collectively, that countered the dovish trend of recent days, where Fed cuts were looking increasingly likely, particularly after a few speakers floated the idea of a cut as soon as the next meeting in July. But with that JOLTS report, investors dialled back the likelihood of aggressive cuts, with the amount priced in by the December meeting down -2.2bps on the day to 64bps. Admittedly, there was some other data yesterday, including the ISM manufacturing. But the numbers were broadly as expected, with the headline index at 49.0 (vs. 48.8 expected), so they didn’t really shift investors’ perception of the outlook…
… same shop suggesting Fed rate is where it should ought to be …
As President Trump continues to pressure the Fed to lower rates, today’s chart looks at the FOMC’s recent SEP projection for the year-end fed funds rate. Specifically, we compare the median dot to prescriptions from monetary policy rules conditional on the Committee’s median economic projections.
The policy rules are those described in the Fed’s Monetary Policy Report: Taylor (1993), balanced-approach, balanced-approach (shortfalls), and first-difference rules. (We leave off the rule that adjusts for ELB constraints given its irrelevance today.) Each prescription uses median SEP projections of current-year unemployment and inflation, and longer-run unemployment and fed funds rates.
Over recent years, the median current-year dot has often deviated significantly from the rule prescriptions. We have interpreted those deviations as largely reflecting views on the gap between short and long-run r-star, particularly as assessments on neutral rates have shifted significantly.
But the main takeaway for today is that policy is remarkably well-aligned with rules given the Committee’s economic outlook. As Powell and others on the FOMC have put it, policy is currently well positioned. Of course, the Fed’s inflation outlook could prove wrong, or, even if correct, tariff-driven inflation could be transitory and warrant looking through. But big picture, it is simply not the case that Fed policy is clearly on the wrong path.
This next note from Nick Colas and Co caught my eye … esp for the visual of NAZ returns…
July 1, 2025 DataTrek: Nasdaq Bubble Indicator
With the Nasdaq Composite near record highs, today we’re going to answer 2 questions:
What’s a reasonable return expectation for the Nasdaq Comp in 2H 2025 after two straight years of strong rallies (price returns of 43/29 percent in 2023/2024) and a 4.6 percent gain YTD?
How will we know when US large cap Tech is in a bubble?
…Moving on now to answering our second question, we continue to use this simple rule of thumb to identify unsustainably high prices: “A double is a bubble”. The chart below shows the Nasdaq Comp’s rolling 1-year returns since the early 1970s.
Comment: The Nasdaq Comp doubling in a year is a reliable sign of a dangerous and unsustainable bubble-like rally. Macro conditions are never different enough for asset prices to rise 100 percent over short periods of time. Markets are also fairly good at discounting future outcomes. As a result, you know that speculations, rather than fundamentals, are driving prices to double over just a year. For example:
The Comp has only doubled in a year once, for the 12-month period ending February 2000, at the peak of the dot com bubble.
The index almost doubled in a year during the last speculative tech bubble, up 80 pct y/y in March 2021.
The Comp’s gain of 13.9 percent over the last year, however, is still far from certifiable bubble status. Additionally, in the current bull market, the rolling annual performance peak was just 48 pct in December 2023.
Final thought: History says the odds are in the Nasdaq Comp’s favor to hold onto its year-to-date gains and even continue to rally in the back half barring an exogenous shock. Momentum is a powerful factor, especially when it’s fueled by a disruptive technology, such as gen AI.
Manufacturing … struggling BUT good news as all is not lost as jobs showing signs of … resilience … all in, good news AND bad …
1 July 2025 ING: US manufacturing continues to struggle, amidst signs of jobs resilience
The ISM manufacturing index remains in contraction territory, but the job vacancy statistics are holding up fairly well and inflation pressures remain elevated. Fed Chair Powell, speaking in Portugal, continues to suggest the committee remains in wait-and-see mode, implying little prospect of a July rate cut …
…Labour data remains relatively resilient
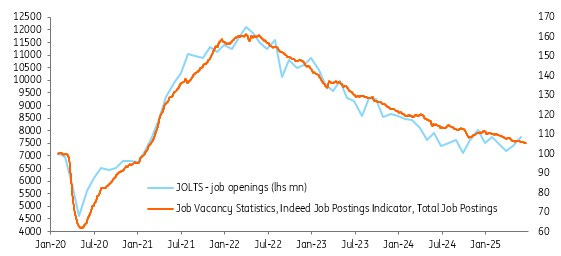
Meanwhile, the JOLTS report showed job openings rising to 7.769m from 7.395m, well above the 7.3m consensus number. However, there is scepticism about the quality of this data relative to other sources, such as the Indeed job website advertisements index that is available daily. The JOLTS is very volatile and swing either side of the Indeed data as the chart below shows. In all likelihood the trend is towards weaker hiring.
JOLTS job openings and Indeed job vacancy statistics
The quits rate picked up and the lay-off rates actually fell so in general this is a stronger report than expected. Note that the ISM prices paid remains very elevated at 69.7 versus the break-even level of 50, suggesting the tariff-induced price hike story remains an important near-term theme for the Fed.
At the margin it diminishes the probability of a July Fed rate cut - which looked pretty remote anyway. Fed Chair Jerome Powell, speaking at the ECB conference in Sintra, Portugal, accepted that a "solid majority” expect rate cuts later this year, but with inflation likely to move higher over the summer the “prudent” thing is to wait to learn more. We doubt very much that the Fed will be cutting interest rates before the September FOMC meeting even though Chris Waller and Michelle Bowman suggest they could vote in favour of action as soon as this month. Markets are pricing barely a 20% chance of this happening, which we agree with.
… Same shop with a few words on BBB and potential impact on the back end of the yield curve … this could then, IMO, pose a problem / hurdle for stonks …
While there's been a material rate-cut-driven fall in US market rates, there are some risks ahead for longer tenor rates coming from inflation and the fiscal deficit. In the UK, a potential slowdown of the Bank of England's balance sheet could help keep longer-dated Gilt yields down, but the global environment is not conducive to this …
…The front end remains solid, the back end less so as the tax bill gets passed ahead The market discount has the funds rate bottoming in the 3% to 3.25% range, and then the forwards have the implied funds rate rising from 2027 onwards. It discounts something of a soft landing, and no need for the funds rate to go deep below neutrality. The rate-cutting expectation is being bullied by President Trump and his administration. Apart from it being an annoying nagging voice in Chair Powell’s ear, the wires are making this out to be a bigger deal than it actually is. It still points to some steepening pressure from the front end ahead.
There are some risks. The first comes from the elevated fiscal deficit. While Treasury Secretary Bessent has no immediate plans to push issuance pressure out to longer tenors, that does not mean that issuance pressure goes away. To begin with, it is heavily bills focused, and we’ll feel this once the debt ceiling is raised in conjunction with the passing of the Big Beautiful Bill. The US Treasury will issue big, as they need to replenish cash balances that have been spent down in an effort to stay within the debt ceiling to date. This will also act to take reserves out of the system, tightening conditions generally. This, alongside the tariff-induced spike in inflation could well be a problem for long rates.
Longer tenor rates can ease down as a theme through 2026, but we identify pressure that can hurt long tenor rates in the coming months. Inflation at 4% can’t really be ignored, when we consider that 10yr SOFR is now at 3.7%. There is some 50bp of upside here as a risk factor, even if temporary. That's where the steepening can come from the back end…
While everyone on Global Wall a$$umes whatever next IS a steepener, this next note from across the pond attempts to at least ask the question first, THEN answer …
1 Jul 2025 NatWEST: Is bank balance sheet expansion a steepener or flattener?
We illustrate that general bank balance sheet growth and growth in the portfolio weight of Treasuries as a percentage of bank credit have opposite effects on the term premium.
The Treasury portfolio weight (Treasuries as percentage of bank credit) is positively related to the term premium. This squares with intuition that bank holdings of Treasuries are more heavily concentrated in the front end.
The total system balance sheet – bank credit – is negatively related to the term premium.
This is important because the proposed changes to SLR would, according to Fed Governor Barr, reduce bank capital system wide by $210 billion. If deployed at 4x leverage, balance sheet growth of $1 trillion would flatten the term premium by approximately 40 bp, in our view
Swiss stratEgerist on the US fiscal position (and a few choice words on today’s ADP …
02 Jul 2025 UBS: The UFP – Unsustainable Fiscal Position
The US Senate passed legislation to enshrine an unsustainable fiscal position into law. The bill goes to the House, where it may run into difficulties. Some fiscal conservatives are unhappy with the unsustainable part of US fiscal policy. Markets are not likely to react to squabbles over details—unsustainable US fiscal policy is well understood, and the economic effects of redistributing from lower income to higher income households will take time to emerge.
Trade taxes animate markets a little more. US President Trump has threatened to tax US consumers of Japanese goods more aggressively—but does have a history of not following through on such threats. Japan is very unusual in that its auto sector has absorbed some of the US taxes by lowering export prices (not something other countries, or other Japanese sectors have chosen to do).
The US ADP payrolls data is due—how well this correlates with official payrolls is questionable (how well official payrolls data correlates with reality is also questionable). Labor data still matters, because it matters to the US Federal Reserve.
A European central bank forum gives several central bankers the opportunity to grab the media spotlight (including ECB President Lagarde). It is unlikely any of them will interest investors.
Somewhat more on yesterday’s data AND on the OBBB from the covered wagon folk … the read through on labor mkts is how I believe many (including myself) are feelin’ right now … simply waiting for that ‘other shoe’ …
July 1, 2025 Wells Fargo: Waiting for the Other Shoe to Drop A Guide to U.S. Layoff Gauges and What They Say About the Current Jobs Market
Summary The low hiring rate suggests firms have been keeping a lid on headcount through the passive means of hiring freezes and natural attrition. As demand for new workers remains under pressure, layoffs need to stay low to keep payrolls expanding at a solid rate and the unemployment rate from rising. As such, layoffs require an increasingly close eye, but which measures to watch?
Jobless Claims: Although the level is historically low, initial claims have been rising on a year-ago basis since late December. The current gap between the hires and separations rates implies initial claims only need to rise a bit further to a run-rate of around 255-265K to grind payroll growth to a halt, assuming the hiring rate and other separations rate remain unchanged.
JOLTS Layoffs & Discharges: JOLTS data provide an estimate of all layoffs, not just workers who file for unemployment insurance. Recent readings have been benign; the involuntary separations rate remains historically low and has been range-bound between 1.0% to 1.1% over the past eight months. That said, the JOLTS data are released with a bit of a lag, and show a pickup in layoffs in the transportation & warehousing industry.
WARN Notices: Large firms (100+ employees) must provide workers with at least 60 days of written notice prior to layoff in the event of a plant closing or mass layoff, making WARN Act notices a particularly early read on layoff activity. The national "WARN factor" has moved higher since last year and is currently hovering at an elevated level relative to the past expansion.
Challenger Job Cuts: Announcements of job cuts are a leading indicator of layoffs, but the length of the lead time and relationship with payrolls is not as tight as the WARN factor. Efforts to reduce the federal workforce have helped to drive a recent spike, but announcements excluding government have also picked back up and suggest firms are re-evaluating staffing decisions lately.
None of these measures suggest a decline in payrolls is imminent. But the uptrends offer an indication that demand for existing workers is eroding, which could threaten the labor market as demand for new workers remains low. Keep an eye on layoffs when determining whether job growth is on the precipice of lurching lower, or if employers can continue to hunker down and wait out the strains of current monetary and economic policy.
July 1, 2025 Wells Fargo: May JOLTS: A Dubious Rise in Openings
Summary The May JOLTS painted a brighter picture of the jobs market than other recent labor market data. Openings rose to 7.8 million, up from 7.4 million in April. Despite the headline beat, we suspect underlying demand for new workers continues to recede amid growing signs of consumer spending fatigue, which should help to offset the upward pressure on inflation stemming from tariffs in the coming months.
…Job openings unexpectedly jumped to 7.8 million in May, up from 7.4 million in April. While the beat appears out of step with separate data (e.g., Indeed job postings, small business hiring plans, continuing jobless claims) that show the labor market cooling, the favorable May Job Openings and Labor Turnover Survey data suggest the pace of softening remains gradual on trend. The advance in openings nudged the number of job openings per unemployed worker up to 1.07 from 1.03 in April despite the modest rise in unemployment during the month. The near-leveling out of this ratio in recent months suggests a broad-based slackening in the labor market has yet to meaningfully take hold, similar to the unemployment rate having moved sideways for nearly a year now…
July 1, 2025 Wells Fargo: Widespread Tariff Concern Evident in June ISM Contraction
Summary A rebound in production and a slower drawdown in inventories resulted in a more modest pace of contraction for ISM manufacturing in June. But worries about tariffs continue to crimp supply, leaving manufacturers fraught with trade-offs for holding inventory as pricing pressure builds.
July 1, 2025 Wells Fargo: Construction Spending Weakens in May High Rates and Elevated Economic Uncertainty Continue to Weigh on Outlays
Summary Development Downshifting Construction spending dipped 0.3% in May, the seventh straight monthly decline. The drop largely was broad-based, with total residential and nonresidential outlays pulling back during the month. While home improvement, data center, infrastructure and institutional outlays generally continue to outperform, high interest rates and elevated economic uncertainty remain a significant headwind for new project starts.
July 1, 2025 Wells Fargo: The Fiscal Handbook: The One Big Beautiful Bill Endgame
Summary
Congress appears poised to enact the Republican-led budget reconciliation bill commonly known as the One Big Beautiful Bill Act (OBBBA). The Senate passed OBBBA today, and our working assumption is that the House of Representatives will pass the Senate version in the coming days, sending it to President Trump's desk for his signature.
The Congressional Budget Office (CBO) projects that OBBBA will increase the federal budget deficit relative to current policy by roughly 0.8% of GDP in fiscal year (FY) 2026 and 0.4% of GDP in FY 2027. However, increased tax revenues from tariffs should offset much of this cost, keeping the federal budget deficit near its current value of 6.5% of GDP over the next few years.
In our view, neither a fiscal blowout nor a return to smaller budget deficits is the most likely outcome in light of the new administration's consolidated efforts from OBBBA, tariffs and DOGE. The best characterization of the near-term fiscal outlook is status quo, in our opinion.
We estimate that the reconciliation bill will add 30-50 bps to real GDP growth in 2026, with a somewhat smaller boost in 2027. OBBBA is one reason we expect real GDP to accelerate in 2026 on the heels of a sluggish growth environment in 2025.
Over the medium to longer run, the fiscal and economic impact is more ambiguous. In the out years, OBBBA flips from fiscal expansion to fiscal contraction as the temporary tax cuts expire and as the planned spending cuts ramp up. If this fiscal tightening occurs as scheduled, then the bill's fiscal cost over the longer run is reined in considerably.
That said, given the recent track record of extending expiring tax cuts and punting on planned spending cuts, we think the market will assign at least some probability that much of the future fiscal tightening does not go into effect, pushing baseline budget deficits up to 8%-9% of GDP in a decade's time.
In a report published last week, we modeled the long-run outlook for the budget deficit and national debt under varying economic outcomes, and we would encourage readers to check that out for further reading on the 10-year fiscal outlook. In short, it would take a very meaningful acceleration in real GDP to "solve" the long-run fiscal outlook.
OBBBA also includes a $5 trillion increase in the debt ceiling. If realized, this should be enough borrowing headroom under the debt limit to ensure that the debt ceiling is not an issue until after the 2026 midterm elections. Assuming the reconciliation bill passes in the coming weeks, the U.S. Treasury will get to work quickly to rebuild its diminished cash balance.
Our rough, initial estimate is that net T-bill issuance will total approximately $700 billion in the second half of the year, and the Treasury General Account will return to $850 billion by the end of the third quarter. We will take a deeper dive into the Treasury supply outlook in a few weeks as part of our regular Treasury refunding preview publication.
…What Are the Next Steps? Now that the Senate has passed its version of OBBBA, it heads back to the House of Representatives. In theory, the two chambers could organize a conference committee in which Republican leaders from both chambers meet and negotiate yet another version of OBBBA. This would let the two chambers hammer out any outstanding disagreements. In practice, we think it is more likely that the House of Representatives takes the Senate bill and passes it as is. If the House passes the Senate bill, it would then head to President Trump's desk for his signature, completing the budget reconciliation process (Figure 9).
… And from the Global Wall Street inbox TO the intertubes, a few curated links …
Positions matter and once again, I am here suggesting one / all have a point / click through of EBBs latest …
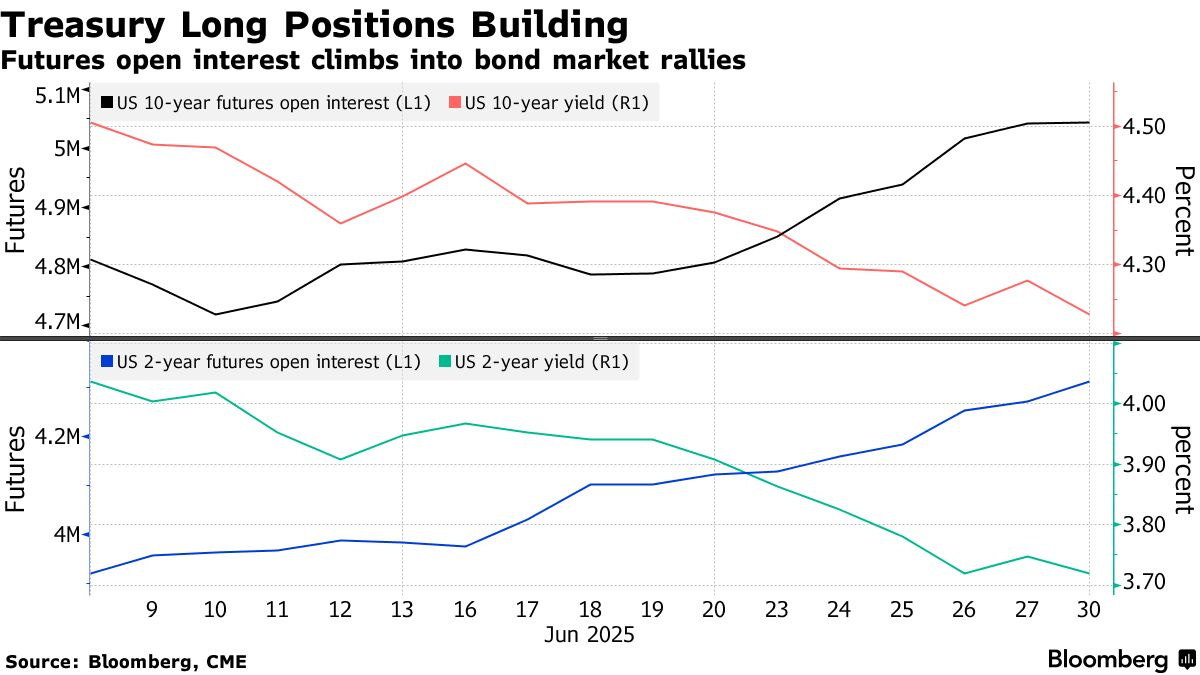
July 1, 2025 at 8:30 PM UTC Bloomberg: Mounting Bets on Extended US Bond Rally Face Jobs-Data Reckoning By Edward Bolingbroke
Bond traders who rapidly built up long Treasuries positions in recent weeks are counting on Thursday’s jobs report to give the market rally more room to run.
June’s payrolls report, the next major risk event for the bond bulls, is set for release just one day before the Fourth of July holiday. Bullish bond investors have already faced a mini-gut check after Tuesday’s JOLTS job openings report showed an unexpected, steep increase for May — a sign of labor market strength that ignited a bond market selloff.
“The persistent long build continues in USTs,” Citi strategist David Bieber said in a note, adding that tactical positioning is now “highly extended one-sided” after the build-up of bullish positions over the past week.
That can be seen in Treasury futures, where CME open interest data shows traders adding to positions into the recent bond market rally, with newly established long positions fueling the recent move lower in yields. In US 10-year note contracts, open interest (the amount of new positions held by traders) has climbed extensively over a period when 10-year yields have dropped from above 4.4% to Tuesday’s 4.185% lows. In two-year note futures, open interest has risen over the past 10 consecutive sessions.
The bullish momentum in the Treasury futures market is also playing out in options. On Monday, a whopping $32 million of premium was spent on an option targeting a further rally in 10-year notes.
At the same time, the one-sided long position in the Treasuries market leaves price action open to potential profit squeezes, as traders may look to unwind should US labor market conditions fail to justify a Federal Reserve interest-rate cut as soon as next month.
The market “is a bit long front-end, with July cut about 20% priced-in after recent language from Bowman and Waller,” said Ed Al-Hussainy, global rates strategist at Columbia Threadneedle Investment. “The risk is this will fall to zero if employment surprises to the upside — say NFP close to 200,000,” he added, referring to the employment report’s nonfarm payrolls component.
As such, there’s still demand for hedging activity around potentially higher yields. Tuesday’s action in the Treasury market includes one position looking to hedge a 10-year yield rebound to around 4.3% by the end of Thursday’s session.
Meanwhile in the cash market, there are also footprints of growing long positions, as seen in Tuesday’s JPMorgan Treasury client survey which shows outright long positions climbed to the most in two weeks.
Here’s a rundown of the latest positioning indicators across the rates market..
… with THAT in mind, same dot com with a look back at how one SHOULDA COULDA done things …
July 2, 2025 at 4:10 AM UTC Bloomberg: Hindsight Capital’s special first-half report Politics drove markets, but you needed a rearview mirror to see what was ahead. By John Authers
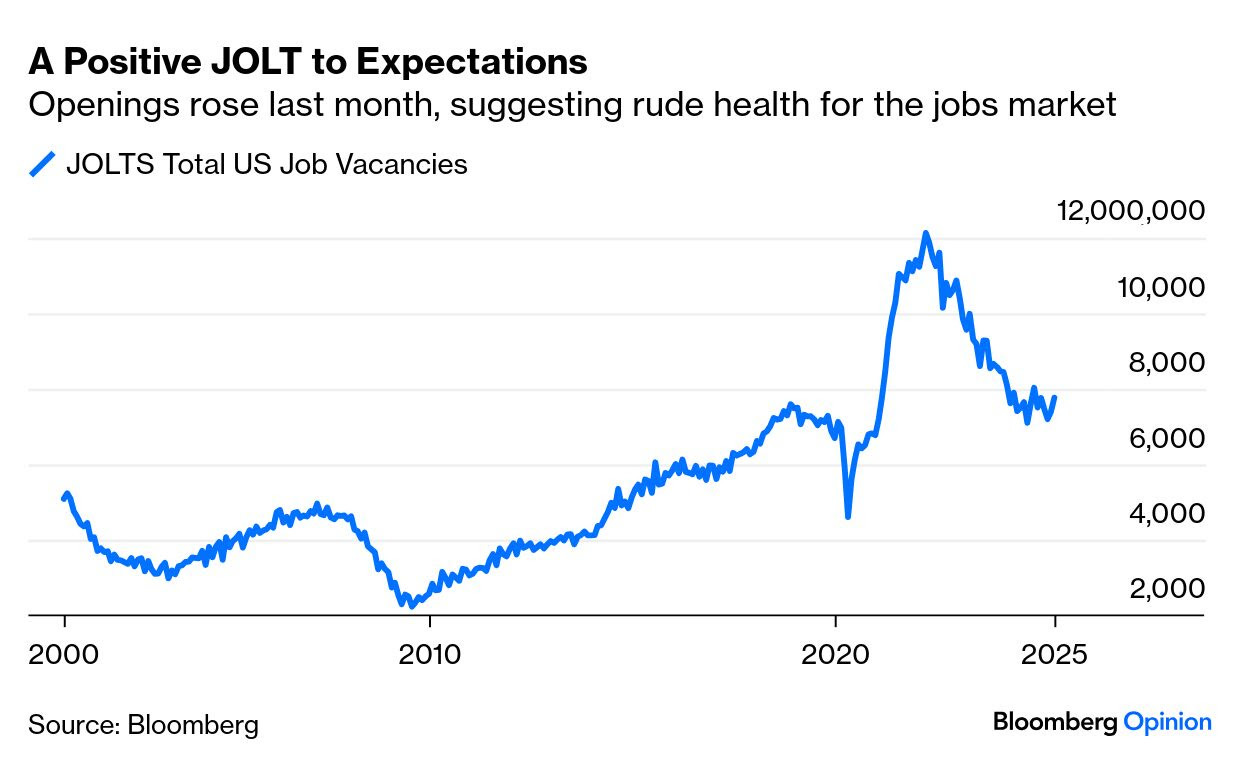
…Data Dependency: Take Your Pick The glut of information for Independence Day week has started with some contradictory data. Positive and negative narratives remain intact.
The strong numbers came from the JOLTS (Job Openings and Labor Turnover Survey), which showed that vacancies had risen to their highest since last November. They’re far higher than they were before the pandemic. This is great news for those seeking work, and for the prospects for economic growth — and not so great for central bankers hoping to avoid sharp wage inflation:
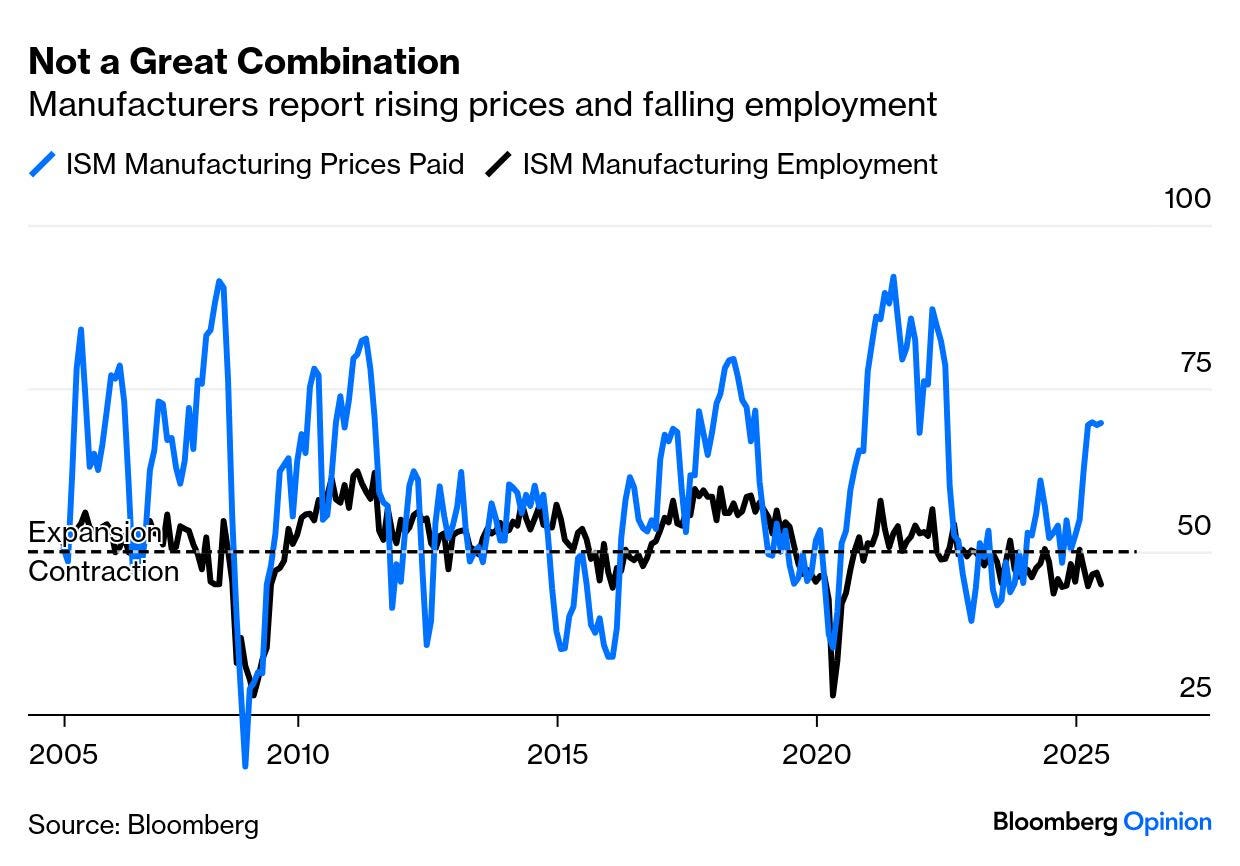
Meanwhile, the Institute of Supply Managers’ survey of manufacturing came in with a headline of 48.0, marginally ahead of expectations but still suggesting the sector was contracting. The details, however, were not great at all. Manufacturers are complaining of rising prices, while also reporting that employment is dropping:
It’s very unusual for prices to be rising while employment is in contraction, and it’s hard to see this as healthy. A more qualitative look at ISM’s report found that manufacturers were preoccupied by tariffs. Comments included:
“The tariff mess has utterly stopped sales globally and domestically. Everyone is on pause. Orders have collapsed.”
“The erratic trade policy with on-again/off-again tariffs has led to price uncertainty for customers, who appear to be prepared to hold off large capital purchases until stability returns. This has resulted in further reductions in customer demand and softening sales for the balance of 2025. Operations has planned additional weeks of downtime at multiple plants to accommodate reduced orders. Next year’s forecast is not any better at this point.”
“Tariffs continue to cause confusion and uncertainty for long-term procurement decisions. The situation remains too volatile to firmly put such plans into place.”
Investors are confident ahead of next week’s tariff pause deadline. People with companies to manage don’t feel the same. Even though these are exactly the people the tariffs are supposed to help. Maybe there’ll be a little more clarity in time for the fireworks…
… finally, on recession once again being placed on the back burner …
Jul 1, 2025 WolfST: Underlying Labor Market Dynamics Are Solid, Recession Stays on the Back Burner
Companies don’t just suddenly drop everything to stew in their own juices.
… Layoffs and discharges fell by 188,000 in May from April, to 1.60 million, seasonally adjusted.
The three-month average fell by 60,000 to 1.66 million, the lowest since August 2024, and below the pre-pandemic Good Times low. The labor shortages are over, and companies are no longer clinging to whoever they could cling to, but this is a solid labor market.
These are workers who got fired with or without cause – a common feature of the US labor market – and workers who got laid off for economic reasons.
Excluded are retirements, deaths, etc.; they’re included in the small category of “other separations.” Also excluded are people who quit voluntarily to take a better job elsewhere; they’re included in “quits.”
… What we’re seeing here in these underlying data of the labor market is a solid and dynamic labor market, but without the immense and costly churn in 2021 and 2022, when people quit left and right to go after better jobs, when the whole labor market was reshuffled in a span of two years. What we’re looking at today are not the dynamics of a labor market headed for a recession; and so that recession stays on the back burner.
Finally with today’s ADP and tomorrows NFP falling in the woods like that tree when there’s nobody ‘round to hear IF it makes a sound, lets not forget …