Good morning / afternoon / evening - please choose whichever one which best describes when ever it may be that YOU are stumbling across this weekends note…
First UP, a look at rates complex and ahead of this coming weeks monthly (1/2yr and fiscal year-end, Japan) closes Monday afternoon — and duration needs via extensions, etc, a couple charts …
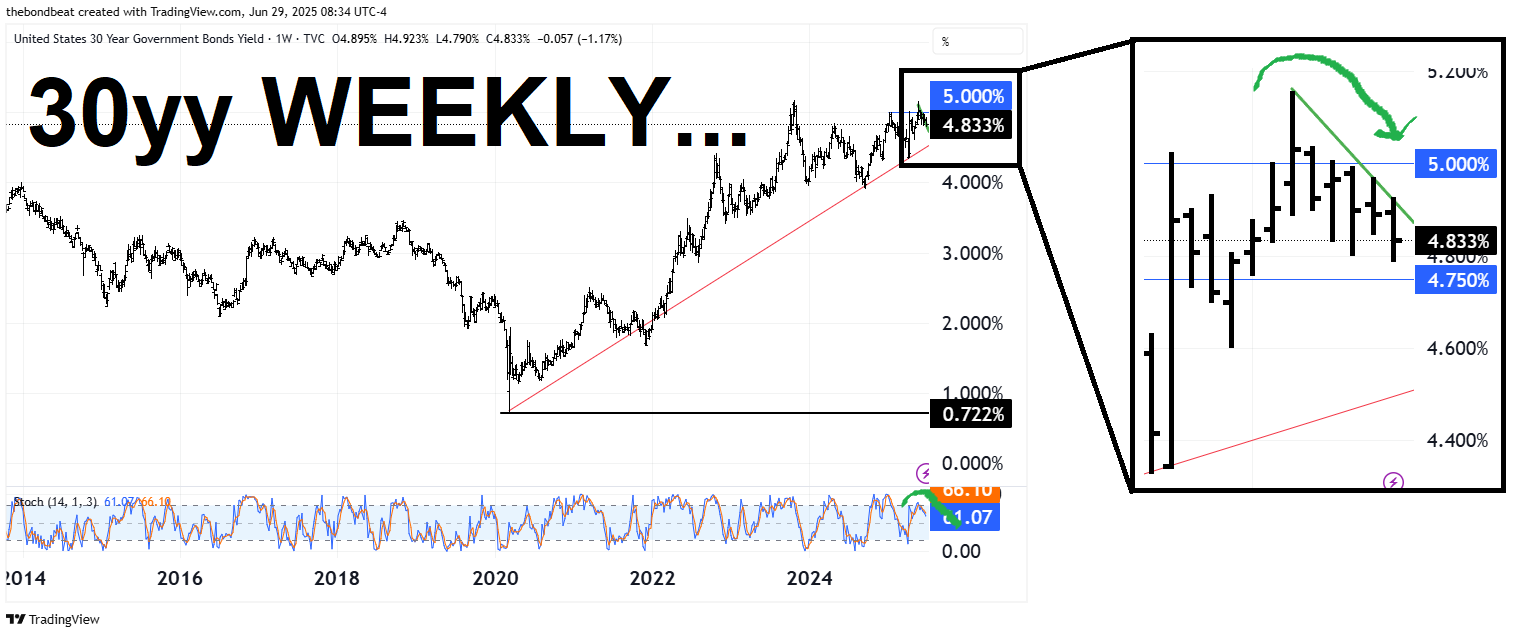
30yy WEEKLY: support (4.92, 5.00) and resistance (4.75, 4.50) …
… momentum (stochastics) has rolled over and crossed bullishly and are on the verge of doing so on longer-term (ie MONTHLY) charts, as well …
… this, in my opinion, helps define risk reward setup and along with funDUHmentals, will hopefully help keep one and all on the ‘right’ side of mkts history.
By ‘right’, I mean on the side of placing chips down in most economically sound fashion and again, as opinions are all created equally (and how we know SOME are more equal than others), my view is just that. An (un)educated guess.
This view clearly impacted by Ms. DiMartino Booth not too long ago — having noted a video I watched / listened to several times since, just a few weeks back (HERE), well, there’s somethin’ happenin’ here and what it is ain’t exactly clear …
Cycle forward to today, here and now, we’ll soon be on Lacy Hunt QUARTERLY writeup (last quarterly was noted / offered HERE … was and likely still is quite BULLISH BONDS) …
And with this somewhat more bullish setup / tone in mind, a few words from Rosie out this past week and offered via MacroVoices pod (HERE) … while the entire interview worth a listen, it’s something he noted about ‘bond math’ — inherently difficult and one of the reasons Mike Bloomberg’s a billionaire, having done to bond math what Steve Jobs did to cellular telephones … To an excerpt …
… I think that'll be the big surprise going into next year, is how far inflation goes down, especially now that the service sector is playing ball. And you're right, that is one of the principal reasons why I am bullish on treasuries. I think that will go from 4.5%, and I think we'll be going down to 3%. And in fact, we don't even have to go down to 3% to know this, to know the math. You see, the reason why people are scared of bonds is the horrible experience and memory what happened in 2021, when the 10Y note was like 0.5% and all you needed was a six basis point increase in the yield to generate a negative return. Imagine that it was a historic period of time. You had no coupon protection, and it only took a minuscule rise in yields to generate a negative return. And that's when everybody was saying, for the next couple of years, 60/40 asset mix is a relic of the past, which I never believed. It was just a circumstance of what we were in coming out of the pandemic, fears that we were going to have the Spanish flu, and who knew that we're going to have Pfizer Monday? You know, in early November of that very same year, in 2020, everybody was saying it was going to take five years to get a vaccine. So, we came out of it pretty quickly, and then we were left with gobs of excess fiscal, military stimulus. That much is true. But you see, the tables are turned, because, we were, not too long ago, at 4.5% on the 10Y note. Well, what does it take if you're at 4.5% on the 10Y note, what does it take to generate a negative return in your bond portfolio? Would be, you'd have to go up 70 basis points. Okay, you'd have to go to 5.2% to lose money in the bond market. You'd have to break above the cycle highs we had in October of 2023, when the Fed was still in tightening mode, which we know it's not there any longer. But if we were to go down 70 basis points from where we are today, you'd make a 10% total return in the 10Y treasury note. So go up 70 basis points earn zero total return. Go down 70, earn 10 basis points to 10%. Most people in the equity market don't understand bond math and the power of convexity. So, I like that risk reward trade off. I like that risk reward trade off in treasuries more than I like the trade off between 4% plus risk free rates and a 4% plus earnings yield.
… and so, a quick annotated look at 10s for reference …
10yy MONTHLY: Rosie’s 70bps up / down range vs 4.25%, approx 5.00 / 3.00 …
… Alrighty, then. Think we’re clear here … DipORTunities (bond sell-offs, buying opportunities) out there. Onwards and upwards straight in to a holiday shortened week which ends Thursday (early) with an update on the labor market.
Definitive along with upcoming inflation report … ahead of all that, a quick review / recap …
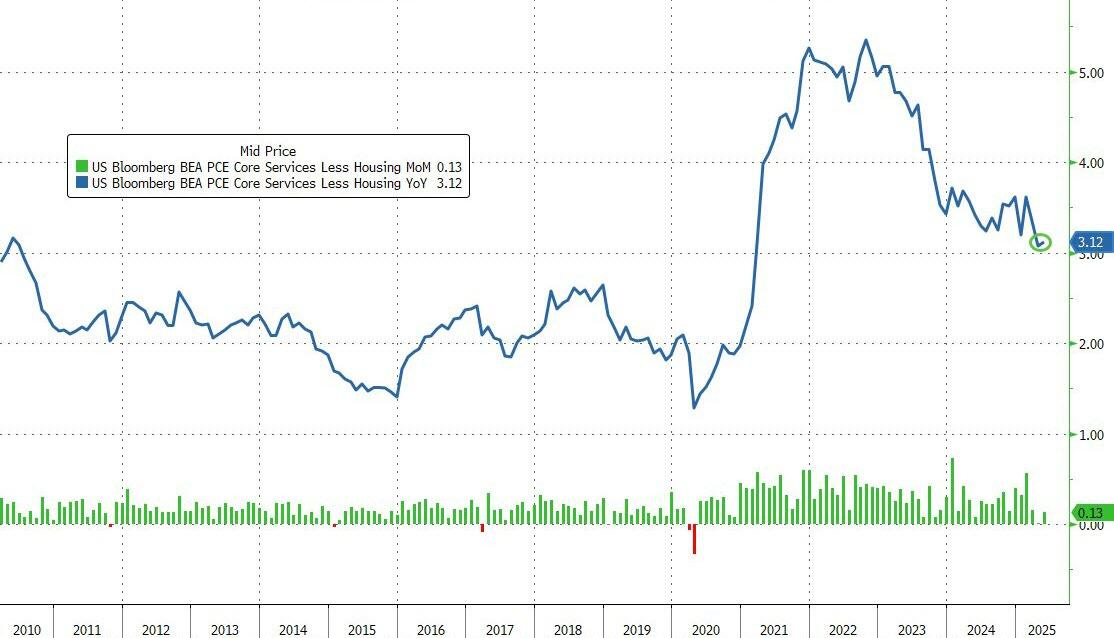
THE Fed’s favoured ‘flation gauge …
ZH: DOGE Sparks Biggest Plunge In Social Security Handouts Ever; Fed's Favorite Inflation Indicator Ticked Higher In May
…SuperCore PCE inched higher on a YoY basis (from +3.07% to +3.12% YoY)...
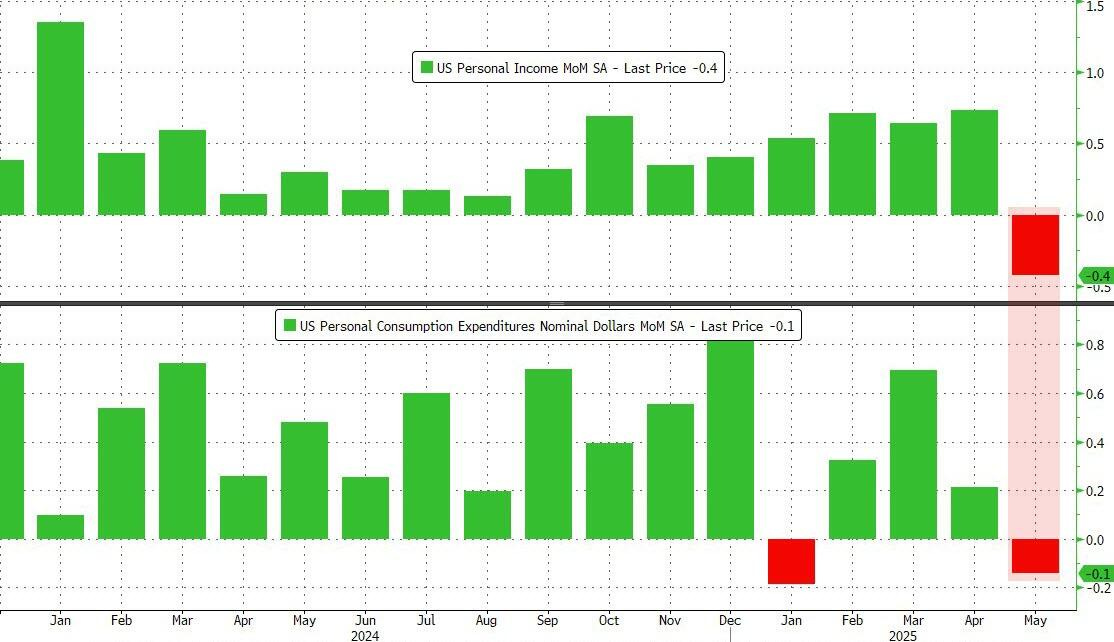
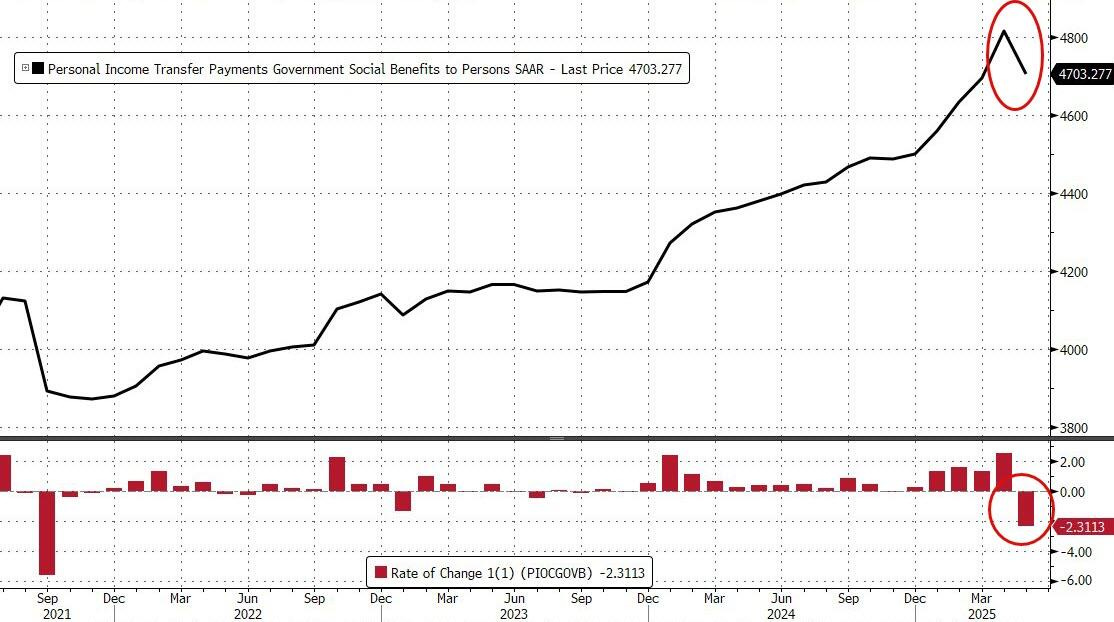
Both personal income and spending tumbled in May (the former by the most since Sept 2021)...
…But, Income's drop was mainly due to a plunge in government handouts...
…Is there enough here to nudge The Fed towards a cut? Or do we keep waiting for the 'lagged' effect of tariffs to finally show up in prices?
This is the 'transitory' no inflationary impact period!
… and speaking of JUMPING (as ‘flation gauge ticked higher, wasn’t all ticking higher but …)
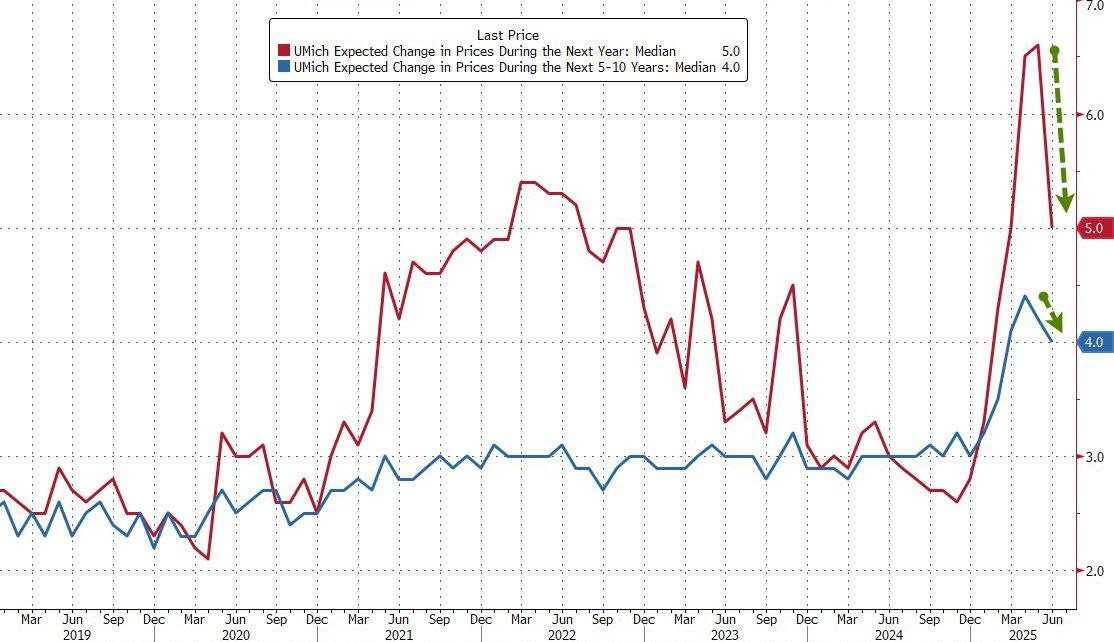
ZH: UMich Confidence Jumps As Inflation Fears Plunge Most Since 2001
…More notably, consumers expect prices to rise 5% over the next year, data released Friday showed. That is down slightly from the preliminary reading. It's also far better than the 6.6% registered in May - the biggest monthly improvement since 2001.
They saw costs rising at an annual rate of 4% over the next five to 10 years, also lower than a month earlier.
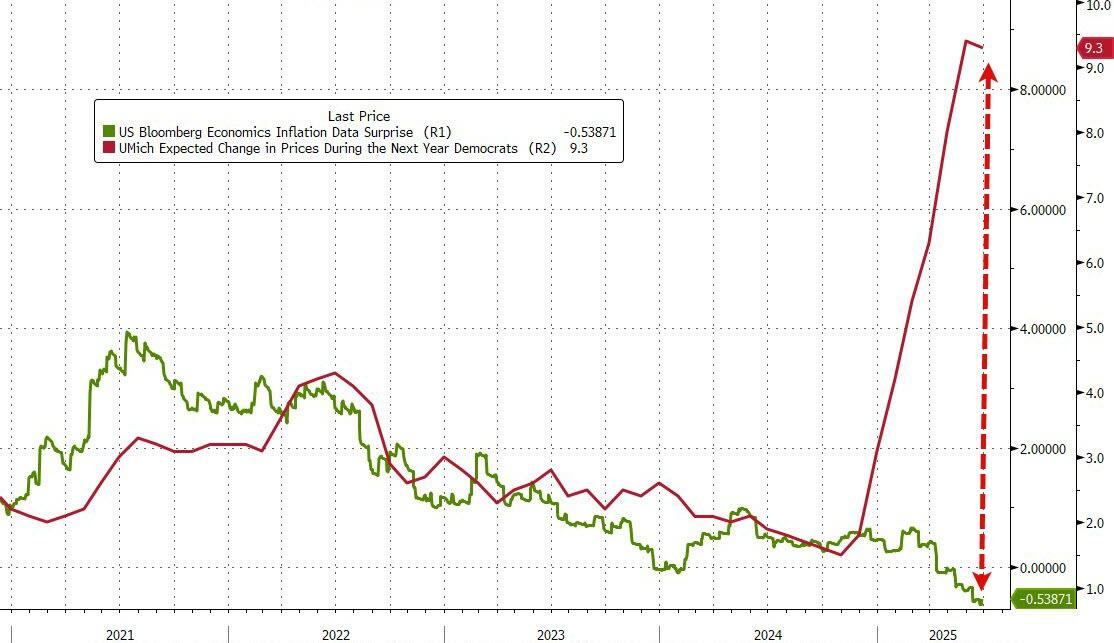
…One more for fun - comparing Democrats view of the inflationary outlook to the 'hard' inflationary data...
… and as the day and week came to a close …
ZH: Stocks, Bonds, & Bitcoin Jump; Gold, Oil, & The Dollar Dumped During Dismal Data Week
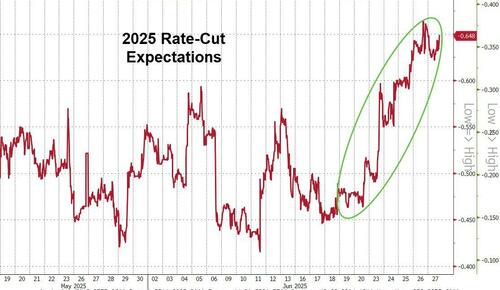
… And that 'bad news' was 'good news' for markets broadly as rate-cut expectations (for 2025) soared...
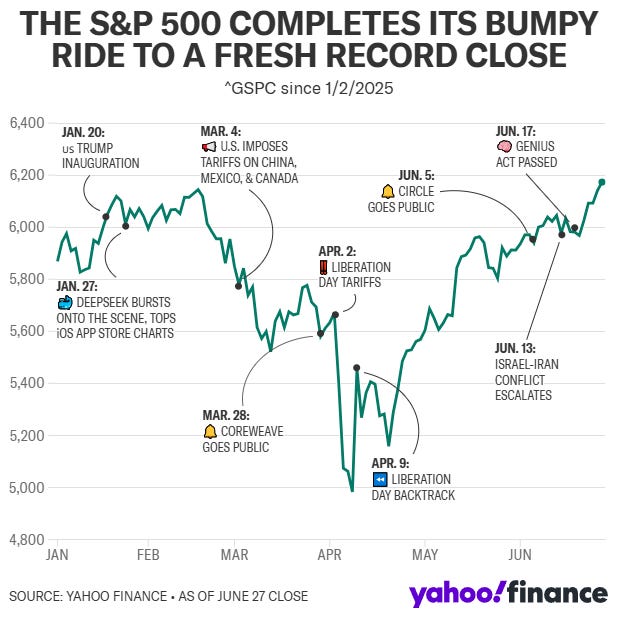
Yahoo Stock market today: S&P 500, Nasdaq notch record closes, brushing off renewed trade tensions
I’ll move on TO some of Global Walls WEEKLY narratives — SOME of THE VIEWS you might be able to use. A few things which stood out to ME this weekend from the inbox …
A read thru on spending and US consumer, and this view from afar …
27 June 2025 Barclays US Economics: May spending estimates confirm softer consumer spending
Real consumer spending fell 0.3% m/m in May, reflecting payback-driven declines in goods and another subdued reading for services following Q1 revisions. Even with an idiosyncratic decline in personal income, the saving rate is now tracking higher than last year, hinting at growing precaution.
The View: Mid-year pulse check: sideways & steeper It will be a top tier week for US data, EU inflation, & global central bank messaging. At mid-year we recommend: fading rate extremes, watch WAM lowering, & track demand.
Rates: Fed chair apprentice US: Dovish Fed voices are growing; we still like fading near term. SLR underwhelmed, justifying our 30Y spread short. We tweak forecasts at mid-year.
Mid-year forecast tweaks: slightly lower end ’26 10Y …We make small US rate forecast changes following macro forecast tweaks from our US economists. Our US economists made the following changes: (1) raise 4Q/4Q 2025 growth forecast from 1.0% to 1.2% (2) lower end ’25 core PCE inflation to 3.1% (3) revise deficit outlook to stable through FY 27. The growth & inflation changes are due to the US-China deal while the deficit shift reflects less Senate prolificacy vs feared.
Our economists continue to see the Fed on hold in ’25 & delivering 100bps of cuts in ’26. Their logic: inflation will rise in 2H ’25 with tariffs & the Fed won’t be comfortable cutting until it moves sustainably lower. A new Fed chair should facilitate the cuts. For detail on our US economist revisions, see our report: Mid-Year review.
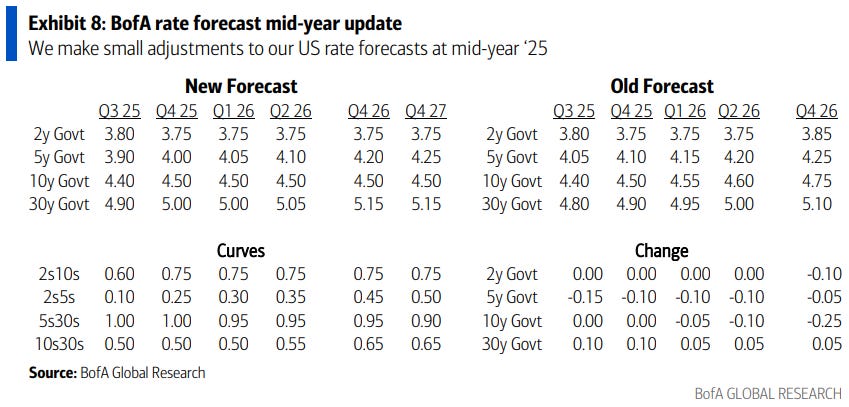
Our US rate forecast changes are modest (Exhibit 8). We make the following adjustments: (1) 2 & 5Y: we angle slightly lower across the forecast horizon between 10- 15bps (2) 10Y: we hold our end ’25 forecast & revise our end ’26 forecast lower by 25bps to reflect more limited rate upside with Fed cuts & inflation declines next year (3) in 30Y we mark to market & pencil in modest additional underperformance; we see only limited 30Y cheapening due to the better-than-feared deficit backdrop & UST issuance shifts (4) we add end ’27 to our forecast horizon. Our forecasts are slightly above the forwards near-term & mixed vs forwards by end ’27…
…Bottom line: some Fed officials have turned dovish & dissent risk has risen. We agree tariff inflation pressures are likely in pipeline & stay paid Dec ’25 FOMC OIS + long 2y3y inflation. Underwhelming SLR justifies our 30Y spread short. US rate forecasts tweaked.
…Technicals: US curve steepening persists, 10s30s breakout Steepening in the US curve resumed this week with the 10s30s breaking above a downtrend line beginning in 2011. We propose a steeper roadmap for 2H25.
Best in the biz … stay with 10s30s flattener and looking to enter 2s10s steepener
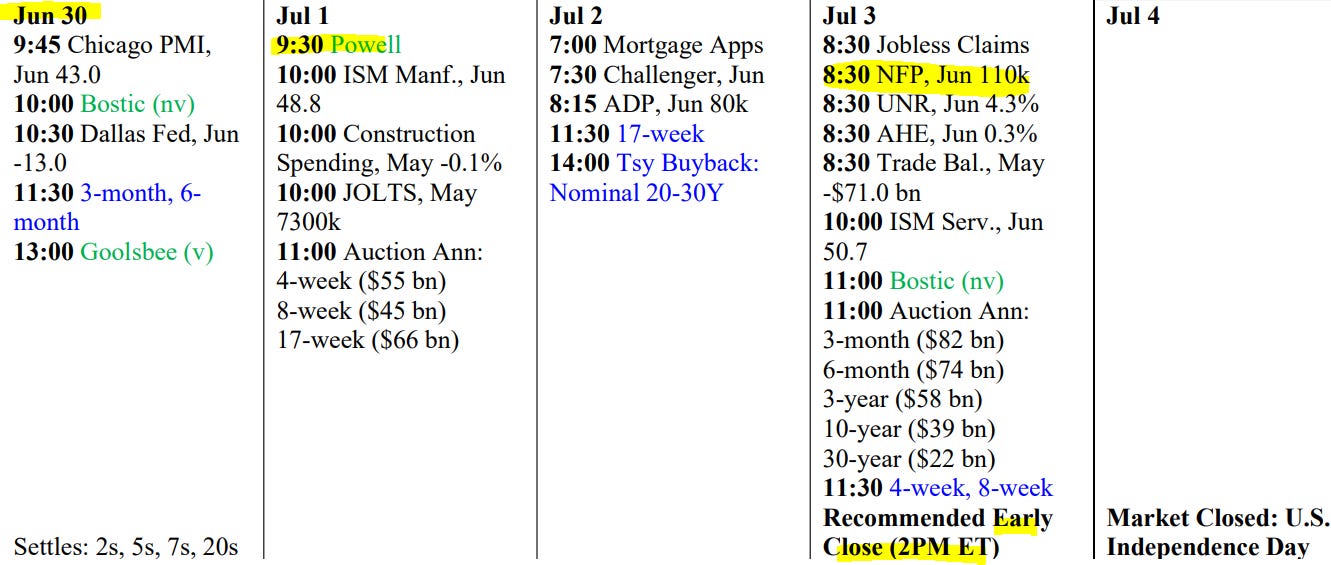
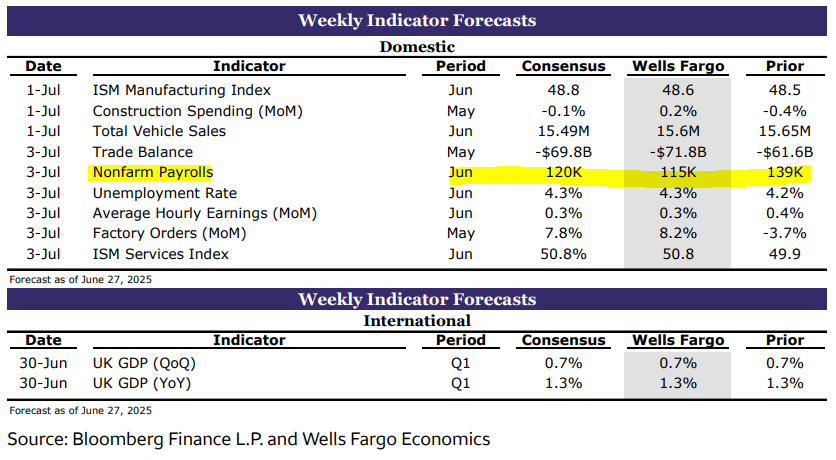
In the week ahead, the market’s recent responsiveness to the fundamentals will be put to the test. Thursday’s payrolls report is the obvious highlight and with the consensus at +110k for June, it strikes us that the market risks a similar setup to last month’s release. Recall that the market was positioned for a disappointment versus the +126k consensus for May's data, only to sell off sharply on a +139k print – which was not only the weakest of the year, but also accompanied by -95k in 2-month net revisions. While yields have retraced from the payrollsinspired selloff that brought 10s to 4.51%, the crosscurrents in the data have provided enough caution that anticipating weakness is the developing consensus. This sentiment is reinforced by the highest initial jobless claims print for an NFP survey week since June 2023 (note that the corresponding payrolls print was nonetheless a solid 209k). As Treasuries attempt to settle into a new trading range for the summer months, we’ll observe that the 10-year rate has slipped below the 4.308% 200-day moving-average, a constructive development…
France callin’ in an NFP precap and a few easy-like-Sunday morning thoughts…
Markets have priced out the geopolitical risk premium following the de-escalation in the Middle East. We think fundamentals imply downside risks to oil prices compared to our pre-conflict forecasts under the baseline assumption of a continued ceasefire.
A breakdown in FX–equity correlations has put upward pressure on hedge ratios, while the safe-haven bid for the dollar was weaker than usual during the geopolitical escalation. We remain short USD and expect further depreciation from rising hedge ratios.
We expect resilient US labour market data this week and see the Fed staying in wait-and-see mode to assess the passthrough impact from tariffs through the summer months. We think hard data will continue to support our view for bull flatteners on the US curve.
…FOMC to stay in school this summer: In testimony before Congress last week and at the June FOMC press conference (see US June FOMC: It’s been a long road, getting from there to here, dated 18 June), Federal Reserve Chair Jerome Powell signaled that policy is “well positioned to wait” to learn more over the summer about tariffs, inflation and growth. While we think Powell would be open to guiding the committee to cut later this year, we see little urgency to sign on to a July cut, a scenario that Governors Christopher Waller and Michelle Bowman have recently floated…
…After the recent comments from Waller and Bowman markets added another 0.6 cuts (about 15bp) in 2025, and no extra cuts in 2026. The 2s10s yield curve bull steepened somewhat, challenging our view that the yield curve can bull flatten. However, we continue to suggest 3m2s10s bull flatteners (see Global: The larks, still bravely singing, fly, dated 13 May), for three reasons. First, the market pricing of total rate cuts by 2026 is overall little changed, suggesting that markets do not extrapolate recently dovish comments to price a drastically deeper cutting cycle. Second, Bowman talked about a July rate cut directly predicated on a contained inflation print for June, which isn’t very likely based on our CPI forecast for June (0.34% m/m core CPI). And third, from a risk-reward perspective, markets are already pricing in about 2.7 cuts in 2025, whereas the June FOMC dots showed that only the two most dovish members suggest three cuts in 2025. To put it another way, markets are pricing the tail-end of the distribution of the 2025 dot plot, and vulnerable to some mean reversion, we think.
We expect resilience in the labor market in June, with a 125k increase in nonfarm payrolls and a steady unemployment rate.
The dovish faction on the FOMC appears freshly attuned to the risk of a job-market stumble, but we have not seen clear signs in hard data that would prompt Chair Powell and the rest of the committee to set aside concerns about upside risks to inflation.
We anticipate that the coming reports on the labor market and inflation will evolve in a way that keeps the Fed on hold through to year-end, but we are receptive to Chair Powell’s framing that “many paths are possible here” as the FOMC learns from the data this summer.
FOMC still looking for more information before adjusting policy rate: In testimony before Congress and at the June FOMC press conference, Federal Reserve Chair Jerome Powell signaled that policy is “well positioned to wait” to learn more over the summer about tariffs, inflation and growth. While we think Powell would be open to guiding the committee to cut later this year, we see little urgency to sign on to a July cut, a scenario that Governors Waller and Bowman recently floated.
The June and July inflation reports will be key. If these reports show tariff-driven inflation has failed to launch, Powell indicated that it would “matter for policy” – which we take to mean as opening the path to rate cuts. Similar scrutiny will apply to the job market, but we think it would take more than one sub-par report to change the narrative that conditions are still broadly solid. We expect an intense spotlight on Powell’s communications at the Fed’s conference in Jackson Hole, in late August, particularly if data are still ambiguous…
… next a large German shop on the dots plots divide AND positioning and flows — always a good check in and likely will make it’s way to the intertubes in the coming days …
27 June 2025 DB: Identifying the 2025 dot plot divide
We provide an initial identification of the 2025 dots from the June SEP and discuss the near-term outlook for rate cuts in light of recent communications from Fed officials.
27 June 2025 DB: Investor Positioning and Flows - Market Hits New Highs, But Positioning Still Low
The S&P 500 rallied past the February highs today. However, contrary to popular perceptions, we see few signs of strong bullish sentiment and risk appetite. In our reading:
Equity positioning has risen significantly off the bottom but is still far below February levels and remains underweight (-0.27sd, 30th percentile).
With geopolitical fears abating, discretionary investors reversed last week’s dip and are now at neutral (-0.03sd, 43rdth percentile). Systematic strategies also raised exposure this week but remain underweight (-0.31sd, 30th percentile).
Positioning in most sectors remains below historical average, with the defensive Staples and Utilities the only ones above and only slightly so, and Tech and other cyclicals all below. Positioning in Healthcare (2nd percentile) and Materials (14th percentile) is especially low.
A basket of stocks with the highest net call volumes in the previous week has gone largely sideways over the last month but rallied this week, a good indicator in our view that risk appetite and momentum-driven buying had not been playing a significant role but are starting to pick up (Will Geopolitical Risk Derail The Grind Higher? Jun 13 2025).
Equity fund inflows show no signs of strong risk appetite, in sharp contrast to the Feb peak. US equity fund flows since February have largely been in keeping with typical seasonal patterns and after accounting for cyclical macro growth, our measure of risk appetite embedded within them remains subdued and close to average. This is in sharp contrast to surging risk appetite evident in January and February (Persistent Equity Inflows, Jan 31 2025). Moreover, outside of a burst of inflows during the Liberation Day selloff, leveraged long ETFs have largely been seeing outflows in recent weeks, another sign of modest risk appetite.
So, if positioning is still underweight and inflows only modest, how are equities back to the highs? Seen through the lens of our demand-supply framework, it largely reflects continued robust buybacks, with companies showing no signs of heading into the bunker with their capital planning. We project S&P 500 buybacks to reach about $1.1 trillion gross this year.
As we flagged earlier this month, the market being back at the highs raises the risk of renewed escalations on tariffs (After The Relents, Jun 2 2025). This would be in keeping with the 2018-2019 pattern of rallies prompting escalations which then drive pullbacks, followed by relents which then spark rallies again. Despite the rhetoric to the contrary, this dynamic looks alive and well. In our view, beyond the market reaction, if negative impacts of tariffs on growth, earnings or inflation start to materialize, we will get further relents.
This may seem basic, but it needs to be said and read and the shop discusses the DATA (no tariff’lation yet) AND remains LONG 5s (and 3s30s steepeners) ready / willing / able to jump on dipORtunities … Same firm ALSO with some easy-like-Sunday-morning thoughts on investors ‘fleeing’ US assets…
June 27, 2025 MS: US Economics: Spending Payback, No Tariff-Boost to Inflation Yet
Key takeaways
We trimmed 2Q GDP growth forecast to 2.0% from 2.1% a.r. on softer May consumption. We expect 2Q consumption at 1.5% with tariff-related inflation drag on June.
Core PCE inflation aligned with our expectations at 0.18% m/m for May. We forecast 3.2% core PCE inflation for 4Q/4Q 2025, close to Fed's 3.1%.
Real personal spending fell 0.3% in May, driven by declines in durable goods.
Nominal personal income fell 0.4% m/m, but labor income maintained momentum.
For the Fed, the consumption and labor market income have slowed, but are solid enough. Slower inflation precedes the tariff-impulse.
June 27, 2025 MS: Watch the Economic Data, Not the US Equity Market | US Rates Strategy
The stock market at the all-time highs may weigh on the minds of investors who share our view that US rates have much further to fall and the yield curve much further to steepen. History suggests that equity market performance ahead of recessions deceives more than it forewarns. Watch data instead.
Key takeaways
Ahead of most NBER recessions, the performance of the S&P 500 Index made it entirely unclear that the economy sat on the precipice of recession.
Additionally, in 4 of the 15 recessions declared by the NBER (27%) back to 1929, the S&P 500 Index peaked in or after the month the recession began.
Stay long UST duration at the 5y key rate and stay in UST 3s30s and term SOFR 1y1y vs. 5y5y steepeners ahead of potential range breakouts post-month-end.
Important US labor market data (May JOLTS, June employment) in the coming week carry the potential to bull-steepen the curve in parabolic fashion.
As we approach July 9, we suggest using any rise in Treasury yields on additional tariff announcements to add to long duration trades and curve steepeners.
… Naturally, tariff revenues play a leading role in reducing the cash flow deficit – something we discussed in Downplaying Deficits. Nevertheless, we think investors lack appreciation for the accumulation of tariff revenues each month because they have yet to affect consumer prices.
As Exhibit 7 and Exhibit 8 show, month-to-date through June 25, tariff revenue annualized at $323.9 billion – or 1.1% of nominal GDP – significantly higher than the previous high for this US import tax over the past 40 years of 0.4%.
This type of tax increase makes us think that US rates markets should build in more risk premia for downside risks to the economy. The labor market data in the week ahead could catalyze such a repricing…
…Trade idea: Maintain long UST 5y at 3.83% with a target of 3.25% and a trailing stop of 4.03%.
…Trade idea: Maintain UST 3s30s yield curve steepener at 1.12% with a target of 2.10% and a trailing stop of 0.75%.
June 29, 2025 MS: IDEA: Sunday Start | What's Next in Global Macro: Are Foreign Investors Fleeing US Assets?
Investment flows, both from and into US assets, were a key theme in our client conversations in multiple meetings across the pond last week. While many questions concerned the tax provisions under Section 899 proposed in the One Big Beautiful Bill Act, which have since been removed, the subtext was clear – are investors, particularly foreign investors, fleeing US assets? While investors may have many reasons for rethinking allocations to any market – valuations, the growth outlook for the economy, or company earnings, among others – the narrative behind these questions centered on uncertainty from the multiple pronouncements and reversals on trade and tariff policy. In this week’s Start, we look at recent data to assess the direction of investment flows in the context of the investment recommendations in our mid-year outlook.
Of course, the devil is always in the detail, and different data sources and frequencies across different market segments don’t always lead to the same conclusion (see here for more details). Weekly data across global equity ETFs and mutual funds from Lipper show that international investors have been net buyers through the weeks after Liberation Day and most of May, but the pace of buying has slowed year to date versus 2024, although it remains much higher than during the same period in 2021-23. As an aside, the data show that even as foreign investors were adding to US stocks, US investors have been net sellers, suggesting that they are reallocating away from US equities. Treasury TIC data (higher quality but lower frequency) point to something similar – a slowdown in foreign demand, but not significant net selling. Data from Japan’s Ministry of Finance show that Japan net bought more US equities in 2025 than the TIC data suggest.
Regional allocation of global equity funds offers another window into flows. In the aggregate, the weight of US equities in global equity funds' portfolios has dropped roughly in proportion to the increase in the weight of non-US equities. However, this does not equate to net outflows from US equities. It’s worth highlighting that the decline in portfolio weights for US equities has been in line with changes in equity benchmark weights, as the market correction shrank the market cap of US equities as a share of the global equity benchmark index. The lower allocation to US equities simply reflects the fact that the US now represents a slightly smaller portion of the benchmark. Overall, we don’t find much evidence to support the narrative that foreign investors have been reallocating away from US stocks.
Bond funds data tell a similar story. Net fund inflows to US bond funds have been positive, albeit slower than the run rate a year ago. This should not be surprising. After all, policy rates were much higher last year before the Fed embarked on rate cuts. It’s also worth noting that net flows into non-US bond funds have been sliding, suggesting that lower policy rates are behind the slower pace of flows into bond mutual funds. Weekly data on mutual funds also show that flows to both US and non-US bonds troughed around the end of April, and both have since bounced back. The Treasury TIC data, which cover a broader swath of investors beyond mutual funds, show that foreign investors in aggregate have remained net buyers of US bonds. While debate rages on whether US government bonds remain safe havens, we do not find evidence pointing to significant flows out of US bonds.
Overall, these flows are largely consistent with the key recommendations in our outlook – US risky and risk-free assets remain attractive versus the rest of the world. While we recommend an equal-weight position in global equities, we suggest overweighting US equities. As Mike Wilson, our chief US equity strategist, notes, earnings revisions breadth is much better in the US than other regions, one of the main reasons why we prefer US equities…
Another shop from across the pond chiming in on the longer end of the US curve and fiscal follies …
Markets continue to assign a high risk premium to the long end of the Treasury curve. This is consistent with expansive fiscal policy, above target inflation, and policy uncertainty.
We think the underperformance of the sector should be understood as an increase in the market’s implicit probability of a “soft” default. In this context, “default” refers to failure to repay the current real value of debt rather than the nominal value.
We expect the Fed to set policy consistent with the inflation mandate. Markets retain the proclivity to expect monetary easing with slowing growth. This behavior reflects a conditioned response to a biased policy reaction function, where the conditioned response was “taught” during the long post-GFC period in which the Fed had the luxury of setting policy for growth and employment due to secular disinflationary pressures. We think the Fed is in the process of “re-training” the market to a more inflation-oriented reaction function.
Given the flexible average inflation targeting strategy, the Fed in fact should be looking to bring inflation below 2%, which would require a longer period of below trend growth. We think the Fed’s strategy is ultimately to tighten passively, by leaving nominal rates unchanged and allowing inflation to fall. The resulting increase in real yields would be the instrument to nudge inflation back to its desired level.
We expect Fed dialogue with the markets over coming months to emphasize the need to make trade-offs between the growth/employment and inflation mandates, which in this instance means tolerating below trend growth to bring inflation down. The Fed will first have to endeavor to look through forthcoming tariff-driven inflation. This means a longer period of “wait and see”.
There are risks to the Fed’s strategy. The trade-weighted dollar’s sharp underperformance will amplify, rather than offset, the positive shock to the price level from tariffs. Moreover, the Fed must depend on lower growth relative to potential in order to lower. There is an unmistakable “good news is bad news” dynamic in the making. We continue to see high rate scenarios as probabilistically undervalued.
We argue that the state and local public sector defined benefit pension sector should further emerge as a source of material demand for the long end. The current dislocation between the real term premium (or just levels of long real rates) and the equity risk premium is generationally wide. We think this investor cohort learned its lesson from the early 2000s experience when a failure to de-risk at similar valuations resulted in a generation of underfunding.
… The public sector was more deeply underfunded. As a result, they remained heavily overallocated to risk assets (charts below) in an attempt to earn their way out of their funding difficulty. However, given the recent period of remarkable risk asset returns, it has been the case that not only might one argue that this investor cohort should re-balance exposures to eliminate further drift in portfolio weights, but they should also de-risk on the margin to prevent repeating the early 2000s experience. The chart below illustrates that this has indeed happened, as over the last couple of years this investor cohort has consistently been buyers of Treasuries and fixed income more broadly, and sellers of equity.
… ‘bout that stagflation … how’s about some context …
June 27, 2025 Wells Fargo: Weekly Economic & Financial Commentary
United States: Stag Before Flation Data are beginning to point toward more of the growth-dampening effects of tariffs (i.e., the "stag") hitting before the price effects (i.e., the "flation"). This week's data dump suggests a weaker first half of the year for U.S. growth, and the narrative of an unshakable consumer is in question…
…Interest Rate Watch: "Well Positioned to Wait" During testimony before Congress this week, Fed Chair Powell defended his wait-and-see approach to monetary policy despite mounting pressure to do so. We look at the difference between comments by the Fed Chair and those made by various members of the Board of Governors in this week's Interest Rate Watch.
Interest Rate Watch A Somewhat More Compelling Case for Lower Rates...Eventually Half of this year’s FOMC meetings are already behind us, although the four remaining meetings for 2025 are apt to be consequential ones if our forecast for multiple rate cuts in the second half of the year is correct. The timing of when those cuts will happen has been the subject of discussion among various policymakers of late.
Federal Reserve Governor Michelle Bowman indicated this week that the central bank should consider cutting interest rates as early as its next meeting in July. The rationale, in her estimation, is that the inflationary impact of tariffs has been less than feared and that the labor market is showing signs of weakness. Her comments were more or less in line with statements from another Fed governor, Christopher Waller, who also expressed support late last week for a potential rate cut in the near future, as early as the next meeting in July. He, too, noted how recent inflation data have been mild and also emphasized the importance of not waiting for the job market to deteriorate before considering rate reductions, advocating for a "start slow" approach.
The key challenge for policymakers is the uncertainty surrounding the impact of tariffs. Governors Waller and Bowman suspect tariffs will not lead to persistent inflation. But the increase in tariffs is unprecedented in the modern era, and other policymakers are not yet convinced that the tariffs’ impact on prices will be so benign. These dovish comments also come at a time when there is increasing pressure on the Federal Reserve to lower interest rates, particularly from the White House, a call that is beginning to be parroted by some lawmakers pressing for immediate action or at least questioning the absence of it.
When pressed during his semiannual testimony before Congress this week about why the Fed has not yet cut interest rates as aggressively as foreign central banks amid mild inflation, Powell said, "[Y]ou're right that if you just look in the rearview mirror and look at the existing data that we've seen, you can make a good argument that would call for us to be at a neutral level, which would be a couple of cuts, maybe more." But the Fed Chair went on to say that many private forecasters still expect inflation to pick up in the back half of the year.
Asked about Bowman's and Waller's arguments for a potential July rate cut, Powell said that "if it turns out that inflation pressures do remain contained, we will get to a place where we cut rates sooner rather than later…I wouldn't want to point to a particular meeting. I don't think we need to be in any rush."
Today’s core PCE print of 2.7% for the annual core inflation rate in May is not enough of a pickup in inflation to stand in the way of a rate cut, should labor market weakness warrant it. There will be just one CPI report and one employment report between now and the July FOMC meeting. A nonfarm payrolls number roughly in line with our forecast of 115K new jobs would not be enough of a slowing in the labor market to force a July rate cut. A more tepid pace of job growth might; an outright decline in jobs almost certainly would.
… Moving along TO a few other curated links from the intertubes, which I HOPE you’ll find useful …
More USTs is job security at least in the bond market, right?
Examining Treasury auction metrics across the curve reveals no signs of weakness in demand for US Treasuries at present. Bid-to-cover ratios are stable, and there is no evidence of auctions systematically tailing, see the first four charts below.
These charts, however, offer little comfort when considering the rising trend in debt-to-GDP, the increasing term premium, the falling dollar, and the $9 trillion that the US government needs to refinance over the next 12 months, see the following four charts below.
In particular, debt-servicing costs are rising rapidly, and the US government currently pays a record-high $3.3 billion in interest payments every day, and for every dollar the US government collects in tax revenue, about 20 cents go to paying interest on debt.
With debt levels growing much faster than GDP, the bottom line is that Treasury issuance will continue to grow faster than the economy, and the most likely outcome is that investors will demand compensation in the form of higher long-term interest rates.
In sum, there is upside pressure on short rates from higher oil prices, higher tariffs, and restrictions on immigration, and there is upside pressure on long rates because of fiscal challenges.
This is obviously very important for investors in both public and private markets.
Our updated chart book looking at demand and supply for US Treasuries is available here.
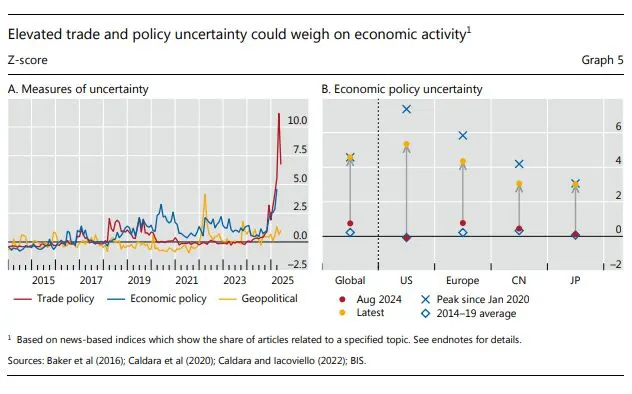
From The Terminal dot com — a note of the central bankers central bank — the BIS …
June 29, 2025 at 6:35 AM EDT Bloomberg: Tariffs Threaten Fed With Real Inflation Headache, BIS Says
… That bleak scenario was described by General Manager Agustin Carstens, presenting an annual report that catalogued how existing global vulnerabilities have been further exposed by the American president’s actions since taking office in January.
“We were meant to have a soft landing — everything was going according to plan,” the former Mexican central-bank chief told reporters. “Then we had this very substantive period of volatility with the threat that tariffs would make more difficult convergence towards 2% in some countries.”
The final report of Carstens’ term in office, published Sunday, details a backdrop of economic uncertainty at “levels typically associated with crises,” driven by higher import levies imposed by the White House, albeit limited for now during a 90-day hiatus.
Growth prospects have diminished while risks have intensified with regard to the stability of consumer prices, public finances and the financial system, the BIS said…
…Carstens highlighted how the Federal Reserve may encounter an especially hard time in the current environment. Chair Jerome Powell is steadfastly resisting White House pressure to cut interest rates.
“In the US, you could face a very difficult scenario for the central bank, which is when you have higher inflationary pressures or deviating inflationary expectations and a slowdown in the economy,” he said. “That is a circumstance that central banks usually find particularly difficult.”
In a speech to central bankers on Sunday, Carstens highlighted how it’s not just monetary officials who have a responsibility to foster credibility in economic management…
…As for central banks, the BIS advised them to “carefully balance” growth and inflation risks, especially given how an era when consumers took price shocks in their stride seems to have passed.
“That world has ended,” said Andrea Maechler, the BIS deputy general manager. “Now there’s a much bigger sensitivity whenever you see any price increase — the fear that it’s not just a simple price increase, but that it affects the inflation dynamics.”
Next is a look at positions and visual of speculative SHORT in bonds having perked up a bit, catches my eye as any move lower in rates likely to catch their attention, too …
28 JUN 2025 Hedgopia CoT: Peek Into Future Through Futures, How Hedge Funds Are Positioned
… this next PCE ‘flation recap has more than a couple good visuals and is, as always, all about how you wanna spin / see it …
Jun 27, 2025 WolfST: PCE Inflation Accelerates. But Tariffs Haven’t Shown Up Yet: Why the Fed Is in Wait-and-See Mode
The 6-month PCE price index accelerated to 2.8% annualized, despite dropping energy prices. It’s been 2.7% to 3.3% in 2025, sharply higher than in the 2nd half of 2024.
…On a year-over-year basis in May:
Overall PCE price index (red): +2.3%, despite the plunging PCE price index for energy. The Fed’s target is 2.0% (purple).
Core PCE price index (blue): +2.7%.
Core Services PCE price index (gold): +3.3%.
Durable goods PCE price index (dotted green): +0.5%, first positive year-over-year reading since May 2023, continuing the bounce-back that started a year ago after the big plunge in 2022 and 2023 (but month over month, the change was 0% in May, indicating that tariffs have not yet been passed on to consumers. The CPI data for May had already pointed that out).
Wolf with more …
Jun 28, 2025 WolfST: The Historically Wide Spread between the 10-Year Treasury Yield and Mortgage Rates Widened Again: Some Thoughts Mortgage rates, QT, yield spreads, inflation, and a bond market that is not to be trifled with.
… By contrast, the 10-year Treasury yield has this year zigzagged along a flat line, and on Friday, at 4.29%, was right back where it had been in November 25, and is now below the EFFR (4.33%).
The spread between the 10-year and 30-year Treasury yields has widened to 56 basis points, the widest spread since October 2021, except for the wild gyrations on April 2 Liberation Day. This means that at the long end, the yield curve has substantially steepened.
The 30-year fixed mortgage rate tracks the 10-year Treasury yield but is higher. The amount by which it is higher – the spread – varies. That spread has also widened and is very wide by historical standards.
These spreads get our attention because it’s via spreads that the market expresses its worries and fears.
The spread between the 10-year Treasury yield and mortgage rates.
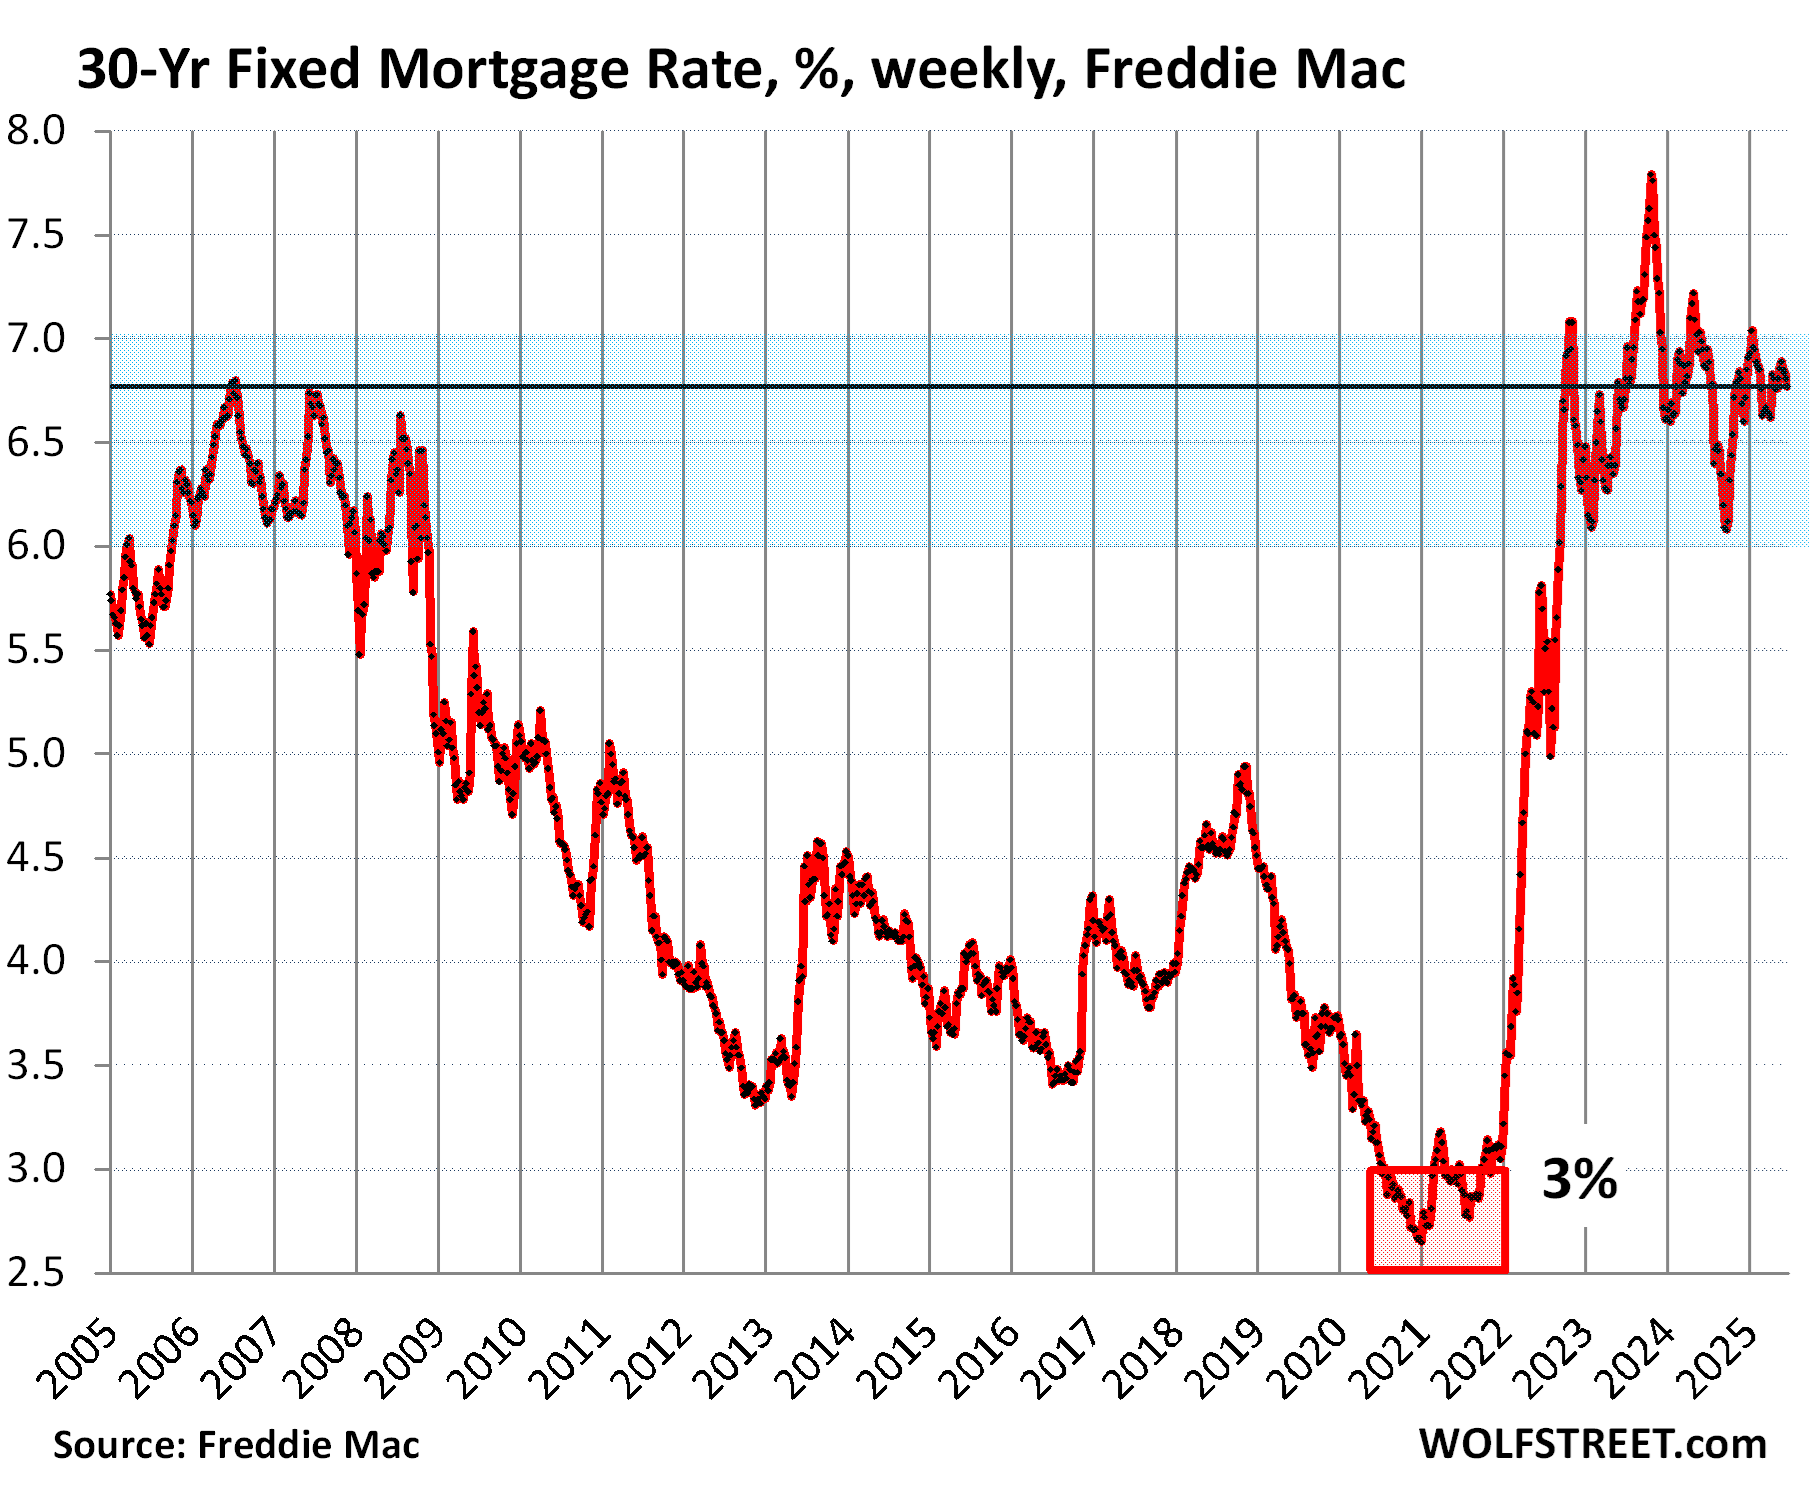
The average 30-year fixed mortgage rate dipped to 6.77%, according to Freddie Mac’s weekly measure on Thursday, which covered the period of Thursday June 19 through Wednesday June 25. It has been in this 6.5% to 7.0% range since October last year.
But the average 10-year Treasury yield over the same Thursday through Wednesday period was 4.31%, and the spread between them widened to 2.46 percentage points, having widened in each of the past three weeks.
During QE, the Fed bought MBS to narrow the spread between Treasury yields and mortgage rates, and also to push down long-term yields in general, and thereby repress mortgage rates, and eventually they fell below 3%.
Then in early 2022, the Fed began detailing the upcoming QT, including the QT for MBS, and the spread widened in anticipation ( the “announcement effect”). The Fed then started shedding MBS during QT in mid-2022, and the spread widened further.
Over this period, mortgage rates rose faster than the 10-year Treasury yield, and the spread widened substantially, and in September 2022, the spread widened past 3.0 percentage points, the widest since 1986. Then the spread started to narrow. But this year, the spread has widened again, including over the past three weeks.
Over the past five decades, there were not many years when the spread was this wide.
Between July 1981 and July 1982, the average 30-year fixed mortgage rate was above 17%, and briefly above 18%. This was the era of the nasty Double-Dip Recession, where the second recession entailed the worst unemployment crisis since the Great Depression.
And mortgage rates were above 10% for nearly the entire 12 years between November 1978 and November 1990…
…During the 40-year bond bull-market, the 10-year Treasury yield meandered down from 16% in 1981 to 0.5% in mid-2020. In late 2020, inflation broke out and raged in 2021 and 2022. Inflation has now cooled substantially but continues to fester.
What the bond market now wants is a vigilant Fed that brings inflation down further and keeps it down, which is what it would take to bring long-term yields and mortgage rates down. If inflation begins to accelerate again, as the Fed cuts rates, then all bets are off on long-term yields and mortgage rates.
… AND for any / all (still)interested in trying to plan your trades and trade your plans in / around FUNduhMENTALs, here are a couple economic calendars and LINKS I used when I was closer to and IN ‘the game’.
First, this from the best in the strategy biz is a LINKthru TO this calendar,