while WE slept: F2Q bid, USTs steady as 'Earl JUMPS on Iran tensions; CPI catchups, F2Q read-thrus, 2025 CES b'mark revisions (-857k jobs from April - Dec), inflation 'slowly but surely' and ...
I know, I know … we have consumed some better / decent inflation news [ast coup[e days AND duration supply (has come and gone) but that’s sort of old news, now.
Team Rate CUTS got some run support and bonds are continuing to trade accordingly. Until past couple hours, that is … Equity futures are indicated lower and bond yields — having benefited from F2Q bid yesterday(s) and overnight ARE taking a breather …
This F2Q moderation as stocks continue to be driven by recent geopolitical tensions (read: IRAN) and I’d offer few words on ‘Earl, from DB …
… oil prices have surged on the news, with Brent crude up +9.00% this morning to $75.60/bbl. If sustained, that would be the biggest daily jump in oil prices since May 2020, as the global economy was recovering from the Covid lockdowns. And that’s slightly down from the overnight peak, when prices reached $78.50/bbl … -DB Early Morning Reid, 13 June 2025
… For more, see below, but this is NOT good. Don’t care WHAT ‘team’ yer on.
I’ll lead with an out of character WEEKLY visual of ‘Earl and ask if this a look at the future of ‘flation prints …
CL1 (via TradingView): watching $80/bbl just because but really, $75 (TLINE) …
… momentum moving swiftly towards overBOUGHT and one can only hope (not a strategy) calmer cooler heads prevail as they have in similar situations in the past
… this would seem to ME to at best, KEEP Fed on hold as it waits and HOPES for tensions to settle down AND hope for this to NOT morph into wider global MARKETS turmoil.
IF it does, however, I’d expect Fed to become more activist and maybe, just maybe, that (bull)steepener will start to accelerate … For now, though, we’ll all be watching how things develop in to the weekend.
A quick look back at what I missed…
CPI was benign …
ZH: Fearmongering Pundits Disappointed AGAIN As Consumer Prices Refuse To Surge On Trump Tariffs
… which helped lead to a bit of a rally … add in a good stellar 10yr auction …
ZH: Stellar 10Y Auction Stops Through, Sees 3rd Lowest Dealer Award On Record
… followed by another good stellar auction process, this time bit further out, 30yrs …
ZH: Stellar 30Y Auction Stops Through Amid Jump In Foreign Demand
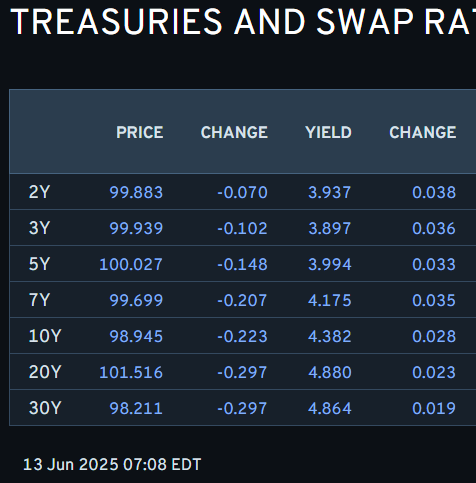
… Long bonds overnight benefiting from F2Q have romanced levels just below 4.80 — lowest in about a month. Whats going to be more important is now what happened overnight or happening right now BUT the days turn of events and how rates complex interprets the news by days and WEEKS end … will have something more of an update over the weekend but thats all for now … here is a snapshot OF USTs as of 708a:
… for somewhat MORE of the news you might be able to use … a few more curated links for your dining and dancing pleasure …
NEWSQUAWK US Market Open: Crude propelled by Israeli attacks on Iran; ES -1.1%, DXY +0.8% … Broadly, fixed benchmarks were propelled to WTD peaks overnight/this morning as Israel struck Iranian facilities. Since, the move has pared and we reside in Thursday's parameters as the intensity of geopolitical news slows slightly and we await updates from Iran … USTs peaked at 111-13 overnight, a new WTD high and just a tick+ shy of last week’s 111-14+ best. Since, the benchmark has pared and is near-enough unchanged, holding just below Thursday’s 111-06 peak …
Finviz (for everything else I might have overlooked …)
Moving from some of the news to some of THE VIEWS you might be able to use… here’s some of what Global Wall St is sayin’ … First up, a few things on CPI …
…In our view, it is too soon to conclude anything about the magnitude of tariff passthrough, but the data seem to suggest that it is likely occurring more slowly…
…Our core CPI forecast for year-end 2025 was revised lower by 0.2pp, to 3.6% y/y, primarily from the downside surprise to the May print. We have also pushed back the timing of the tariff pass-through with a peak effect now expected in the fall (September/October), as opposed to the summer months. Our year-end forecast for 2026, meanwhile, stands unchanged at 2.4% y/y.
… we continue to expect tariff-driven inflation momentum to pick up in June and over the summer.
DB: May CPI recap: Tariffs loom large over otherwise good inflation data
…While the full extent of the tariffs still looms large over the near-term inflation outlook, the recent string of softer than expected inflation data will help to mitigate the ultimate impact within the current year. Indeed, the Fed’s Summary of Economic Projections at next week’s FOMC meeting will be heavily scrutinized for how recent tariff actions have impacted policymakers’ 2025 outlook.
ING: Benign US inflation remains vulnerable to tariff-induced price hikes
Wells Fargo: May CPI: Tariffs Not Yet Enough to Upset the Inflation Cart
… AND on all other things …
First, from afar, a few words on the wars here on our own shores …
12 June 2025 ABN AMRO: US - From trade war to capital war
The One Big Beautiful Bill contains many worrying aspects that further increase the debt level, without a strong economic impulse. Beyond the headline tax cuts, it also contains some proposals for various taxes, such as Section 899, that look an awful lot like capital controls. Various members of the Trump administration have spoken out in favor of such controls. Similar to tariffs, capital controls can reduce the trade deficit, and similar to tariffs, they are stagflationary. In contrast to tariffs, capital controls in theory reduce the value of the dollar.
… On EARL (so a prelude to future inflation data?), PCE precap, a read of hidden data inside claims, STONKS AND another one here from across the pond, looks important enough to relay …
13 June 2025 Barclays: Oil Instant Insight: Alarmed
Oil markets have been alarmed by reports of Israeli attacks on Iranian nuclear and ballistic missiles infrastructure. Despite the ~10/b move higher in prices over the past three days, the worst case outcome is far from being in the price, in our view…
…Having said that, we have been confronted with a similar situation a few times since October 2023 and on each one of those occasions cool heads have prevailed. Diplomacy has driven measured responses from both sides, which prevented the situation moving beyond a tipping point. Therefore, there is reason to avoid being overly pessimistic, even though this escalation may seem a lot harder to deescalate in the short term. The US, for example, is concerned about a potential Iranian response to Israeli attacks.5
13 June 2025 Barclays: Core PCE inflation remained benign in May
Our translation of this week's May CPI and PPI estimates points to a 0.15% m/m (2.6% y/y) rise in core PCE prices and headline PCE inflation at 0.11% (2.3% y/y). We revise our Q4/Q4 core PCE forecast lower by 0.2pp, to 3.1%, in light of the softer-than-expected May estimate…
…Although recent core PCE estimates have consistently surprised to the downside, we are hesitant to extrapolate much from this. The ongoing weakness in financial services inflation is a reflection of the sharp market correction in April. But given that markets have rebounded since then, we expect the category to firm up in coming months. More important, we expect tariff effects on prices to show up in June-July, which should push core goods PCE higher. Finally, we are unsure if the recent magnitudes of decline in volatile categories such as airline fares and lodging away from home will persist.
We revise our Q4/Q4 core PCE estimate lower to 3.1% (-0.2pp) for 2025 and leave it unchanged at 2.2% for 2026. The primary driver behind the downward revision is the softer-than-expected core PCE translation for May, which pushed the index level lower. In addition, although we are calling for the same magnitude of tariff passthrough to prices, we have pushed back the timing of peak tariff effects to September-October 2025 from summer.
12 June 2025 Barclays: Headline jobless claims conceal some labor market deterioration
Initial jobless claims under regular state programs remained constant at 248k last week, with seasonal adjustments erasing notable NSA increases. We think that distortions to the seasonal adjustment related to the timing of the pandemic conceal relatively significant increases.
… In our view, the Department of Labor's (DOL) seasonal adjustments remain questionable, due to the immense distortions during the COVID-19 lockdowns in 2020. Excluding adjustments, initial claims were up 36k from the prior week, in line with what the seasonal adjustments had expected…
SPX is back to 22x NTM EPS; what does this mean for forward returns? 30 years of history suggest that current levels could signal bear capitulation assuming EPS growth stays positive. Several pitfalls from fiscal to tariffs lay ahead for equities, but valuation alone may not be one of them.
11 June 2025 Barclays: 2025 CES benchmark revision: A requiem for the mighty tailwind
Preliminary QCEW estimates suggest that the CES overstated job gains by 857k from April-December 2024, and we expect an eventual revision of 0.8-1.1mn. This would trim monthly job gains by 65-85k/m over this period, reflecting the diminished tailwind on labor supply from slowed immigration.
Be prepared for a big benchmark revision to the job estimates in the upcoming employment situation report for January 2026. This could be preceded by a preliminary benchmark adjustment this August that is even larger.
According to the latest QCEW estimates through December, job gains from April 2024-December 2024 were overstated by about 850k, in seasonally unadjusted terms. If recent history is a reliable guide, this overcount could increase to anywhere from 1.0-1.3mn jobs when initial Q2 estimates are folded in for the preliminary benchmark adjustment. This magnitude would likely be revised down by about 200k by the time of the actual benchmark revision, to 0.8-1.1mn. The eventual revision to payroll employment would surpass even the record downward adjustment (-873k) in the aftermath of the Global Financial Crisis.
We would attribute these revisions to aggregate supply developments, rather than cyclical weakness in aggregate demand. Initial estimates show that the Q2-Q4 discrepancy in 2024 was accumulated almost entirely during the fourth quarter, which, in our view, partly reflects early imprints from the intensifying immigration restrictions imposed by the Biden administration in June 2024. Another piece of evidence that argues against a demand interpretation is the behavior of the unemployment rate, which has fluctuated within a narrow range of 4.1-4.2% since June 2024. This is close to what is widely regarded as its natural rate and consistent with indicators pointing to fairly steady wage growth over this period.
We doubt that the FOMC would react to this news with rate cuts, as we suspect that many on the FOMC are inclined to interpret the revisions similarly. This includes Chair Powell, who in January noted that if job creation and cross-border labor flows "come down together, that can be a reason for the unemployment rate to stabilize."
In our view, a revision along these lines would suggest to us that 1) the pace of monthly payroll gains needed to sustain a flat unemployment rate has slowed below 100k/m, perhaps to as little as 50k/m, and 2) US potential GDP may have slowed 0.5-0.7pp, to a rate approaching 1.5% y/y, in line with estimates we had presented in Help Wanted: Productivity may not apply (December 18, 2024).
… as it may / may NOT impact pricing of rate CUTS (down from 100bps to just ‘bout 45bps noted HERE) …
Best in the biz prepping to update narrative …
June 12, 2025 BMO Close: Preparing to Rotate Narratives
… The market continues to look for any evidence of a pullback in sponsorship for US Treasuries and this week’s pair of stop-throughs for 10s and 30s provided no such fodder for the bond vigilantes. The question has quickly become: how many more times do the auctions need to outperform expectations before the market moves on to another narrative? It’s unanswerable at the moment, other than to observe that once the budget bill is finally passed and/or we see further evidence that the real economy is cooling, one would expect near-term buyers’ strike angst to subside. Of course, the timeline for either of these developments is challenging to project in the present environment. The one dynamic that we’re confident in is that supply jitters will be back in vogue on Monday afternoon with the Treasury Department’s $13 bn 20-year auction. Recall, May’s average tail at the 20-year reopening was the catalyst for a sharp selloff – leaving recency bias at play for early next week …
… It’s not difficult to envision that the combination of Trump’s ‘reciprocal’ tariffs and new levies against China will bias the Fed’s core-PCE estimates even higher. Despite earlier rhetoric from the FOMC that it was too soon to have a full understanding of how the trade war will impact the real economy, investors are increasingly looking toward the SEP to offer a more comprehensive projection of the fallout. It goes without saying that the Chair will offer the typical set of caveats for the SEP. However, that is unlikely to prevent the market from trading the update as if it’s based on a complete dataset.
… Germany F2Q (due to soft inflation data, Jobless Claims and geopolitical turmoil, bonds are BID) … AND on INflation signals emerging …
… The news has led to significant fears about an escalation and a wider regional conflict. For instance, Iran’s armed forces spokesperson said that Israel and the US will receive a “harsh blow” in response, and Iran’s Supreme Leader said Israel “should expect a severe punishment”. In turn, oil prices have surged on the news, with Brent crude up +9.00% this morning to $75.60/bbl. If sustained, that would be the biggest daily jump in oil prices since May 2020, as the global economy was recovering from the Covid lockdowns. And that’s slightly down from the overnight peak, when prices reached $78.50/bbl …
… Given all that, futures priced in more rate cuts from the Fed yesterday, with 52bps of cuts now expected by the December meeting, up +2.9bps on the day. The overnight news has seen that move further, with 55bps priced in this morning. So that led to a significant rally for Treasuries as well yesterday, with the 10yr yield (-6.1bps) falling to 4.36%, whilst the 30yr yield (-7.6bps) hit a one-month low of 4.84%. Matters were helped by a solid 30yr auction, which went smoothly despite recent concern about demand for long-end bonds. And in turn, the decline in yields meant the dollar index hit a three-year low yesterday, whilst the Euro moved above $1.16 intraday for the first time since 2021 …
Since the significant tariff-related upward repricing started in early March, CPI market participants have likely focused on the impact of tariffs on inflation to occur over the summer months up to October.
The downside surprise in yesterday's CPI print triggered a repricing lower in the USD inflation market, with the market likely removing ~0.15pp in CPI over the coming months. As our economists noted, there are signs of tariff impacts from a bottom-up perspective, but these effects are less apparent from a top-down perspective. However, PPI data suggest a broader transmission of tariff effects, albeit still contained and consistent with core goods CPI accelerating to ~ 0.3pp MoM pace.
The market's repricing following the CPI release is broadly consistent with the top-down signals emerging so far from the recent PPI data.
… this is NOT, repeat NOT what long bond is pricing … currently, 30s (and most of the term structure of rates) are doing what you would think they should in times of conflict, like these.
Said another way, 60 / 40 and bond exposure is … STILL not dead yet …
AND …
13 June 2025 ING Rates Spark: Geopolitics add to bullish impulses
Israel striking nuclear sites in Iran only adds to a tactically bullish backdrop in Treasuries underpinned by recent auction and inflation data. Longer EUR rates are also somewhat more susceptible to bullish impulses from abroad again, but these alone have not been enough to push the 10y swap below its key 2.5% threshold
It does seem there is a net bullish Treasuries impulse for now after decent CPI and 10yr auction events, provided the the May PPI bounceback is not overly robust. The bond bulls will be looking for softening in claims data. Euro rates exhibit low volatility and are increasingly detached from the US. In the near term we still see potential for Bunds to perform
Soft US PPI and rise in jobless claims support UST rally; DXY USD Index reaches 3-year low; solid 30y UST auction; miss in UK April GDP; JGB auction tails; BoK says it will maintain easing stance, for now; DXY at 97.88 (-0.8%); US 10y at 4.359% (-6.1bp)
… A stronger-than-expected 30y UST auction eases concerns around long-end demand spurring a flattening of the UST curve (2s:30s: -3bp); the auction comes 1.5bp through with an above average bid-to-cover ratio …
The scale of Israel’s air strikes against Iran were not anticipated by financial markets (US President Trump having suggested a deal with Iran was close, just yesterday). As a result, the oil price has had the largest spike since Russia’s invasion of Ukraine. The economic disruption may well be contained—the starting point was quite a weak oil market, given expectations of a US growth slowdown.
Oil price moves do affect consumers’ inflation expectations, which tend to be dominated by food and fuel (and in the US, political partisanship). Today’s US Michigan inflation expectations data is no exception. It only matters economically if consumers change their behavior in response to shifts in expectations, which is rarely the case.
Somewhat overshadowed by global events, Trump appeared to launch another attack on the independence of the Federal Reserve, declaring that they would force a rate cut. The US president does not have that authority (as things stand), but the intent may make investors nervous about the role of the US dollar as a reserve currency…
Covered wagon folks offering a light in the FOMC dark (ahead of the meeting) as well as a look at immigration …
June 12, 2025 Wells Fargo: The Shifting Immigration Landscape: Implications for the Labor Market
Summary A surge in immigration went a long way toward alleviating the historic labor shortfalls that emerged in the wake of the pandemic. Yet persons entering the U.S. either illegally or under parole represented the lion's share of the recent growth in the foreign-born population, underpinning the Trump administration's efforts to ramp up deportations and limit legal pathways to entry. How are these changes rippling through the jobs market and shaping the outlook for labor force growth ahead?
Foreign Workers in the U.S. Labor Market: Foreign-born workers, irrespective of legal status, comprise 19% of the labor force, up from an 11% share in the late 1990s.
The group has accounted for about 3/4 of total labor force growth since February 2020, reflecting not only the jump in immigration but also a higher participation rate.
Estimates place the unauthorized immigrant population at around 11-12 million and about 4.0%-5.5% of the U.S. labor force.
Foreign-born workers have out-sized representation in agriculture, construction and various service occupations. The composition of the undocumented workforce is less certain, but research suggests the distribution is similar to the official measurement, except for a few highly-skilled occupations.
Early Signs of Policy Changes: Recent efforts to curtail unauthorized immigration are contributing to a moderation in labor force growth.
While volatile, the household survey shows the foreign-born workforce has declined by an average of 150K over the past four months, compared to an increase of 186K during the same period last year.
A slowdown in border encounters, as well as the shutting of avenues previously available to gain temporary parole, have greatly reduced the pipeline of foreign-born workers potentially entering the labor force. Total encounters at the border have averaged 29K in the three months ending in April, down 88% relative to a year ago.
The average level of daily deportations thus far has been little different from the Biden administration's last year in office, but data indicate more removals are coming from the interior. Recent reports of ICE stepping up apprehensions suggest removals could rise further in the months ahead.
Labor Market Implications: Whereas immigration overstated the pace of labor market cooling last year, it could now paint an overly-rosy picture of its health.
Despite a sharp slowing in GDP, we expect the unemployment rate to peak at just 4.5% in the year ahead as weaker demand for workers coincides with weaker supply.
As labor force growth slows, fewer jobs will be needed to keep the unemployment rate from rising. Assuming stable labor force participation and population growth similar to the last time net immigration registered a decline implies the breakeven pace of payrolls would slow to about 90K per month.
Even if deportations fail to materially ramp up, the near-stalling in immigrant inflows and slower native-born population growth will keep the potential pool of workers historically tight. Thus, the hiring challenges that seemed like an anomaly following the pandemic and even in the late 2010s could increasingly feel like the norm.
Despite the ongoing tumult around trade policy, the near-term outlook for monetary policy is steady-as-she-goes. We expect the FOMC will leave its target range for the fed funds rate unchanged at 4.25%-4.50% at the conclusion of its upcoming meeting on June 17-18.
"Hard" data show economic activity continues to hold up amid elevated policy uncertainty. Consumer spending started the second quarter with strong momentum, employment continued to expand at a healthy clip in May and the unemployment rate has held steady since March at a level consistent with the FOMC's estimate of full employment. The latest readings on consumer and producer prices point to core PCE inflation inching up to 2.6% on a year-ago basis in May, up from 2.5% in April and still above the FOMC's target of 2%.
Changes to trade policy have ushered in upside risks to both unemployment and inflation. But, with current data showing activity remaining resilient, we expect the post-meeting statement and Chair Powell's press conference will convey that the Committee is still in no hurry to adjust policy. We believe the FOMC will need to see more pronounced softening in the labor market to begin cutting the fed funds rate again this year. We expect to see this softening in the coming months and look for 75 bps of easing by year end.
An update to the Summary of Economic Projections (SEP) will provide a fresh look at what Committee members think lies ahead for the economy and the fed funds rate. We expect the median projection for the fed funds rate at year-end will move up 25 bps to 4.125%, although we would not be surprised if the median dot for 2025 were left unchanged at 3.875%. The same can be said for the 2026 dot moving up 25 bps to 3.625%.
Elsewhere in the SEP, we expect to see projections for inflation at the end of 2025 move a few tenths higher in light of the changes to tariff rates since the March SEP. Estimates for GDP growth are likely to be revised down to only a little over 1% following the first quarter's decline and lingering challenges to growth in the second half of the year. Yet, the median estimate for the unemployment rate may very well remain unchanged at 4.4%, as slower growth in the labor supply and an ongoing reluctance among businesses to cut workers keeps the jobless rate from moving up significantly this year.
Finally, Dr. Bond Vigilante watching current inflation data and future …
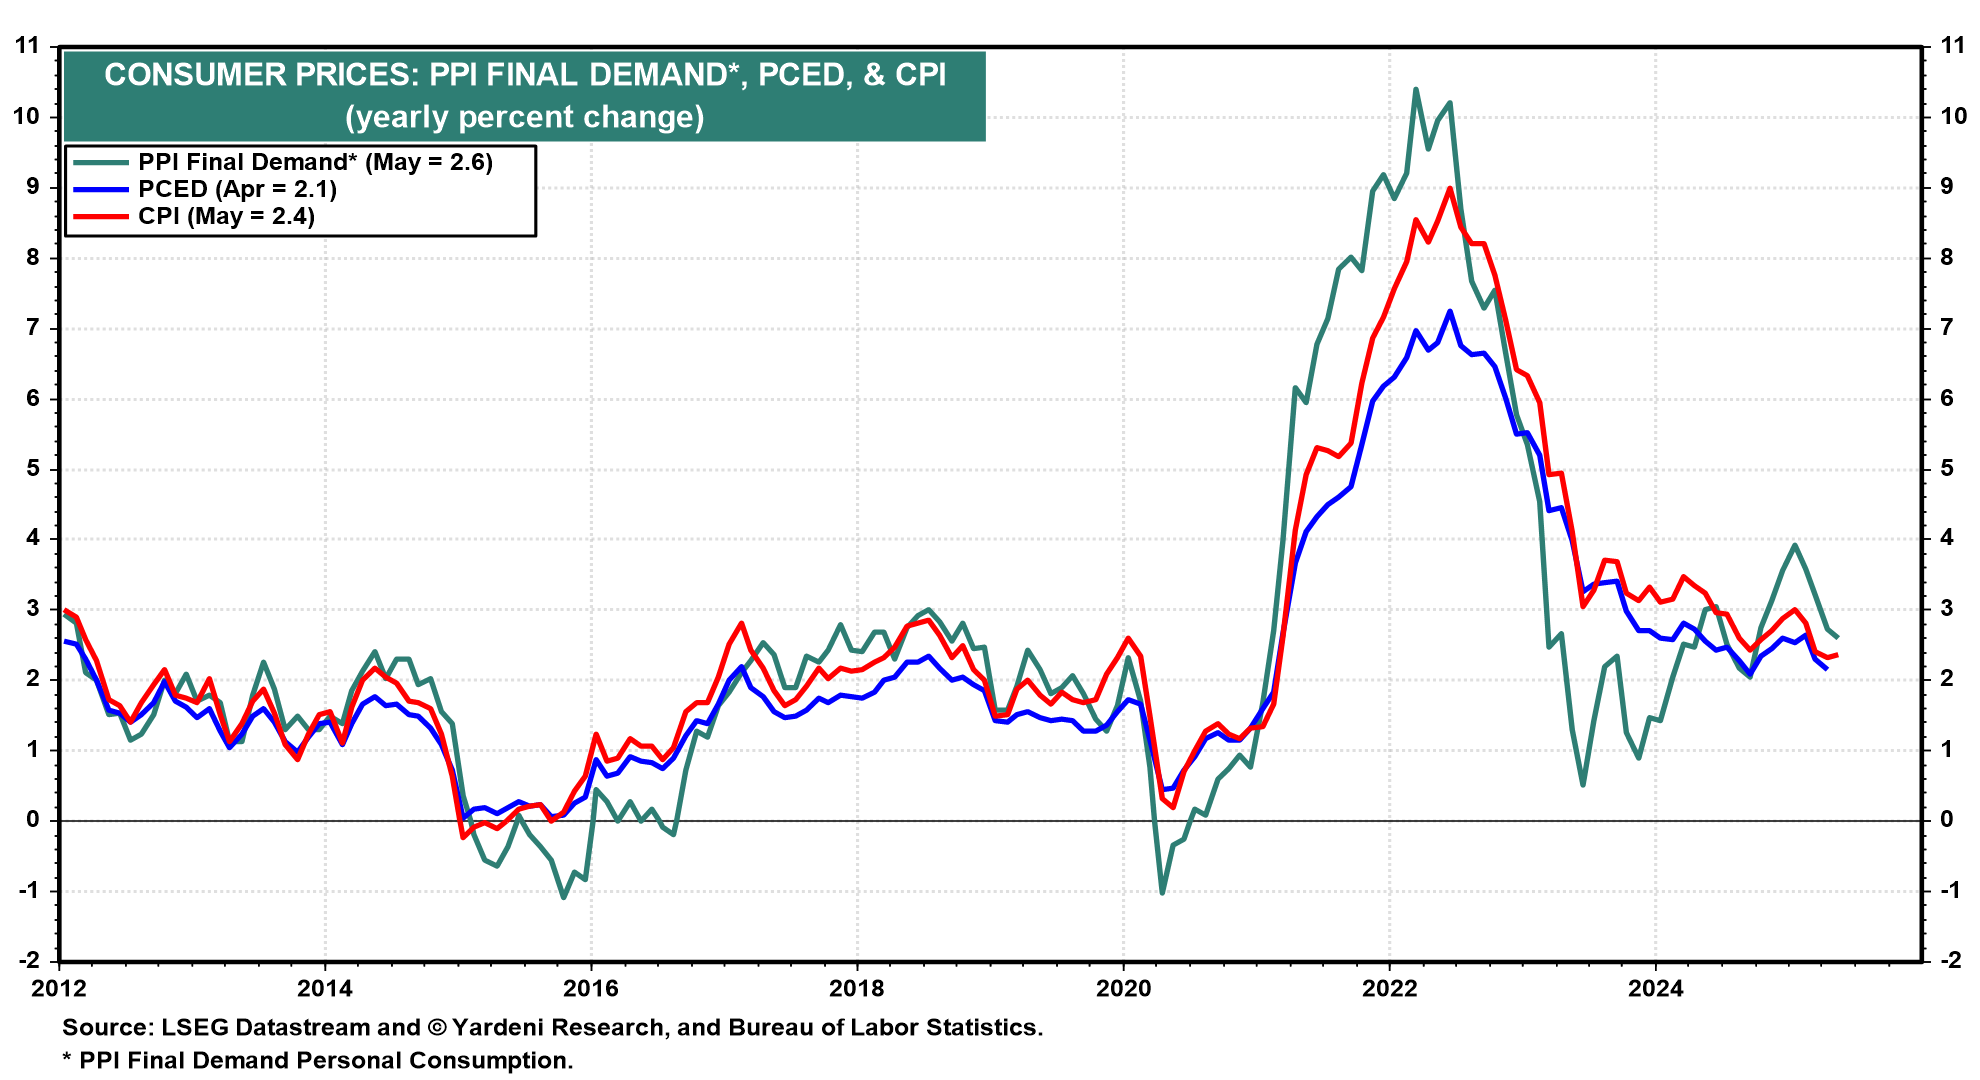
Jun 12, 2025 Yardeni: Inflation Is Chilling Down While Middle East Is Heating Up
May's PPI inflation report, released today, was lower than expected as was May's CPI inflation report yesterday. The PPI final demand for personal consumption edged down to 2.6% y/y in May, while the CPI rose only 2.4% during the month (chart). Both suggest that May's PCED inflation rate might have dropped to 2.0%, which would finally be down to the Fed's target for this inflation rate. The Cleveland Fed's Inflation Nowcasting for PCED inflation is a bit higher at 2.3% for both May and June. Either way, the relevant data suggest that President Donald Trump's tariff hikes have yet to boost consumer price inflation as widely expected.
Furthermore, initial and continuing unemployment claims remain subdued suggesting that the labor market and the economy may be more resilient to Trump's Tariff Turmoil (TTT) than has been widely expected. In other words, the stagflation scenario remains a no-show.
In the bond market, yields continued to decline today in response to May's lower-than-expected inflation data (chart). Thankfully, the widely feared debt crisis in the US government bond market (most recently predicted by Jamie Dimon, Ray Dalio, and Elon Musk) is also a no-show. Recent Treasury auctions have been well received. Yields are down again today despite yesterday's Bloomberg report that "Hong Kong's pension fund managers have formed a preliminary plan to sell down their Treasury holdings within as soon as three months if the US loses its last recognized top credit rating, according to people familiar with the matter." That's either alarming or alarmist. We pick the second choice…
… And from the Global Wall Street inbox TO the intertubes, a few curated links …
So much for the idea foreigners are selling of USTs and hate US duration … this despite / because the BBB …
June 13, 2025 Apollo: Record-High Foreign Exposure to US Duration in Treasury Markets
Foreigners have record-high exposure to long-dated US government bonds. Specifically, foreigners have increased their share of holdings of US Treasuries with a maturity greater than 10 years, see chart below.
As a result, foreign portfolios of US Treasuries are more vulnerable to the ongoing rise in long-term interest rates.
Why have foreigners over the past decade increased their exposure to US duration? Because of the prolonged period of low and negative interest rates in Europe and Japan. Global investors like high nominal yields.
The question on all of Team Rate CUT(s) and those LONG of bonds in some way / shape / form or capacity …
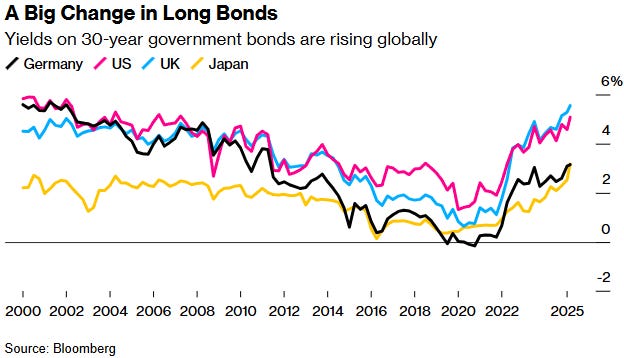
June 12, 2025 at 10:05 PM UTC Bloomberg: Why Long Bonds Are Falling Out of Favor
Jamie Dimon drew varied reactions with his prediction that the bond market is going to “crack” if the US government doesn’t get a grip on a ballooning federal deficit.
Treasury Secretary Scott Bessent said the JPMorgan Chase & Co. boss had offered many such warnings during his career, and “fortunately, none of them have come true.” To some seasoned observers, Dimon’s comment was a signal to his own staff to avoid getting burnt by taking too many risks on bonds.
What’s clear is that Dimon’s headline-grabbing pronouncement on May 30 at the Reagan National Economic Forum captured a certain Wall Street sentiment with the bond market enduring one of its biggest bouts of turbulence in decades.
Yields on US long-dated bonds — the income investors demand to hold government debt repayable over a decade or more — spiked above 5% in late May, near the highest since 2007. That signals how worried investors are about holding the securities in the face of spiraling budget deficits.
And while an auction of 30-year Treasuries on June 12 drew solid demand in a sign that the US bond market was still avoiding an all-out buyers’ strike, appetite for long-term bonds from other countries is more suspect.
What’s been happening with long-term bonds?
Bond traders usually buy and sell bonds based on the relative appeal of their fixed coupon payments. The longer there is until a bond “matures,” the more that can go wrong in the interim. So long-term bonds with a duration of between 10 and 100 years tend to command higher interest rates than shorter-term treasury bills that are repaid in less than a year, to compensate buyers for the additional risk.
When a country’s economic outlook worsens, bond yields tend to fall. This is because a weaker economy encourages central banks to shift their focus from combating inflation to stimulating economic activity. That gives it a bias toward lowering its own benchmark interest rate, boosting the relative appeal of bonds versus cash in the bank.
But lately yields for long bonds have been climbing. In the US, that’s in part because the economy has slowed, not collapsed, and inflation has stayed stickier than forecast. But many economists say investors are also fixating on the government’s ability to repay mounting debts, especially given President Donald Trump’s pushes to impose tariffs and extend tax cuts.
How is that showing up in their numbers?
Long-term bonds pay a lot more interest during their longer lifetime than short-term bonds. So their price and yield tend to fluctuate more than with shorter-dated debt in response to perceived changes in the value of that interest.
In the US this year, shorter-term yields that are more sensitive to the Federal Reserve’s interest-rate policy have declined, while the rate on the longest-term US debt has risen. Economists see it as a sign that bond investors are getting more skittish about the national debt.
Why all the worries about the debt and deficits?
Governments across the world loaded up on cheap debt after 2008’s financial crisis, then borrowed even more to cope with coronavirus lockdowns. Global debt reached a record $324 trillion in the first quarter of 2025, driven by China, France and Germany, according to the Institute of International Finance.
A surge in inflation and interest rates since the pandemic makes that scale of borrowing harder to sustain. The concern is that if bond yields stay high and governments fail to get their fiscal house in order, the cost of servicing some of that debt will become unmanageable. That could end up hurting the economy given rates on everything from mortgages to credit cards are somewhat dictated by bond yields.
In the US, a tax bill implementing Trump’s domestic agenda is working its way through Congress. The cost of the bill is very much a concern for bond investors. Dimon, in his comments at the Reagan National Economic Forum, said the US was engaging in “disastrous” fiscal management and called its tax and spending policies “completely unrealistic.” Moody’s Ratings in May also stripped the US of its last-remaining top credit score, citing concern that ballooning debt and deficits will damage the country’s standing as the preeminent destination for global capital.
Why is spike in long bond yields a problem?
Investors want the bond market to be safe and boring, as these assets are what many of them hold to ensure a rock-solid stream of income to balance out the volatility of higher-risk, higher-reward investments such as technology stocks.
When longer-term yields jump, it feeds into mortgages and other forms of debt, affecting housing affordability, auto loans, credit card rates and more. And if long bond yields stay high for longer, that will gradually affect how much it’s costing a government to borrow money.
Where could things go from here?
It’s not clear what a prolonged period of higher borrowing costs would mean for the mountain of long-term debt that governments binged on during 15 years of ultra-low interest rates. The upward shift in yields is already leading to new phenomena with unpredictable consequences.
One example: Japan’s government bonds used to have such low yields that they acted as a kind of anchor by adding downward pressure on yields the world over. They shot higher in recent months, adding to the volatility in global bond prices and attracting foreign investors to Japanese debt in significant numbers. This could mean fewer buyers for debt sold by other nations.
In the US, there is still concern that post-pandemic US inflation is not yet under control and that Trump’s tariffs could add further inflationary pressure that exacerbates the bond yield spike. On the other hand, Trump’s trade war may also dampen economic activity, leading the Fed and other central banks to cut interest rates. Or both could happen — a surge in prices accompanied by falling economic output or zero growth — a situation known as stagflation. This would add to the uncertainty over monetary policy, with the Fed forced to choose between supporting growth or suppressing inflation.
… on heels of CPI, a direct note from ‘the beach’ …
Wednesday, June 11, 2025 Calafia Beach Pundit (by Scott Granis, WAMCO): Memo to Fed: lower interest rates are overdue
The inflation news continues to get better. Indeed, inflation has beaten official expectations for the past two years—yet the Fed remains cautious. Fed-watchers are familiar with this: the Fed is always slow to catch on to the prevailing fundamentals. They waited too long to tighten (as they did throughout 2021, despite abundant evidence that M2 had exploded and measured inflation had surged), and then they waited too long to ease (not cutting rates until in late 2024, almost 18 months after inflation had fallen from 9% to 3%).
In the past (before the Fed adopted an abundant reserves policy), such mistakes had severe consequences: once policy became tight enough to slow the inflation fueled by a delayed response to higher inflation, the economy invariably suffered a recession. Today it looks like we will avoid a recession, but that doesn't ensure we won't see some housing market turmoil. Liquidity in the housing market is terribly low and prices are unsustainably high, all on top of a surging inventory of homes for sale. And to the chagrin of would-be home buyers, 30-yr mortgage rates are hovering just under 7%—which equates to a crushing real interest rate of about 5% per year. If Fed policy had been more responsive in the past decade to swings in inflation, mortgage rates today would be far lower.
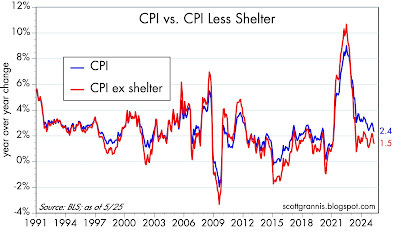
Meanwhile, in the good news column, today's May inflation report showed that consumer prices on average rose a mere 0.1% in May, and are up only 2.4% in the past year. However, excluding shelter costs (which are now widely understood to be a seriously lagging statistic that effectively overstates current inflation), the CPI is up only 1.5% in the past year. Abstracting from shelter costs, consumer prices have risen at a 1.8% annualized rate for the past two years. In other words, inflation has been below the Fed's target for a full 2 years. Long-time readers will know that I first made this point two years ago.
Memo to Fed Chair Powell: lower interest rates are not only justified but long overdue.
Chart #1
Chart #1 illustrates the relatively large gap between headline inflation and inflation ex-shelter costs. This gap has been narrowing for the past two years (though the narrowing has been slower than I thought it would be). Excluding shelter costs, consumer price inflation has been less than 2.0% year over year in 19 of the past 24 months; on an annualized basis, ex-shelter inflation has been 1.8% over the past two years.
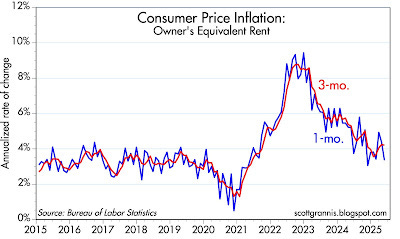
Chart #2
Chart #2 shows the portion of the CPI that corresponds to shelter costs: Owner's Equivalent Rent makes up about one-third of the CPI. Shelter cost inflation by this measure has been declining for over two years.
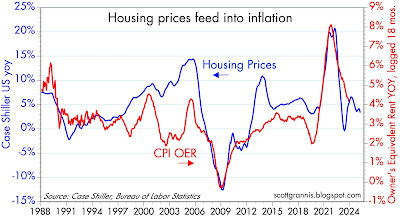
Chart #3
Chart #3 shows how the year over year change in housing prices 18 months ago feeds into the OER component of today's inflation. (I have shifted the red line 18 months to the left to show this.) The most recent evidence of housing prices shows that in most areas of the country, home prices are roughly flat to down. This all but ensures that the OER component of the CPI will subtract meaningfully from consumer price inflation for the next year or two.
Recession? Here’s an update …
Jun 12, 2025 WolfST: Recession Watch: My Favorite Recession Indicator, Mid-June Update
It says: “Not yet,” and “Quite aways to go.” This trend has reversed before, but if it doesn’t and instead picks up momentum... Time to keep an eye on it.
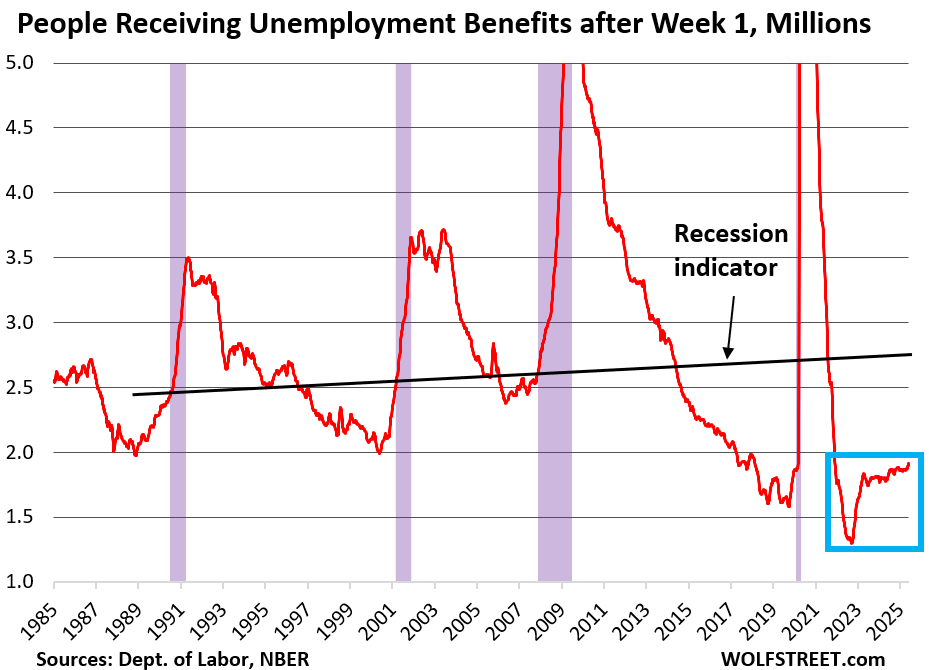
… My favorite recession indicator is the weekly data on the people who filed for unemployment insurance at least a week earlier and are still claiming unemployment insurance because they still haven’t found a job, what the Labor Department calls “Insured Unemployment.”
The black slanted line is the Recession Marker. The levels that entail a recession have risen over the decades as total employment has risen. This growth of employment over the decades causes the Recession Marker line to be slanted upward.
The current level of Insured Unemployment is still historically low, and far below the Recession Marker for this year of about 2.7 million.
The prior three business-cycle recessions – not counting the Pandemic which was a lockdown, not a business cycle recession – came after Insured Unemployment had surged to:
64 million in December 2008, beg. of Great Recession
56 million in March 2001, beg. of 2001 Recession
49 million in July 1990, beg. of 1990 Recession.
Today, the four-week moving average rose to 1.914 million, as the weekly total rose to 1.956 million, according to the Labor Department.
This shows that newly laid-off people – their numbers have been fairly low historically – are having a harder time finding a new job, than they did some months ago.
So it’s not that there is a big wave of job cutting, there isn’t, and employment overall continues to grow. But employers have slowed absorbing the people that have been laid off, and the number of people on Unemployment Insurance has been increasing at an accelerated pace and in early May started exceeding the mid-November level. The purple columns indicate recessions.
If this trend doesn’t reverse… While the level itself remains relatively low, and quite a bit below the recession marker (black line), the trend is going in the wrong direction at a now significant pace.
This trend has occurred before, and then it reversed before reaching anything near critical mass, and the economy kept plugging along just fine…
… AND finally, from the other day (Wed just ahead of the CPI) …
ZH: Treasuries Face Several Risks, Not Least From Stubborn Inflation
Authored by Simon White, Bloomberg macro strategist,
Longer-term yields will be unable to go down significantly, absent a recession, while inflation remains stubborn and ongoing fiscal risks deter Treasury buyers.
May CPI is released later, but that comes as another piece of news today – on Hong Kong’s pension fund managers plan to sell Treasuries if the US loses its AAA rating altogether – is a reminder that structural risks persist for US debt even as inflation has slowed.
The latest CPI data will start to give an inkling of how much tariffs and tariff front-running have impacted inflation. Both core and headline CPI are expected to tick up from last month to 2.9% and 2.4%.
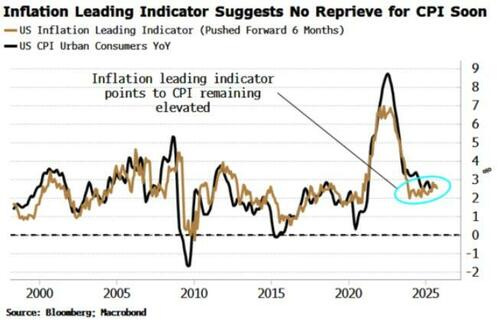
Inflation, though, it must be remembered, is a heavily lagging piece of data. The modest slowing this year does not necessarily mean that trend will continue. Instead, one must focus on data that leads inflation to try to see what it will do next.
The inflation leading indicator takes inputs that reliably lead CPI, such as metals prices, survey expectations and money growth. It continues to hover at an elevated level and, critically, is not turning down, inferring that CPI is set to remain elevated too for at least the next six months.
But current inflation is not the preoccupation of the Treasury market as much as it was.
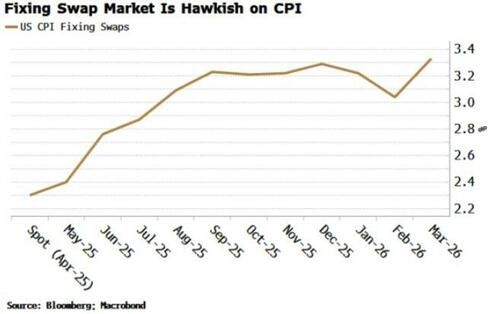
First, there is what tariffs mean for forward inflation. The fixing-swap market sees headline CPI steadily rising to over 3.3% over the next 12 months.
Second is the US’s fiscal incontinence, which is pushing Treasury buyers to rethink how much US sovereign debt they own, and at what price.
The Hong Kong proposal to reduce Treasury holdings if the US loses its AAA rating is emblematic of the issue.
In and of itself it should not pose a risk. Firstly, given it’s only Japan’s Rating and Investment Information Inc. that still has a AAA rating for the US makes a downgrade less likely -- it would be impolitic for it to drop it. Secondly, the total funds are $166 billion, and not all invested in Treasuries, so the upper limit of USTs in HK pensions is, while not insignificant, also not on its own life threatening for the market.
But it flags a greater issue that foreign holders of Treasuries – who are the largest owners of USTs, with about 30% of outstanding, and will be less susceptible to financial repression than domestics – are becoming warier of the level of their exposure. The risk will only grow as the US continues to run eye-watering fiscal deficits, with little hope they will come down any time soon.
… AND …
More over the weekend but … THAT is all for now. Off to the day job…


ISRAEL 100%