Good morning … A couple bullets from inbox earlier this morning courtesy of PiQ’s overnight news roundup (a valuable resource, IMO) …
Yields and the Dollar gapped lower on the open after the implied probability of Harris winning the election on betting websites rose over the weekend; she is now implied at 44% and 48% on Polymarket and Kalshi, respectively, from 39% and 44% on Friday.
Harris leads among likely voters in Iowa, a state Trump won by more than eight points four years ago, according to the closely watched Selzer poll that suggests women in the Midwest could be driving a late surge in support for Harris. (FT)
… Oil has gapped open higher amid Iran tensions and after OPEC+ agreed to delay a planned December oil output increase by one month, as weak demand notably from China and rising supply outside the group maintain downward pressure on the oil market. (RTRS)
… with bond markets closed EARLY (Japanese holiday) thought important to lead with FT story (I’ve taken liberty to provide link) given some desire to offer a direct read through TO UST market.
That in mind, and with long bonds in a longer-term context HERE, 10s over the weekend HERE and today I’ll lead with a quick look at the front-end — 3s — ahead of this afternoons $58bb offering
3yy DAILY: TLINE (and psychologically important) levels of support nearby …
… as momentum rolled over from overSOLD making 3s look buyable ahead of election, the Fed and whatever ELSE one might conjure up …
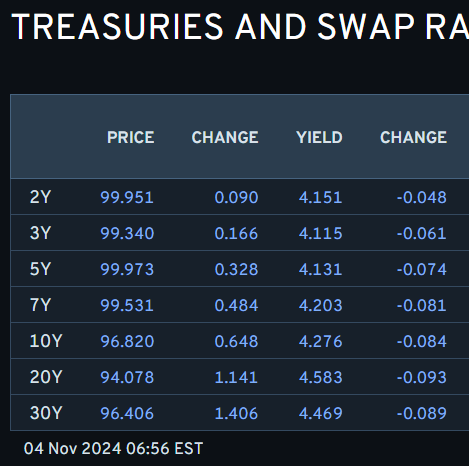
… AND i’ll quit while I’m behind into one of the more consequential weeks ahead so as NOT to interrupt the bond market BID in place … here is a snapshot OF USTs as of 656a:
… HERE is what this shop says be behind the price action overnight…
… WHILE YOU SLEPT
… and for some MORE of the news you might be able to use…
NEWSQUAWK: US Market Open: DXY and US yields softer as Trump trades unwind after weekend polls … USTs benefit from a scaling back of the Trump trade, whilst Bunds lag; reports suggesting that China’s NPC is reviewing local government debt swaps weighed on the complex … USTs enter the election week higher, bolstered by polls showing that Harris could clinch victory in Iowa and with betting odds shifting towards a Harris victory overall. Given this, the Trump Trade is paring with USTs 15+ ticks higher at best to a 110-16+ peak. Thereafter, the complex was weighed on amid reports that China’s NPC is reviewing local government debt swaps; USTs trimmed back to a 110-09 trough, but still firmer on the session.
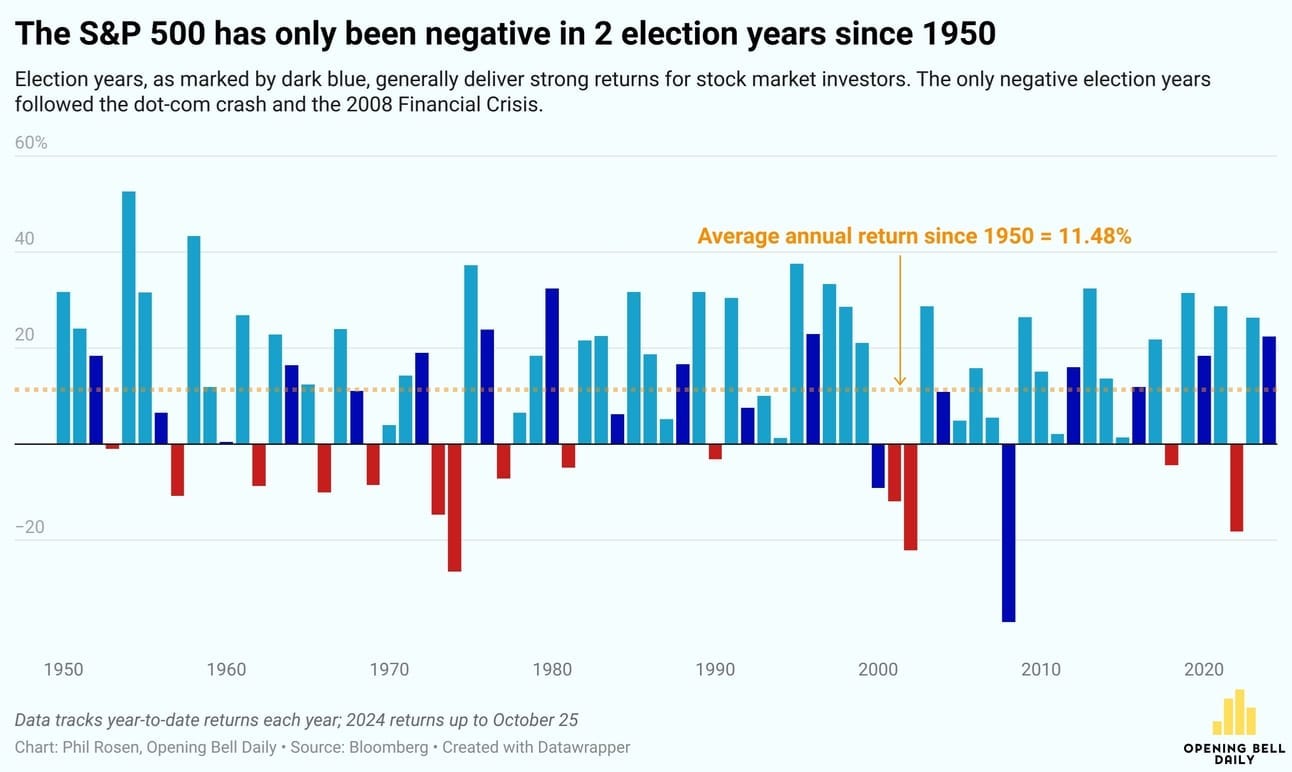
Opening Bell Daily: Wall Street vs. Election - What Wall Street's watching for the Trump-Harris showdown. Top investors, strategists and forecasters explain the biggest risks to markets and the economy under a new White House.
… What it means for stocks Market-watchers generally consider political gridlock to be the most bullish scenario for equities.
That said, the oldest quip in markets is worth remembering here: When you zoom out, stocks usually go up.
To that point, Callie Cox, chief market strategist at Ritholtz Wealth Management, pointed out that market crashes, bull-runs, and recessions have occurred under both political parties.
In fact, since 1900 every president except George HW Bush has presided over a bear market.
“Right now, in the midst of deafening political noise, the best thing you can do is focus on your [investment] goals, not on the headlines,” she said.
Jamie Cox, managing partner at Harris Financial Group, told me he ultimately isn’t worried about the election’s impact on markets.
“The larger positive market forces remain present, intact, and far more important [than the election],” Cox said. “A growing economy, a more favorable interest rate trajectory, and an innovation wave that’s like an industrial revolution with AI.”
Finviz (for everything else I might have overlooked …)
Moving from some of the news to some of THE VIEWS you might be able to use… here’s SOME of what Global Wall St is sayin’ … in addition TO what little was offered over the weekend (HERE) …
With moderate inflation, the labor market near full employment, and FOMC participants apparently viewing policy as restrictive, we expect the FOMC to cut rates 25bp on Thursday. We retain our baseline projection that the FOMC will lower rates again 25bp at the December meeting, but see growing risks of a December pause.
… For 2025, we expect the FOMC to cut rates three times by 25bp, in March, June, and September, with risks tilted toward a higher rate path, reflecting risks of inflation stalling above the 2% target and renewed tightening in the labor market, with immigration flows moderating. We expect core PCE inflation to settle at 2.3% Q4/Q4 in 2025 and the unemployment rate to decline to 3.9% by Q4 2025, and think that concerns about the lack of further progress on inflation in H2 25 will lead the FOMC to pause its rate-cutting campaign after the fed funds rate target ranges reaches 3.50-3.75%. We view risks around our forecast rate path as tilted to the upside, especially if inflation stalls at a higher level than we expect.
Figure 1. Market expectations of rate cuts diminished after the September payroll report showed a resilient labor market
…We arrive at this monumental election week with bond markets having been on shaky ground of late with October seeing the worst month for the Bloomberg Global Agg since September 2022 when inflation was only just off its peak, the Fed was still raising by 75bps clips, and the Truss budget and UK LDI pension crisis had exaggerated the sell-off. Last week 10yr US yields rose +14.4bps with +10bps of it on Friday and a little surprisingly after a soft, albeit weather impacted, payrolls report. The most impressive part of last week's price action though was that it occurred alongside prediction markets pulling back from the Red sweep expectation that peaked the previous week. As an example, last weekend Trump has a probability of 61% on PredictIt versus 52% on Friday and 48% on Saturday while slightly rebounding this morning to currently stand again at 51%. On Polymarket.com Mr Trump was as high as 67% on Wednesday but this dropped to around 59% on Friday and over the weekend fell to as low at 53% (currently 56%), with a Republican sweep now at 39% having been as high as 49% last Tuesday. The dip over the weekend came after a highly anticipated Selzer De Moines Register Iowa poll was released on Saturday. The poll saw Harris with a 3-point lead in a state where polling averages have Trump 9 points ahead. Many political commentators had been waiting for this poll as it has one of the best track records amongst pollsters with FiveThirtyEight describing Selzer as "the best pollster in politics".
Anyone who has read "Fooled by Randomness" will be aware of Nassim Taleb's view that its often difficult to assess the difference between luck and skill when it comes to someone with a good track record. Someone always has to have the best track record. That could be skill or it could be say choosing heads five times in a row and getting it right. For now Treasuries are closed due to a Japanese holiday but long bond futures are up over a point which recoups more than half of Friday's losses. The dollar index, which has been correlated to some degree with a Trump victory, is down just over half a percent and flirting with the largest drop in two months…
DB: Mapping Markets: How markets reacted to each US election since 2000
Ahead of the US election tomorrow, we look at how markets reacted to the six previous elections and what was going on at the time.
To be honest, the reactions vary considerably. Of the six elections since 2000, the S&P 500 was up in three cases by the end of November, and down in the other three. 10yr Treasury yields were down in four and up in two.
It’s worth bearing in mind that markets already account for expectations. So in 2008, there was little direct reaction, as Obama’s victory was widely expected. By contrast in 2016, Trump’s surprise victory was a big shock that led to a major rise in Treasury yields.
In addition, other events are happening at the same time. Markets were buoyant after 2020, but that was supported by Pfizer’s vaccine announcement the following week. In 2012, markets struggled as fears grew about the US fiscal cliff and Greece’s situation during the sovereign crisis. And back in 2008, markets plummeted amidst the Global Financial Crisis. So the election isn’t the only variable, and this week there’ll be a lot of focus on Thursday’s Fed decision as well…
Lessons from the Japanese election a week ago may be informative as we think about the US election. Immigration, tariff, and fiscal policies are in focus.
The US employment report last Friday was weak, but distorted. It does not add much useful information on the US economy, although it serves as a reminder that real time economic data is not reliable and is frequently revised. Federal Reserve Chair Powell’s strategy of data dependency depends on undependable data…
…US September factory orders and revised durable goods orders are due. These are not likely to sway expectations about the economic outlook, and have little political significance (politically perceptions matter much more than reality, and a third of US voters have already cast their votes).
Some of our best friends are technicians. Ed was at Prudential Equity Group at the same time as Ralph Acampora, the renowned market historian and technical analyst. Ralph's analysis often confirmed Ed's fundamental analysis. So in our spare time we like to follow the charts for clues about the future, and we occasionally spot trends that seem to support our forecasts.
Currently, we are focusing on the bond, oil, gold, and Nasdaq charts, which look bearish, bearish, bullish, and bullish respectively:
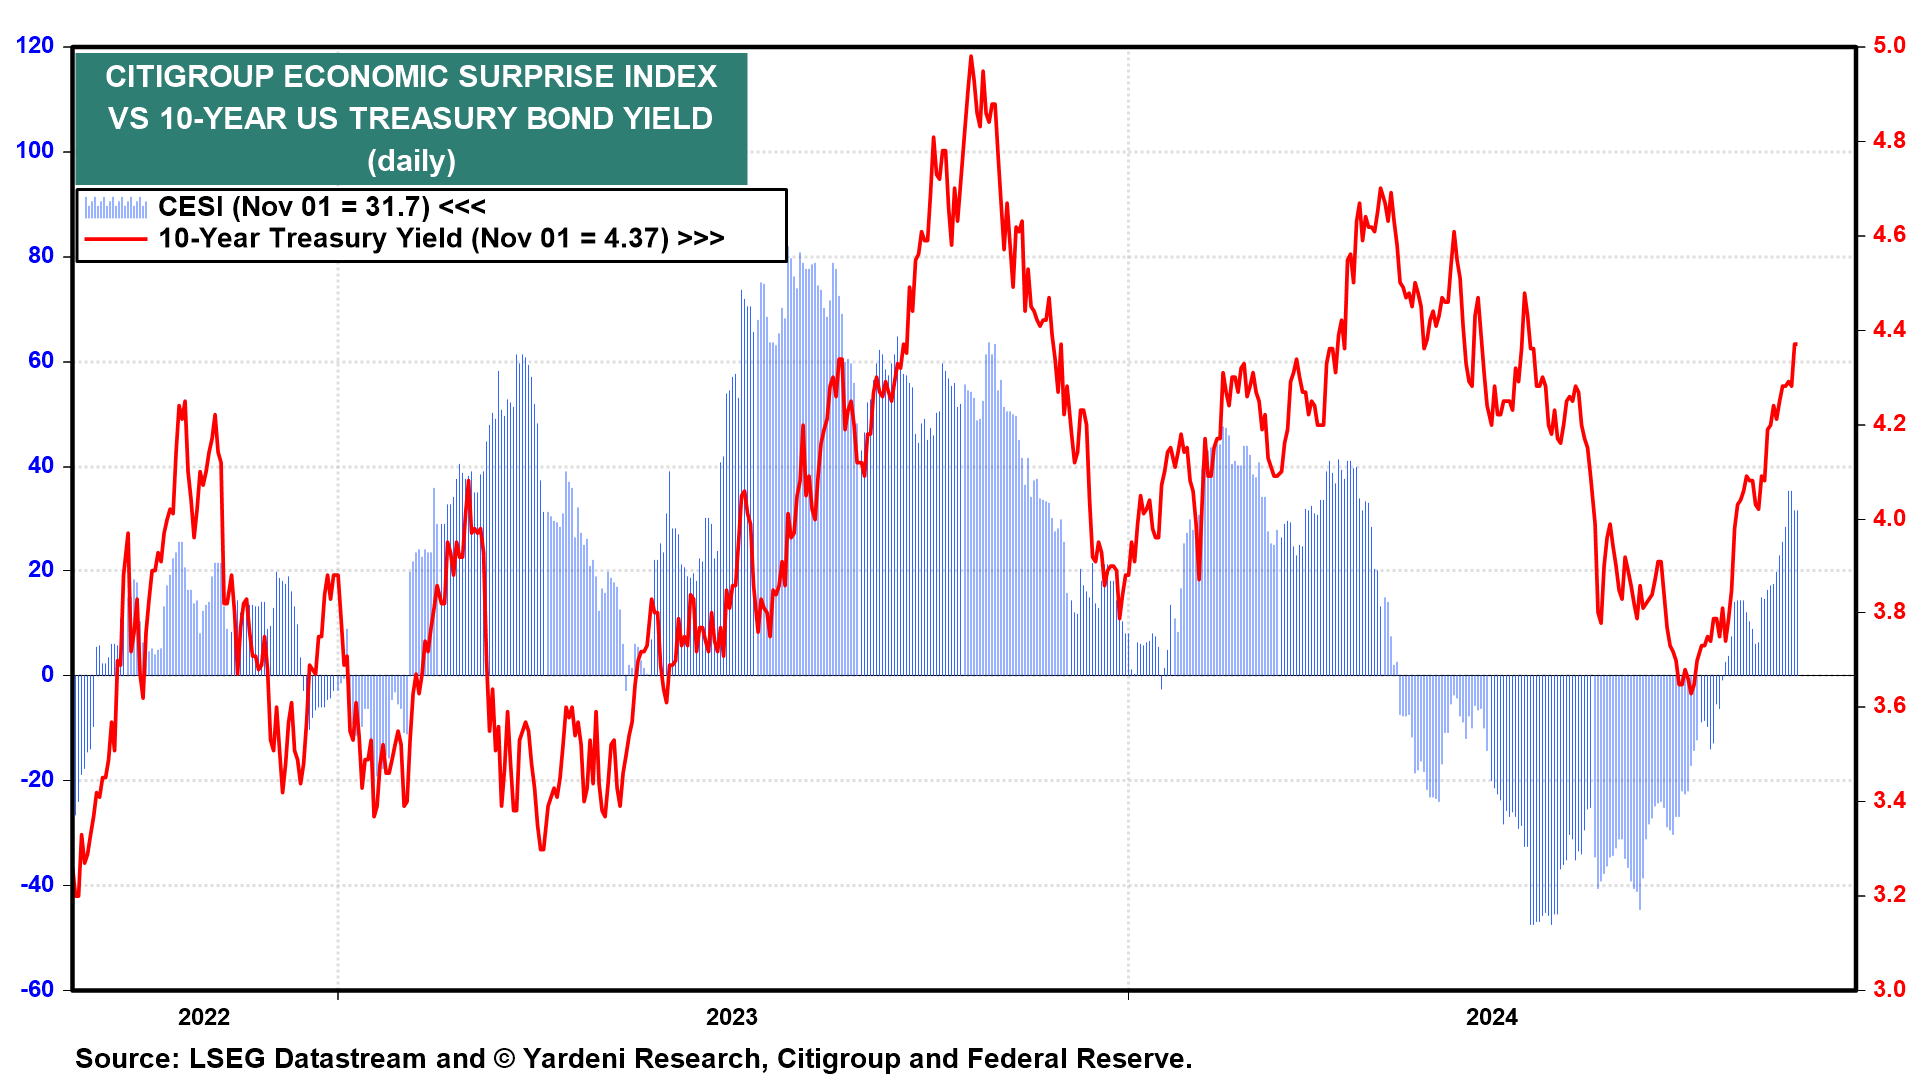
(1) Bonds. Our August 19 Morning Briefing and webcast were both titled "Get Ready To Short Bonds?" The 10-year bond yield was 3.86% at the time (chart). It fell to 3.63% on September 16. Since then it has jumped to 4.397% this evening. It broke right through a resistance line at 4.26%. If it breaks through 4.40%, the next stop could by 4.70%, which was the April 25 peak. If that doesn't hold, then a test of the 5.00% level is possible. That was last year's peak on October 19.
The bond yield has been rising on better-than-expected economic numbers, as we anticipated (chart). We actually turned more bearish on bonds after the Fed cut the federal funds rate by 50bps on September 18, figuring the Fed was stimulating an economy that didn't need to be stimulated. That's especially true since fiscal policy remains stimulative and may continue to be so with the new incoming administration. The bond market seems to agree with our assessment.
(2) Oil. Often in the past, the bond yield has had a positive correlation with the price of oil mostly because the expected inflation spread between the 10-year nominal bond yield and the comparable TIPS yield is highly correlated with the price of oil, which makes sense.
The blockbuster event in the week ahead is Tuesday's presidential election. We're rooting for gridlock, or a divided government. Both parties seem intent on passing policies which would widen the federal government budget deficit that's already too wide. Notwithstanding the stimulative outlook for fiscal policy, the Fed is widely expected to cut the federal funds rate (FFR) by 25 bps on Thursday to a range of 4.50% to 4.75%.
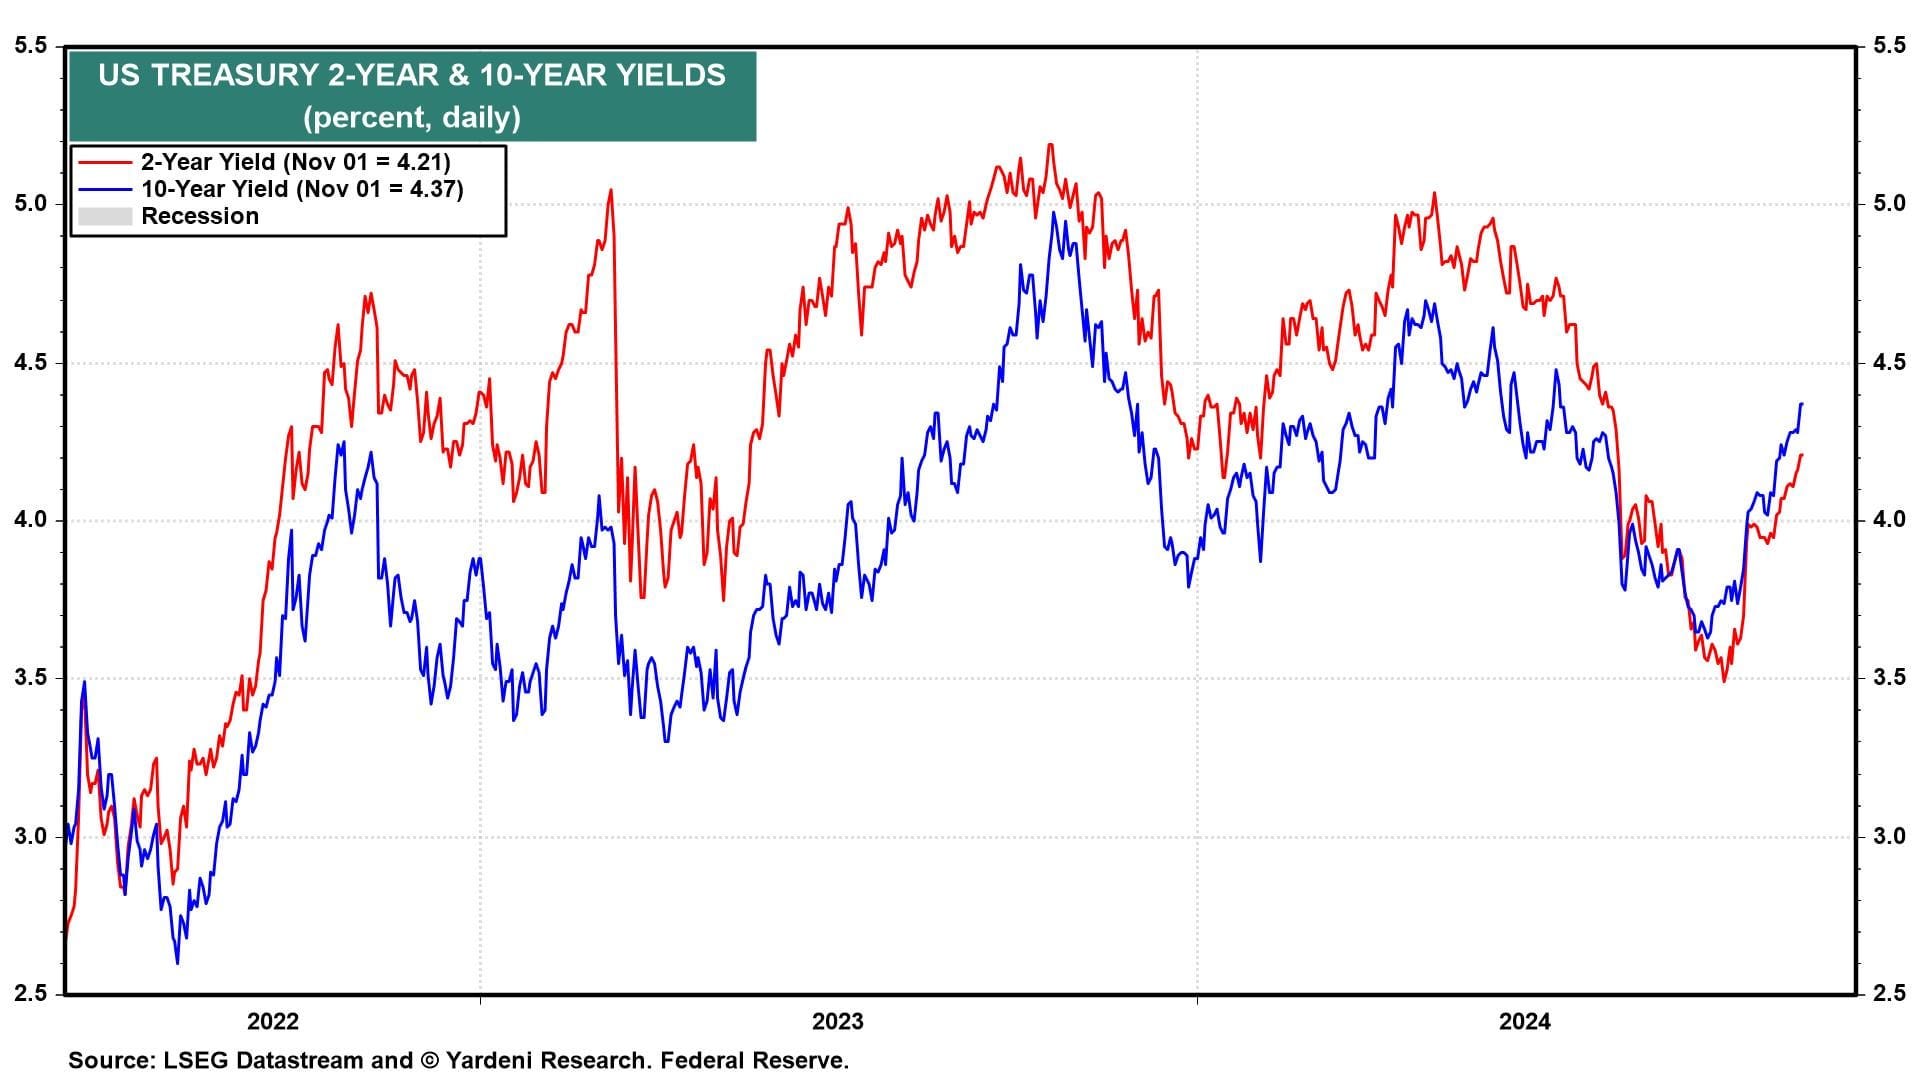
The Bond Vigilantes have been voting early (and voting often) by selling US Treasury notes and bonds. The 2- and 10-year Treasury yields are up 62bps and 75bps, respectively, since the Fed cut the FFR by 50bps on September 18 (chart).
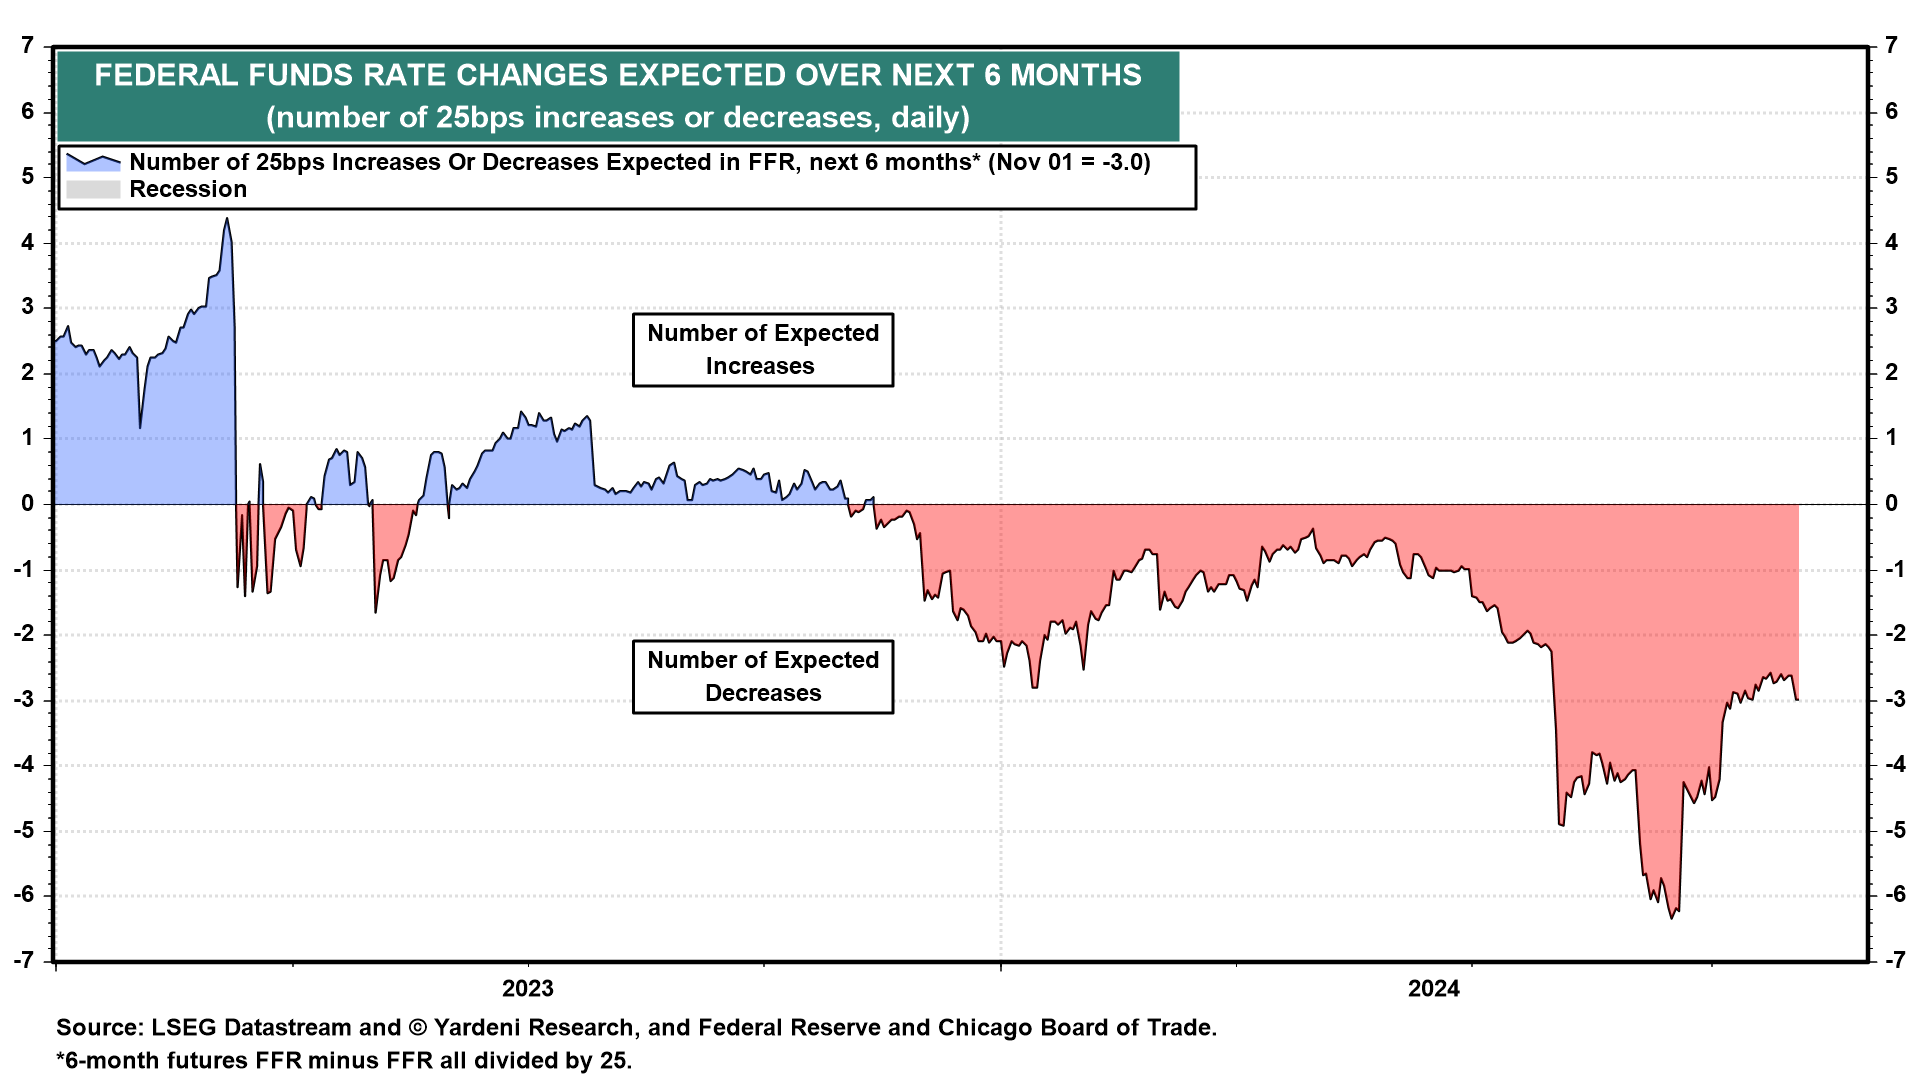
At his presser on Thursday, Fed Chair Jerome Powell might try to justify cutting the FFR again by pointing to the recent weak manufacturing PMI and payroll employment numbers and the falling PCED inflation rate. Bond yields might continue to rise in response, or they might fall if Powell signals that the Fed will pause further rate cuts to assess the strength of the economy. As of Friday, the FFR futures market expects three more 25bps cuts over the next six months (chart).
… And from Global Wall Street inbox TO the WWW …
Bloomberg: Investors From Stocks to Crypto Brace for US Election Volatility
One-week dollar-yuan volatility hit a record high last week
…Rates
Positioning in the Treasuries market over the past couple of weeks has been focused toward traders de-leveraging positions in futures, skewed toward long liquidations amid rising expectations of a post-election boost to fiscal stimulus, swelling the supply of Treasuries. The result has seen open interest, or the amount of positions held by traders, drop sharply in 10-year note futures since the start of October as yields have climbed.
The de-risking, or traders taking chips off the table, has also been reflected in the cash market, where the latest survey from JPMorgan Chase & Co. shows clients reducing both long and short positions, as neutrals rise. In the options market for Treasuries, tail-risk hedges sit at higher yields and a bigger bond market selloff versus current levels. The 109.50 December 10-year put is notably populated, equivalent to a yield of approximately 4.5% and around 25 basis points higher than current levels.
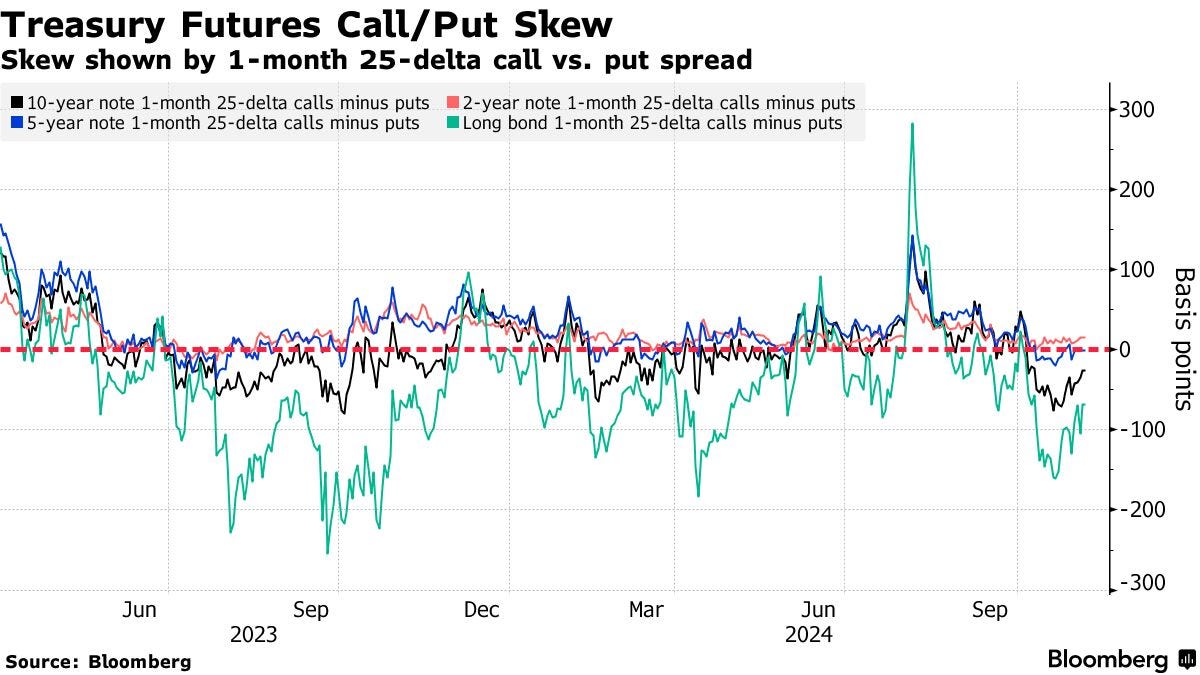
“Election volatility premium is most pronounced in the bond market on long-end rates, which we believe reflects concerns over higher fiscal risks on a sweep outcome,” said Tanvir Sandhu, Bloomberg Intelligence’s chief global derivatives strategist. “The skew suggests demand for hedges using payer swaptions against a selloff in long-end rates.” …
Bloomberg: Prediction markets pull a November Surprise on Trump His spread over Harris is vanishing, while Iowa hasn't been under the lights like this since ‘Field of Dreams’
…The initial response to the jobs datawas an understandable to rush to buy bonds, taking the 10-year yield down almost 10 basis points. As soon as that had happened, however, traders seemed to spy an opportunity to get out of bonds, and did so. The ISM had no effect. Yields aren’t back to last year’s highs, but the trend is upward once more, despite the jumbo 50-basis-point cut in September:
The higher yields attracted money to the dollar….
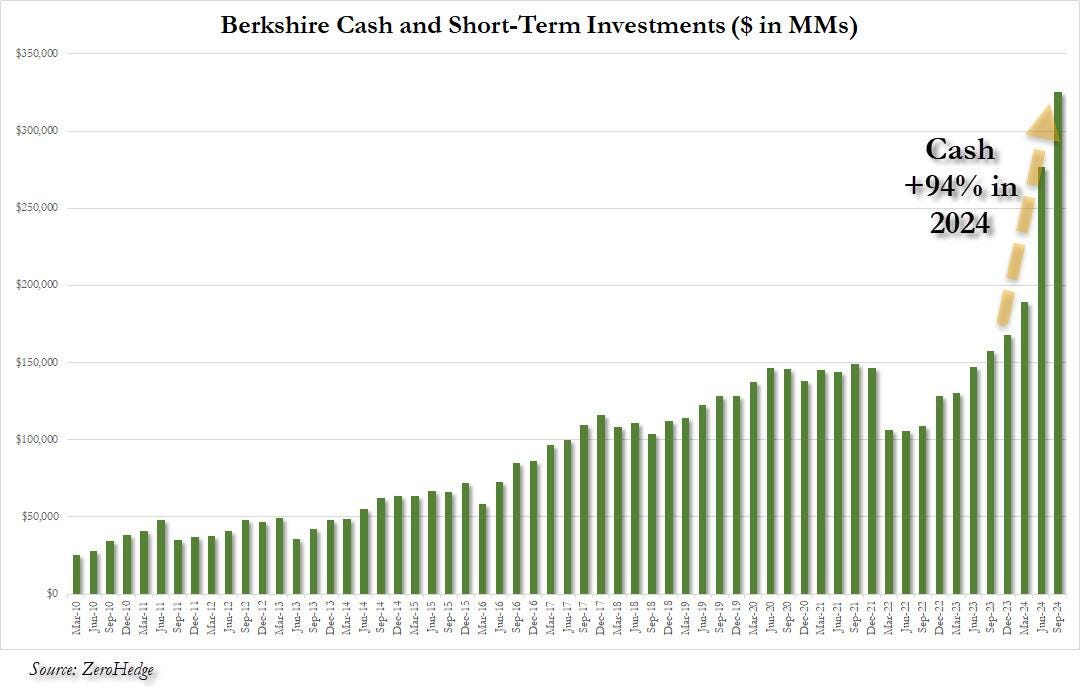
ZH: Buffett Calls The Top: Berkshire Dumps 100 Million Apple Shares As Unprecedented Selling Spree Boosts Cash To Record $325 Billion Dollars
…That was just the beginning, however, and this morning we subsequently learned that through the end of Q3, Berkshire's unprecedented cash build continued, and the world's largest conglomerate added another $48 billion to its cash - through both "harvesting" (i.e., selling of existing holdings) and cash from operations, taking it to a record $325.2 billion, or nearly a quarter trillion in cash. As shown for context in the chart below, Berkshire has nearly doubled its cash holdings from $168 billion at the start of the year to a staggering $325 billion 9 months later, up 94%!
The bulk of the new cash came from sales: in the third quarter, Berkshire sold a net $34.6 billion worth of stock, following the record $75.5 billion in Q2 liquidations, the bulk of which we now know came from Buffett's sale of half his Apple shares. In other words, the third quarter was the 8th consecutive quarter in which Berkshire has been a net seller of stocks…