Good morning … Narrative ping pong will continue on into this mornings NFP, through the weekend and next weeks election.
Starting with this mornings NFP — a strong data point will be much harder to dismiss while a weak data point (BA strike, Mother Nature) has already been discounted.
A longer term — MONTHLY — look at long bonds …
30yy MONTHLY: interesting dynamic shaping up … what a MONTHLY close …
… momentum crossed and leans BEARISHLY while bonds trade TO and HELD ‘support’ (up near 4.60%) which makes the whatever NEXT even more funTERtaining …
That in mind, we should ALL be trying to look thru the noise but that is hard. At least for me — as a former stratEgerist who was paid not by the word (as many / most on Global Wall are) but rather by the deed (of a TRADE), hard not to get caught up in the minute by minute and play by play … while I’ll TRY to keep that in mind, it is where / why this ‘Stack all has been created — a way for me to keep up with developments in the micro and THEN try to fit them into my very own ‘macro’ … if I can help as YOU do the same, well … terrific …
That in mind, some input yest for us to see whatever it is we wanna see…
ZH: Fed's Favorite Inflation Indicator Hotter Than Expected In September
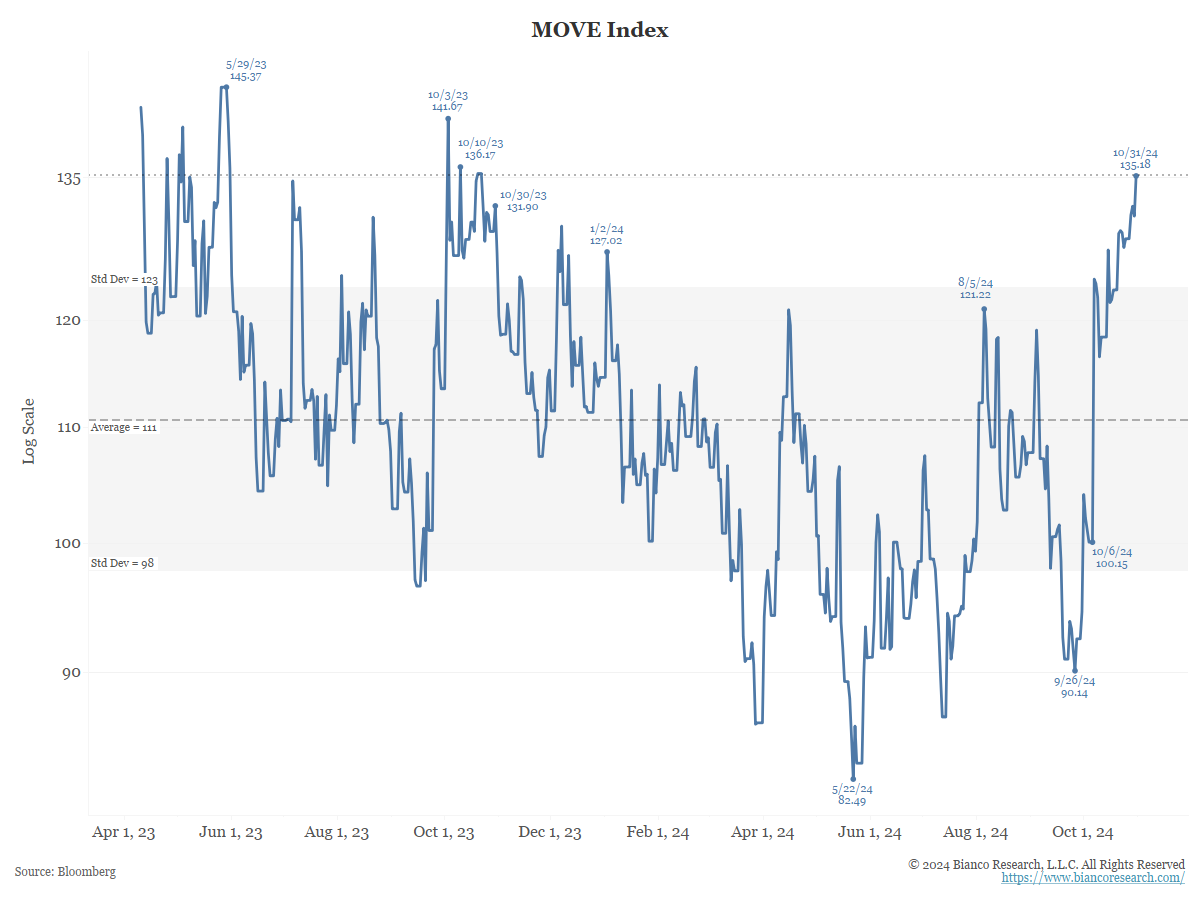
It closed today at a new 1-year high and the second-highest level in 17 months.
The bond market is pricing in extreme volatility in the near future.
A quick and dirty rule is to divide the MOVE by eight as a way to convert it to a basis point range.
So, a MOVE of 130 to 135 suggests daily ranges of 16 to 17 bps (135/8).
Remember, the MOVE is what is expected going forward.
This is not far from what we have seen in the last few days.
Over the last three days, we have seen a 10-year yield decline of 14 bps (green) and then a rise of 13.44 bps (red).
So, a few basis points below what the MOVE suggests is coming (16 to 17).
So, the MOVE suggests we should expect 10-year yield ranges of 14 to 17 bps daily.
Payrolls tomorrow.
If the 10-year yield moves 15 bps off this release, Wall Street will tell us that is a big deal. In this environment, it is not. It is now an average day.
Perspective
… here is a snapshot OF USTs as of 657a:
… and for some MORE of the news you might be able to use…
NEWSQUAWK: US Market Open: Equities firmer following strong AMZN/INTC results & DXY gains ahead of US NFP … USTs are a handful of ticks lower, 110-09+ base matches the week’s opening level and is 6+ ticks clear of Thursday’s WTD base. Focus entirely on Payrolls, forecast range of -10k to +200k, with ISM Manufacturing thereafter.
Finviz (for everything else I might have overlooked …)
Moving from some of the news to some of THE VIEWS you might be able to use… here’s SOME of what Global Wall St is sayin’ … and again, without further commentary, a few items on MY reading list which may be of some interest to you as well …
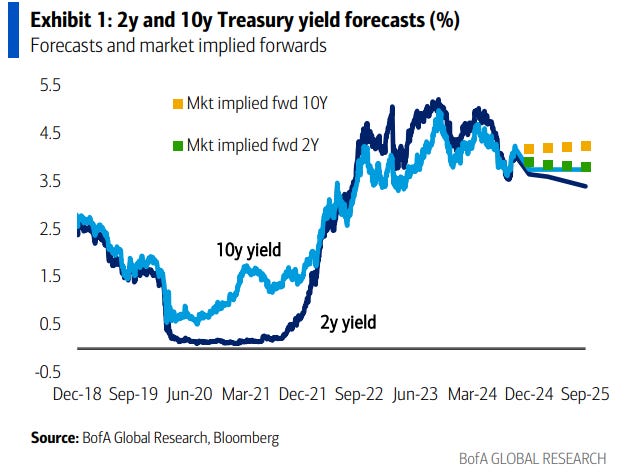
… Interest rates: US10yr at 3.75% at end-24 and end-25 Since last month, we revised our UST forecasts in-line with our US economists Fed call change & largely revert to our projection pre-Sept FOMC. We now see 10Y at 3.75% by end '24 & end '25
…Forecasts: revise 10Y higher to 3.75% at end ’24 & end ‘25 We revise our UST forecasts in-line with our US economists Fed call change and largely revert to our projection pre-Sept FOMC. We now see 10Y at 3.75% by end '24 and end '25. Our forecasts are below the forwards, consistent with expectations for further economic moderation. Our long end forecasts include gradual cheapening and higher rates to reflect tighter spreads and supply / demand issues
BARCAP: September's strong consumer spending bodes well for Q4
Real PCE accelerated to 0.4% m/m in September, reflecting a surge in goods spending. With income gains moderating, on balance, in recent months, the saving rate dropped 0.6pp during Q3 to 4.6%. Nonetheless, we think fundamentals point to sustained trend-like spending gains in the coming quarters.
BARCAP: September PCE inflation firms, as expected
Core PCE prices rose 0.25% m/m in September, keeping the annual rate at 2.7%. Upward revisions to Q3 data were spread across July and August. The data boosted our Q4/Q4 core PCE estimate to round up to 2.8%, higher than the FOMC's September projection.
BARCAP: Soft September ECI reassures that underlying inflation remains on track
The Employment Cost Index decelerated to 0.8% 3m in September, the slowest pace since early 2021, reflecting softening of private sector wages. This should reassure the Fed its inflation goals are on track despite recent firming of consumer prices. Our model infers that the underlying pace of wage gains is 3.5% annualized.
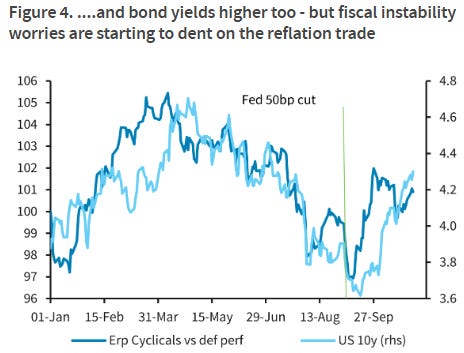
With a Trump win largely priced in, but not a done deal according to the polls, market nervousness is understandable. Despite volatility and mixed earnings, pro-cyclical rotation continues under the hood as eco surprises rebound. But surging rates due to fiscal instability worries is starting to dent on the reflation trade.
Markets finished October on a rough note yesterday, with the S&P 500 (-1.86%) posting its biggest decline in nearly two months, whilst UK assets lost significant ground thanks to investor concerns about Wednesday’s Budget. We’ll have more to say in our monthly performance review out shortly, but the declines mean that Bloomberg’s global bond aggregate has just experienced its worst month since September 2022, back when inflation was still raging and the Fed was hiking by 75bps each meeting. And for equities it’s been a lacklustre month as well, with the S&P 500 losing ground for the first time in six months…
…The other big sell-off yesterday happened in the UK, as markets reacted negatively to the extra borrowing announced in the previous day’s budget. Specifically, the spread of 10yr gilt yields over bunds widened by +9.4bps to 206bps, which is their biggest gap since October 2022, back when Liz Truss was still Prime Minister. Moreover, in absolute terms, the 10yr gilt yield was up +9.5bps to 4.44%, which is its highest level since November 2023, and at the height of the sell-off they’d been up as much as +18bps intraday to 4.53%. So it was only thanks to the late recovery that things weren’t even worse. The effects were clear across other asset classes too, and sterling was the worst-performing G10 currency yesterday, weakening by -0.49% against the US Dollar to $1.2899. And with the extra borrowing announcements, investors also dialled back their expectations for rate cuts from the Bank of England, so by the close they were pricing in 80bps of rate cuts by the June 2025 meeting, down from 86bps on Wednesday…
October was a weak month for markets, with bonds and equities losing ground across the board. In fact, it was the worst month for global bonds since September 2022, back when inflation was still raging and the Fed was hiking by 75bps. That was partly because economic data continued to surprise on the upside, which pushed back fears of a sharper downturn and led investors to dial back the likelihood of rapid rate cuts. But fiscal policy risks were also back in focus around the world, particularly with the US election coming up in November, whilst geopolitics was in the spotlight given events in the Middle East. In the meantime, equities also slipped back, with the S&P 500 losing ground for the first time in six months…
…All this put sovereign bonds under pressure in October, with US Treasuries (-2.5%) seeing their biggest monthly decline in total return terms since September 2022. In addition, there was an increasing focus on fiscal policy risk, with the IMF’s fiscal monitor in October projecting that global public debt would exceed $100tn in 2024. In the US, that coincided with prediction markets placing a growing probability on a Republican sweep scenario, which is seen as raising the likelihood of fiscal stimulus relative to divided government. Meanwhile in the UK, gilts also struggled (-2.7%) as the government announced additional borrowing in its Budget, with the spread of 10yr gilts over bunds widening +18bps in October to 206bps, the highest since October 2022 when Liz Truss was PM…
…Which assets saw the biggest losses in October? Sovereign bonds : With growing optimism about the economic outlook, investors moved to price in fewer rate cuts over the months ahead, which hurt sovereign bonds. Moreover, there was a growing focus on fiscal policy risk across several countries. So US Treasuries (-2.5%) posted their worst monthly performance since September 2022, and Euro Sovereigns (-1.0%) had their worst month since April…
DB: Data DBrief: A cautionary chart on US inflation
This morning's core PCE was reasonably positive at face value. The monthly print of 25bps was close to expectations; the 3-month annualized rate is roughly 30bps from target; and the year-over-year rate was a fraction of a basis point away from ticking down to 2.6%. Inflation thus continues to show bumpy progress.
Despite this progress, we highlight a reason to be cautious about the inflation outlook: The seasonal pattern of prints looks similar between 2023 and 2024. Indeed, the 3-month annualized rate is now higher than at this point last year. If core inflation once again accelerates in Q1 2025, in line with evidence of residual seasonality, it would imply meaningfully less scope for the Fed to cut rates next year, particularly if fiscal support and tariffs are on the horizon (see "Looking beyond the next 25bps to '25: The Fed outlook post election").
The point of caution is that residual seasonality could continue to prevail. If core inflation once again accelerates in Q1 2025, year-over-year rates for core PCE will not plunge as much as many anticipate. This scenario would imply meaningfully less scope for the Fed to cut rates next year, particularly if fiscal support and tariffs are on the horizon (see "Looking beyond the next 25bps to '25: The Fed outlook post election").
DB: Supply vs. demand shocks in the US labour market and monetary policy
The quit rate remains the best indicator of labor market slack, as it correlates most strongly with wages. However, it cannot, in isolation, distinguish between supply and demand shocks. The trends in the unemployment rate, participation rate, and the Fed Senior Loan Officer Survey suggest that the labor market experienced a negative supply shock during covid and a positive supply shock more recently.
A supply-side-driven decline in wages should have two theoretical implications for monetary policy: (a) it would enable the Federal Reserve to reduce its policy rate toward neutral (as inflation is converging to target) and (b) it would raise the neutral rate (as potential growth is higher). Conversely, a reversal of the positive supply shock to the labor market could force the Federal Reserve to be more cautious in easing policy in the short term, but allow for greater rate reductions later.
No single data point in gold's third quarter demand fully explains the cumulative 33% rally this year, but we think the following clues point to relevant features.
Annualised central bank demand this year would be down only -19% from 2022, which itself was a 150% rise from 2021. This means that the last three years of central bank demand are the three highest in data from 1977.
Asian gold demand typically provides a balancing force, yielding to price insensitive demand. However there may be a limit to how flexible this demand can be, since it is now down to a 35% share of demand from 48% in 2022 and 2023. August and September data hint at the possibility of a steeper demand curve.
In the last several months, the rally since August has seen participation from speculative futures and ETF investors, with ETF investment nearly breaking into positive year-on-year terms for the first time since 2022.
Despite gold's continuing out-performance we see no immediate reasons to exit long Feb'25 gold futures. Performance since September's FX Blueprint is +3.9%, exceeding the typical +2.5% over a 4m holding period during Fed easing cycles.
DB: US Economic Chartbook - Everything you need to know for election week
This final installment of our 2024 pre-election chart book presents a detailed guide to the November 5 US election. We provide a comprehensive overview of the"swing states" that will decide the election, a list of bellwether counties to pay attention to within those states, as well as a precise recap of the time line for vote reporting and media projections of the winner in 2020. We cover the rules for challenging the voting results in the swing states as well as rule changes at the federal level adopted in the wake of the last election.
As our section on the latest polling outlines, the race between Vice President Harris (Democrat) and former President Trump (Republican) is a near dead heat – both at the national level and within the seven swing states that will decide the outcome of the electoral college. The median margin of victory in Pennsylvania, Georgia, North Carolina, Michigan, Arizona, Wisconsin and Nevada – the seven states that have decided the last two elections – has been 1.25 percentage points with a range of 5.1% to 0.2%. Indeed, Trump's 2016 victory came down to roughly 78k votes across PA, MI and WI, while Biden's win in 2020 hinged on 43k votes in GA, AZ and WI.
This year, the state of Pennsylvania is setting up to be crucial with respect to attaining the 270 electoral college votes needed to win, which is why we are unlikely to know the outcome for several days if the 2020 time line for counting votes and declaring a winner in that state repeats. If states are disputed, we may not know until December 11, which is the federal deadline for states to certify their electors.
The Congressional election outcome will be critical for the policy outlook as well. While Republicans appear poised to gain the majority in the Senate, the House of Representatives could go either way. Historically, the party of the President has tended to carry the House, though this is not always the case – 2012 being the most recent example.
Following the analysis of the election, we turn to the potential economic and financial implications of its outcome. This includes an assessment of the possible paths for fiscal policy, trade, immigration and regulation as well as their implications for economic growth, the fiscal deficit and financial markets. Lastly, we provide a curated list of election-related research from across DB's global platform.
ING: US Goldilocks story gives the Fed scope to cut rates another 25bp
The labour market and economic activity remain in decent shape while inflation pressures are subsiding. This gives the Federal Reserve room to gradually cut interest rates further, thereby giving the economy more breathing space to keep growing robustly
JPM: Flows & Liquidity Is there room for further short covering/position unwinding? 30 October 2024
From a price point of view, we still find that markets overall price in a relatively modest probability of a Trump win with the exception of credit markets.
From a positioning point of view , we see room for shorts to be covered and for positions to be unwound further across equities, rates, fx and credit in the case of a clear Trump win.
The growth in US broad liquidity or M2 money supply looks set to continue, even if QT remains as headwind into next year. In turn, this should provide some support for financial assets even as cash allocations overall look rather low.
… In the rate space, our futures position proxy based on cumulative open interest changes multiplied by the sign of the price change each day suggests that the long duration base built up in 10y UST futures between July and September 2024 has been cut by half. In other words, there is room for the other half to be unwound in a Trump win (Figure 5) In the inflation breakeven space, the short interest of the TLT ETF does not look particularly elevated vs that of the TIP ETF, thus suggesting there is room for investors to put on long inflation breakeven trades by shorting the nominal bond TLT ETF vs the index-linked bond TIP ETF (Figure 6Short inesohTIP andLTUS EFs).
Retail investors boost the “debasement trade” by buying bitcoin and gold ETFs ahead of the US election.
Short-lived acceleration in core PCE inflation with still strong spending. ECI decelerated and initial claims came down after the hurricanes. We see gradually slowing consumption and continued disinflation ahead, consistent with two 25bp cuts the rest of the year.
Strong growth but inflation running closer to target lead the Fed to cut by 25bp. Chair Powell is expected to recognize recent economic strength. Our strategists maintain long MBS basis.
Key expectations
The FOMC cuts the fed funds rate by 25bp to 4.375%. The FOMC statement upgrades its assessments of growth and continues to recognize progress on inflation.
In the press conference, we doubt Chair Powell commits to a size or cadence for future cuts; decisions will depend on the data.
We look for 25bp cuts in November and December.
Our rates strategists suggest investors remain neutral on US Treasury duration and yield curve shape ahead of the US general election and November FOMC meeting.
Our FX strategists do not expect significant USD moves from the November FOMC, but estimate USD positive risk premiums are largest against AUD, CAD, and JPY.
On the agency MBS side, our strategists remain long the mortgage basis and prefer buying production coupon Ginnies and conventionals.
Controlling long term inflation is easy, as long as societies are prepared to pay the social, political and economic cost required to implement price stabilizing policies. If inflation pressures increase, the cost of keeping it under control will increase.
There are five frequently voiced fears about what may drive longer term inflation: global trade; aging populations; technological change; government debt; decarbonization. These could raise the cost of keeping inflation under control, and will certainly change relative price levels.
Each of these forces is also a driver of disinflation. Some of these disinflation forces are likely to be quite powerful over time and should outweigh any inflation pressures. Unless politicians really mess things up, central banks are likely to find inflation control easier over the longer term.
It is US employment report Friday. This report is distorted by hurricanes, strike action. It and the fact that the data is always wrong. Taking a broad sweep of economic data, the signs are that the labor market is doing fine. The ongoing strength of US consumer spending suggests little fear of unemployment, for instance.
Does today’s data matter politically? The answer to the fabled question “are you better off than you were four years ago?” is yes, measured by real income per person, but it is difficult to sell that to US voters, according to opinion polls. Politically, perceptions matter more than reality, and perceptions are shaped by anecdotal evidence from friends and family, and whichever news channel one watches…
Wells Fargo: Consumer Spending Intact, but So Too is Core Inflation
Summary Consumers keep spending which is helping propel real GDP growth in an environment where it does not take much to spook investors. The treat is still-solid growth can help the Fed achieve a soft landing, but the trick is that could work against inflation hitting its 2% inflation target.
Wells Fargo: Employment Cost Growth: The Sweet Spot
Summary The latest reading on employment costs should boost policymakers' confidence that the labor market is no longer a threat to returning inflation to 2%. The Employment Cost Index advanced at a 3.2% annualized rate in the third quarter, bringing the one-year change in wages & salaries and benefit costs down to 3.9%. Amid a pickup in productivity growth this cycle, that leaves labor compensation rising at pace consistent with both the Fed's inflation goal and solid real earnings for workers.
Some of the air is coming out of the AI trade. Super Micro Computer hasn't been super recently. It fell 12% today after auditor Ernst & Young resigned due to inaccurate financial reporting, and is now down 66% over the past six months (chart). Super Micro Computer is a key vendor for building out Nvidia-based clusters of servers used for training and deploying AI models
Meta and Microsoft fell 4.1% and 6.0% today, respectively. Yesterday's earnings calls show that Meta's AI-related capex continues to grow while the ROI isn't obvious. Microsoft is struggling to add more cloud computing capacity to meet surging AI demand. This is a case of companies not keeping up with lofty growth expectations and valuations rather than a slowdown in AI spending, cloud computing, or the broader economy. On the macro front, things look super, in our opinion.
Here's our takeaways from today's key macro data:
(1) Inflation. The headline PCED inflation rate fell to 2.1% y/y in September. That's good news! But US Treasury yields remained elevated. That's likely because the core PCED rate was 2.7% y/y while the "supercore" rate (core services less housing) remained sticky and relatively high at 3.2% (chart).
…Markets are ending October on a spooky note with the S&P 500 currently down nearly 2% on the day. Mega-cap earnings and continued worries from both sides on which candidate will come out on top next Tuesday (or beyond) are to blame for the drop.
While we're ending October on a down note, the S&P 500 is still having its best Election Year through October since 1936! That's right...the last time the S&P was up this much year-to-date through October of an Election Year was all the way back in 1936.
Bloomberg: Bond Traders Scour US Jobs Data for Clues on Fed’s Rate-Cut Plan
Traders have been hedging for more losses in Treasury market
Previous employment report triggered a selloff in US bonds
(Bloomberg) -- Investors who’ve been hedging against a deeper selloff in US Treasuries are preparing for volatility as Friday’s hurricane- and strike-tinged US employment report offers final clues ahead of next week’s Federal Reserve policy decision.
…That positioning makes evidence of a robust US labor market in government data released on Friday “hard for the market to ignore,” said Jack McIntyre, portfolio manager at Brandywine Global Investment Management. While money managers can explain away weak data as a byproduct of strikes and storms, a strong jobs report would remove pressure on policymakers as they lower interest rates.
“I don’t think this Fed likes to surprise the markets too much,” he said. McIntyre expects a quarter-point cut at next week’s meeting, in line with most economists surveyed by Bloomberg, but anticipates they’ll send a hawkish message and “signal they are done cutting for a while.”
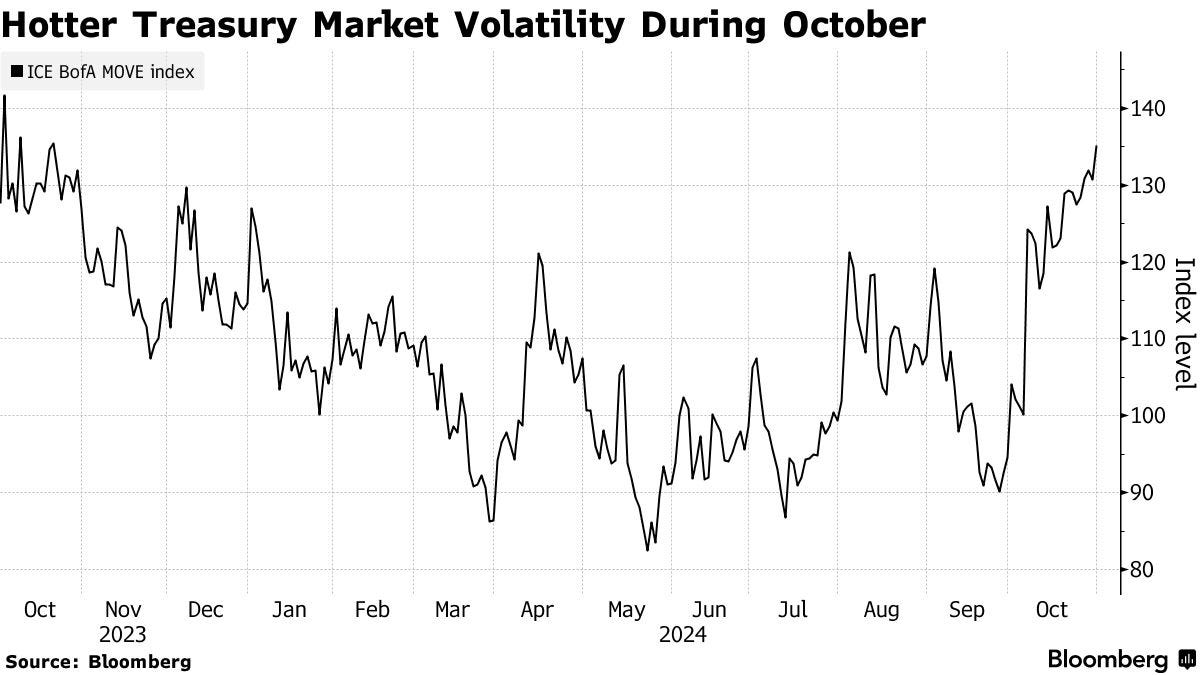
…The ICE BofA Move Index, a closely watched gauge of US bond-market volatility, closed at its highest this year this week, showing that traders are paying up to protect against increased turbulence. A standout flow on Thursday included a long volatility play for a premium of $10 million via options linked to the Secured Overnight Financing Rate.
Bloomberg: Big Tech falters, while the Bond Inquisition comes for the UK Magnificent Seven can no longer evade AI earnings expectations, while market vigilantes tighten the screws on Reeves.
…Rachel Reeves, the UK’s new chancellor, made an unscheduled Thursday afternoon appearance on Bloomberg TV, which you can see here, as she continued to try to defend her budget. Watching it shows her difficulties reconciling the two vital audiences of domestic voters and international bond investors. Although both ultimately share a desire for strong economic growth, bond vigilantes are as unforgiving and ruthlessly efficient as the Spanish Inquisition. Her appearance was a recognition that she needed to address their almost fanatical devotion to fiscal restraintdirectly after a brutal day of trading:
While things had calmed down somewhat by the close, the spread of 10-year gilts over equivalent German bunds had reached its widest since the Liz Truss crisis of 2022. The market perceives a problem:
However, at no point has this selloff been as extreme as two years ago. This chart shows five-day movements in the 10-year gilt yield over the last three years; what happened in September and October 2022 was on a wholly different scale:
For the next 24 hours, Reeves could be at the mercy of events in the US, where the October unemployment data is due at 8:30 a.m., New York time. A surprisingly strong number would likely push Treasury yields upward, and add to the pressure on gilt yields to rise.
In the US, the data has (mostly) run in the direction of an economic soft landing (although there’s still little evidence that voters are feeling it). The PCE deflator for September, the Fed’s official inflation target, is still not back to the 2% goal, but the trimmed mean (excluding outliers and taking the average of the rest) compiled by the Dallas Fed suggests it’s getting close:
That on balance suggests the Fed can go ahead with cutting rates next week. Meanwhile, claims for unemployment insurance suggest that hurricans Helene and Milton have wrought less damage than feared. Initial claims are still below their highs from last year:
The employment cost index, regarded as a critical indicator of whether the jobs market is pushing prices higher, rose by only 0.8% in the third quarter, its lowest rise since the summer of 2021 — another indicator that a rate cut can probably proceed. But the hurricanes have made non-farm payrolls, due Friday morning, unusually hard to predict. Economists polled by Bloomberg think that only 100,000 jobs will have been added in October, which would be the weakest growth since the pandemic shutdowns:
That might prove to be an easy number to beat.
WolfST: Inflation Doesn’t Want to Cooperate: PCE Price Indices for Core, Core Services, and Durable Goods Worsen Further MoM
The YoY “core” PCE price index, the Fed’s yardstick for its 2% target, rose 2.65%, with no progress over the past 5 months. But energy prices plunged.
Finally, there are, indeed, some sickos out there so …


https://www.zerohedge.com/markets/behind-bond-sell
https://www.zerohedge.com/markets/ugly-report