US Market Open: Equities firmer & NQ outperforms, DXY flat and crude incrementally higher with overall newsflow light (with light newsflow I’ll lean on others — Newsquawk — to make mountain out of the molehill)
European bourses are firmer but within contained ranges, in the absence of any pertinent catalysts; US equity futures are modestly firmer, NQ outperforms as Tech continues to gain
Dollar trades around flat, G10’s generally rangebound in light of a quiet start to a busy week
Bonds lift, albeit incrementally, as attention turns to key central bank events starting from tomorrow
Crude is marginally firmer as geopolitical themes remain in focus; Base metals are lower following downbeat Chinese price action
Looking ahead, US Leading Index Change, BoJ SLOOS, Comments from ECB's President Lagarde, Earnings from United Airlines
… FIXED INCOME
USTs are incrementally firmer but still towards the lower-end of last week's bounds, Fed blackout is underway but the week does have US GDP & PCE.
A slightly firmer start for the Bund with a 134.17 open vs Friday's 134.00 close, lifting further from the 133.71-73 double-bottom from Thurs/Fri; EZ syndication to be announced today, expected to price later in the week.
Gilts are a touch firmer, in-fitting with peers; there is a potential for headline volatility as the pre-meeting blackout is yet to begin though nothing scheduled ahead of the Feb meeting…
From Newsquawk TO Bloomberg 5 Things (EZ) reiterating a point I attempted to highlight HERE YEST …
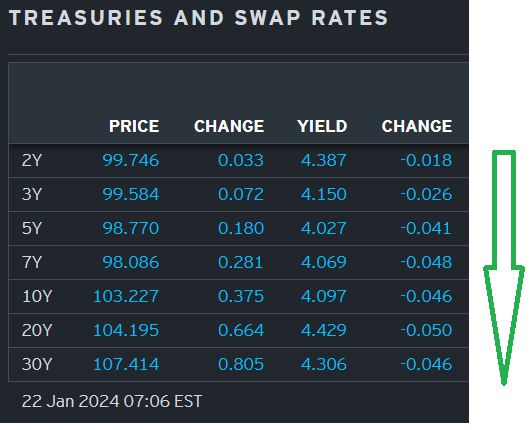
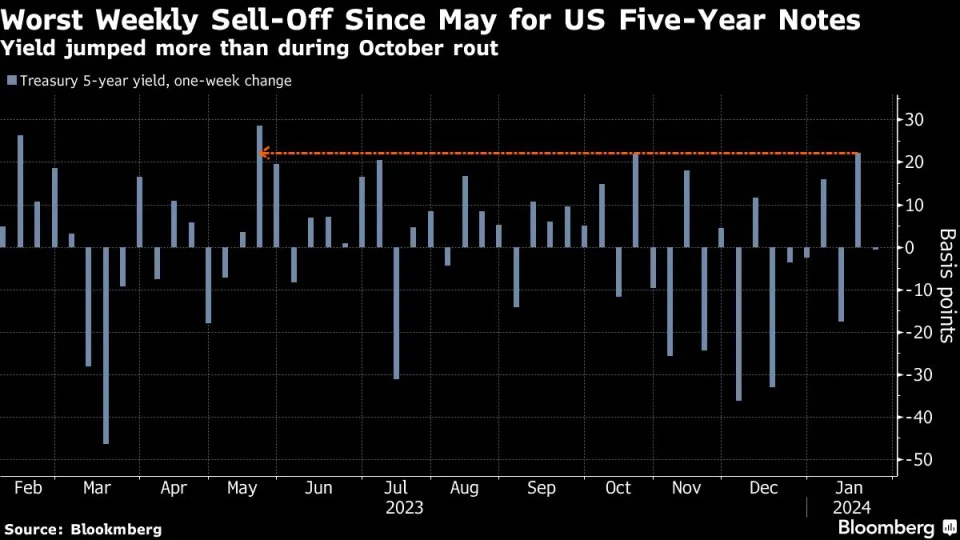
Two major Wall Street firms are recommending investors start buying five-year US notes after they saw their worst rout since May last week. Morgan Stanley sees scope for a rebound in Treasuries on expectations data in the coming weeks may surprise to the downside. JPMorgan is suggesting investors buy five-year notes as yields have already climbed to levels last seen in December, though it warned that markets are still too aggressive in pricing for an early start to central bank interest-rate cuts.
… I’ve got their full story below (and again, links thru to the sources highlighted HERE YEST and will deal more specifically with 5yy again Wednesday, ahead of their auction. A bit more of a ‘dip’ (ie concession) wouldn’t be necessarily a bad thing BUT now that there’s lots of attention (and support), I’d guess it’s going to be tougher to achieve but the day is early and so … here is a snapshot OF USTs as of 706a:
… HEREis what this shop says be behind the price action overnight…
… WHILE YOU SLEPT The Treasury curve has pivoted flatter off a little-changed front-end- dragged along by German bonds and the bull-flattening UK Gilt market. Asian stocks saw big divergence in fortunes (NKY +1.62%, SHCOMP -2.68%), EU and UK share markets are mostly higher (SX5E +0.5%) while ES futures are showing +0.3% here at 7am. Our overnight US rates flows saw better selling of intermediates during Asian hours as the curve twisted flatter than. In London's AM hours, we saw interest to buy in the belly but little conviction elsewhere. Overnight Treasury volume was ~80% of average across the curve.
… and for some MORE of the news you can use » The Morning Hark - 22 Jan 2024 and IGMs Press Picks (who CONTINUES to be sportin’ that new, fresh look) in effort to to help weed thru the noise (some of which can be found over here at Finviz).
Moving from some of the news to some of THE VIEWS you might be able to use… here’s SOME of what Global Wall St is sayin’ SINCE I last checked and sent out THIS WEEKEND note with links thu to some of best / brightest out there on Global Wall Street… (where I’d note BMO booked profits from long 10s and looking into 2s10s flattener despite ‘24 being The Year of the Steepening (again) … all while NWM staying BEARISH 10s and MS picking up duration (5s) ahead of this coming weeks 5yr auction!)
Goldilocks: US Economics Analyst: Is the Labor Market Weakening—or Just Returning to Normal?
… While our analysis is generally encouraging, we note three somewhat concerning developments. First, the pace of gross hiring has slowed dramatically over the last year and a half and has not yet stabilized. Second, we find that the 2023 normalization of the hiring rate argues for a further drop in job openings in the first half of 2024, which could potentially spill over to a lower pace of hiring later in the year. Third, using quantile regressions on 19 measures of labor market conditions, we find a higher risk of labor market deterioration today than in 2019, with the probability of a 4-5% unemployment rate within twelve months estimated at nearly 20%.
Broadly speaking, our analysis indicates a labor market returning to pre-pandemic norms, best characterized as a somewhat tight labor market that does not pose an inflation problem. Coupled with the continued decline in core inflation and the risk of a further decline in hiring rates, we continue to expect the Fed to begin the easing cycle this spring, with the first 25bp cut in the funds rate most likely at the March meeting.
We recommend a quality growth bias as the cohort's relative performance over lower quality cyclicals is strong in decelerating front-end rate regimes and the group is showing relative strength from an earnings revisions perspective.
… From our perspective, not much has changed fundamentally from 3 months ago other than the price of most assets. As discussed last week, almost all of the price movement in equities over the past several months can be traced back to the change on bond yields ( Exhibit 4 ). We think that bond yields will continue to play a significant role in this year's returns along with interest rate volatility ( Exhibit 5 ) which has also been more subdued since October.
The Red Sea disruptions are not yet sufficient to affect our inflation outlook in the US and Euro Area. For now, it remains a micro/firm level concern rather than a macro headwind…
… At a macroeconomic level, shipping costs matter and are a piece of broader supply chains. But shipping costs and times are only one of many inputs that influence supply chains. The Morgan Stanley Supply Chain Index (MSSCI) is a supply chain measure that we have used in recent years to measure supply chain disruption. It aggregates a range of inputs that have recently correlated well to goods inflation. The index rose modestly in December because of increases in sea (Baltic Dry Index: +40%M) and air freight rates (Import Air Freight: +13%M). But these rises are off of a low base, as containership rates are as much as 86% lower than their post-Covid highs. The overall index had already fallen back to pre-COVID levels, so the current disruptions are small relative to those we have seen in recent years.
Wells Fargo: January Flashlight for the FOMC Blackout Period
Summary
We share the near-universally held view that the FOMC will leave the fed funds rate and pace of quantitative tightening (QT) unchanged at the conclusion of its upcoming meeting on January 31.
The FOMC's decision last month to leave the fed funds rate unchanged for a third consecutive meeting made it increasingly clear that the most aggressive tightening cycle since the 1980s has come to an end. Consequentially, overall financial conditions have eased considerably since the last policy meeting.
We also look for the FOMC to remain in a holding pattern in terms of its policy guidance, and we expect only minor changes to the post-meeting statement relative to December. A change to the statement we would not be surprised to see at this meeting is the removal of the paragraph on the U.S. banking system and financial conditions.
Overall, we view this meeting as one where the Committee will buy time to discern if inflation is indeed on a sustainable path back to 2% and serve as an opportunity to build consensus around the conditions for eventual policy easing.
Market chatter about changes to the existing pace of QT has picked up recently, and we expect the meeting will include a discussion about the path forward for the Federal Reserve's balance sheet.
Our base case is that the FOMC will announce a plan to slow the pace of QT at its June meeting, although we would not be shocked if the Committee decided to do so one meeting earlier in May.
Specifically, we expect the runoff caps for Treasury securities to be reduced to $30 billion while MBS caps are dropped to $20 billion starting on July 1. We anticipate this slower pace of QT running until year-end 2024. Under this scenario, the Fed's balance sheet would reach a trough of $6.8 trillion or so at year-end 2024 and begin growing gradually again thereafter.
… And from Global Wall Street inbox TO the WWW,
Bloomberg: Morgan Stanley, JPMorgan Say Buy the Dip After Treasury Rout
Both firms recommend investors buy five-year Treasuries
Five-year Treasuries sold off most since May last week
Two major Wall Street firms are recommending investors start buying five-year US notes after they saw their worst rout since May last week.
Morgan Stanley sees scope for a rebound in Treasuries on expectations data in the coming weeks may surprise to the downside. JPMorgan is suggesting investors buy five-year notes as yields have already climbed to levels last seen in December, though it warned that markets are still too aggressive in pricing for an early start to central bank interest-rate cuts.
“This is ‘the dip’ we have been looking to buy,” analysts including Matthew Hornbach, global head of macro strategy at Morgan Stanley, wrote in a note dated Jan. 20. “With less fiscal support and much colder weather, we see downside risks to US activity data delivered in February.”
Five-year US yields climbed 22 basis points last week, the most since the period to May 19, as traders slashed bets on interest-rate cuts from the Federal Reserve this year. Sustained pushback from central bank officials, along with healthy data on retail sales, sent the odds of a March reduction tumbling to nearly 40% on Friday. The market is now expecting five quarter-point cuts from the Fed this year, after looking for six-to-seven reductions on Jan. 12.
Treasuries advanced modestly on Monday, sending five-year yields down one basis point to 4.04%.
One Japanese investor argued that it’s better to remain cautious on bonds given the potential the Fed leaves rates unchanged this quarter. There could be “concern growing among investors that the Fed may not pivot at all or they have bought too many bonds,” said Hideo Shimomura, a senior portfolio manager at Fivestar Asset Management Co. in Tokyo.
“Don’t be the last guest at the bond party. Once the party is over, leave the room quickly,” he said.
The next set of auctions of Treasury debt, including two-, five- and seven-year notes, are slated to begin on Tuesday, setting the stage for upward pressure on yields for those segments of the market.
The bond market also faces risks with the first reading of US fourth-quarter gross domestic product on Thursday, expected to mark the strongest back-to-back quarters of growth since 2021. The Fed’s preferred gauge of underlying inflation is due Friday and is forecast to show an 11th straight month of waning annual price growth.
The data may end up reinforcing the potential that the Fed achieves its avowed aim of a soft landing. While that should allow policymakers to deliver interest-rate cuts this year, Treasuries have been whipsawed by the potential that an easing cycle will start later and proceed more slowly than previously expected.
JPMorgan expects the first Fed cut to come in June, rather than the May move, which is now fully priced in by swaps contracts. Morgan Stanley sees central banks in both the US and Europe to be in focus in mid-March and forecasts markets pricing in at least one rate cut by northern hemisphere spring for most central banks.
Bloomberg: A Rewiring of the World’s Biggest Bond Market Will Transform Trading
SEC is forcing Treasuries trading onto a central clearinghouse
… The initiative amounts to one of the most consequential efforts since a regulatory revamp in the wake of a 1991 Treasury auction scandal involving the now-defunct Salomon Brothers. Once complete, it should minimize the danger of contagion from a shock collapse of any one financial institution. It’s akin to what authorities already did with interest-rate derivatives after the downfall of Lehman Brothers, which wreaked havoc in global money markets.
Because the clearinghouse assumes responsibility for completing transactions, it reduces the risk of a counterparty being unable to complete a deal. But the reduction in systemic danger will come at a price: dealers will face higher risk-management costs as the SEC also tightens rules governing clearinghouses. And, as dealers will collectively be on the hook for any one counterparty going down, they’re also likely to do more due diligence on clients. New collateral and margin rules may also mean less day-to-day liquidity…
… “We see this expansion to broaden participation in central clearing as a natural evolution that FICC is well-positioned to execute on,” a DTCC spokesperson said.
A key element of CCPs involves a collective backstop in the case of one member’s demise — not unlike the federal deposit insurance kitty that banks pay into. The CCP pools members’ capital to ensure that losses at one firm don’t harm others. The platforms also have what’s called a default fund, known as a waterfall, where bank members deposit cash and securities to be held in reserve as an additional level of loss protection…
… “While central clearing of repo and Treasuries could help improve market resilience, the change is highly unlikely to fully resolve the broader liquidity decline in recent years,” said Gennadiy Goldberg, head of US rates strategy at TD Securities Inc. “Dealer balance sheets remain constrained, increased capital requirements are coming” and Treasury supply keeps rising, he said.
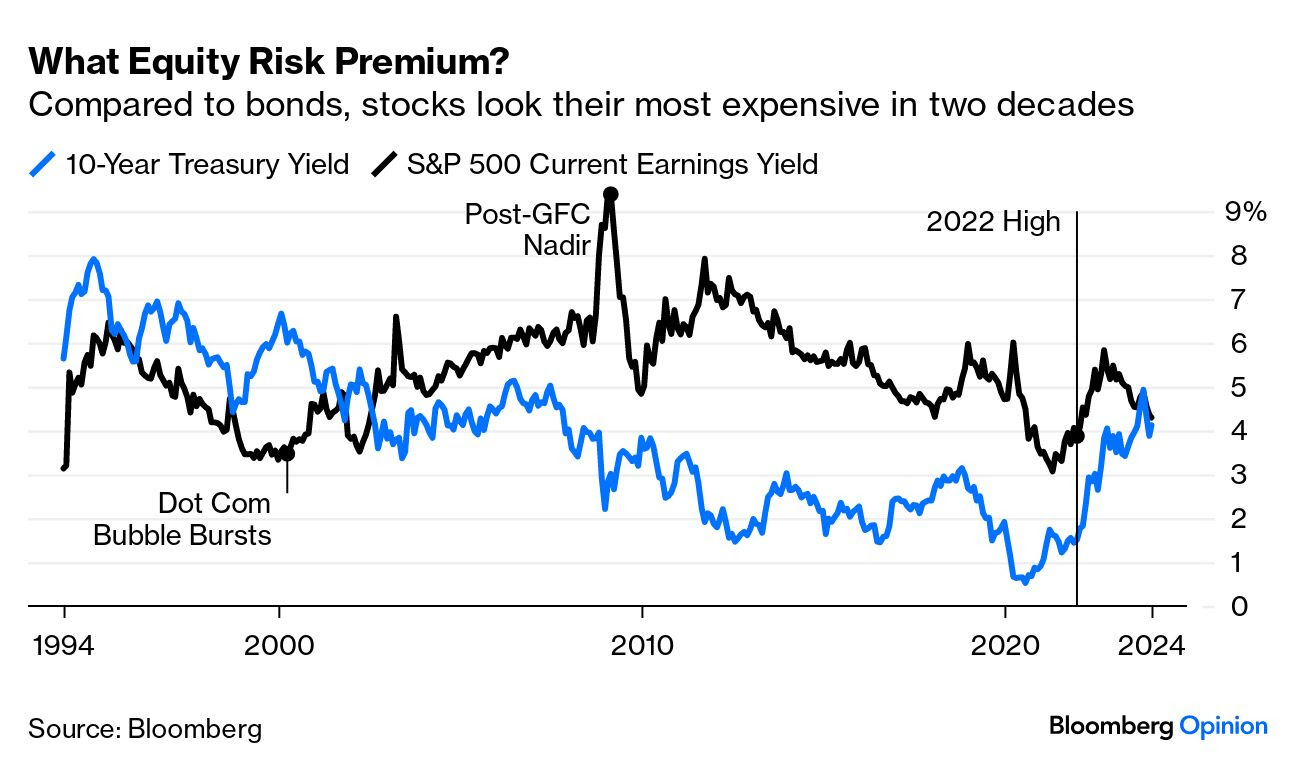
Bloomberg: Why the S&P's new record may not mean a bull market (Authers’ OpED)
The all-time high reached Friday is welcome news, but the devil will lie in bonds.
… Over the last three decades, this is how these measures compare. At the top in 2000, stocks yielded much less than bonds, a huge red flag. By the bottom in 2009, the earnings yield far exceeded Treasuries, signaling an obvious time to buy. Then, the yields trended lower together, thanks largely to determined intervention in bond markets. Low bond yields persistently justified higher valuations on stocks. In January 2022, stocks looked plainly cheap compared to bonds. They don’t any more. At times of late, the 10-year yield has actually been higher, for the first time in a decade. That’s what we might expect at the beginning of a bear market, not when we can declare a new bull run:
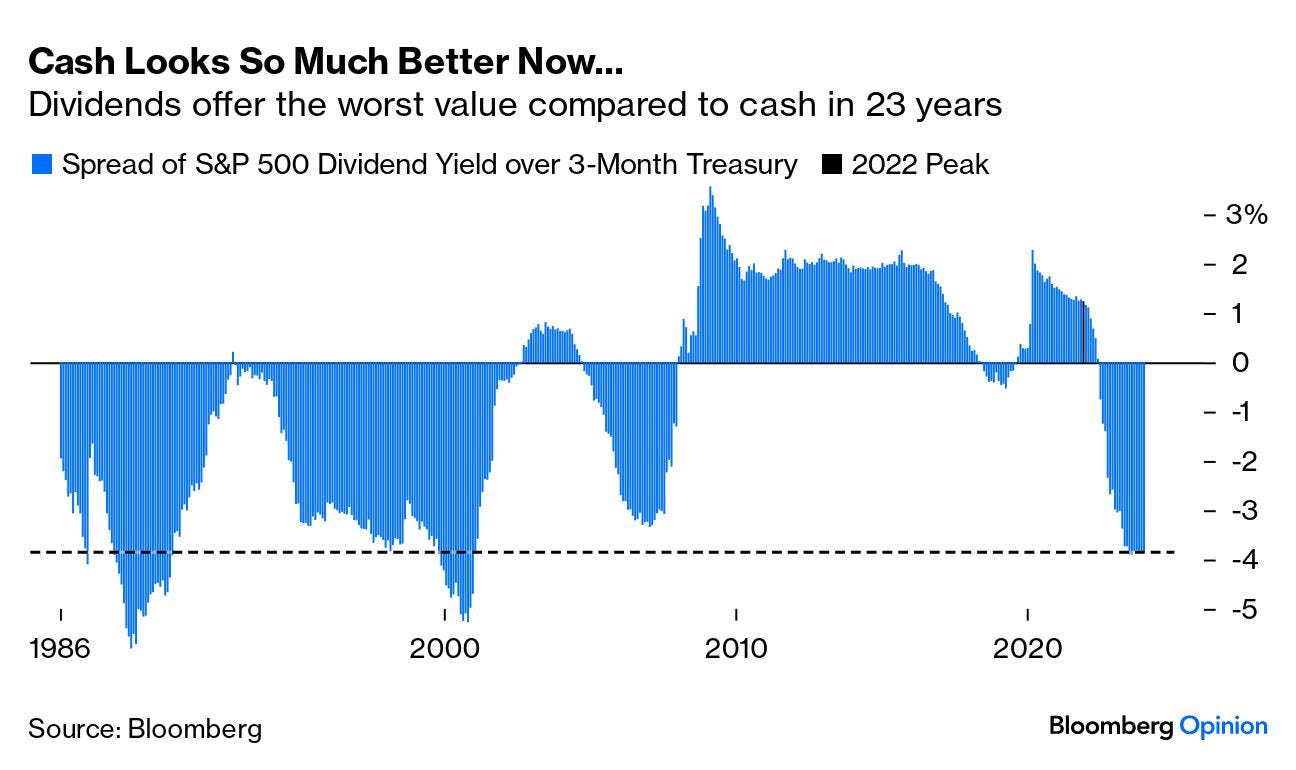
If we compare in terms of raw cash, with the dividend yield on stocks and the yield on three-month bills, so focusing on the most basic measures of cash flow, the picture is fairly similar. In the post-GFC decade, it became the norm for dividend yields to exceed the yields on bills. This is a potent illustration of how strong the support for stocks has been — if you get more of a cash return from dividends than you would get from very short T-bills, why not buy stocks? The January 2022 peak is marked. Stocks look far worse value on this measure now than they did then. Indeed, they look more expensive than at any time in two decades:
Summing this up, the weird and repressive conditions that have endured since the crisis seem to be over. That’s good news, as the rise in asset prices has been achieved amid a widespread perception of rising inequality and misallocation of capital. It looks as though valuations are returning to the norm from before the turn of the millennium (an era when it was still plenty possible to make money).
In broader context, look at the research published on the website of Robert J. Shiller, Nobel laureate economist at Yale University, whose framework for the long-term valuation of the stock market has set the debate for a quarter-century. This is how he presents his cyclically adjusted price/earnings (CAPE) multiple of the S&P 500’s price to average earnings over the previous 10 years, which he has calculated back to 1880, against the 10-year bond yield. As expected, they have an inverse relationship. Historical experience suggested that after the extremes of 2000, 10-year yields would rise steadily while the CAPE on stocks would endure a low period. That didn’t happen, as bond yields were taken down ever further in the wake of the GFC. At this point (and Shiller hasn’t updated his numbers in the last three months), the CAPE looks very high by historic standards. The froth of early 2022 has been knocked out of the system by rising interest rates, but stocks remain far more expensive than when long-term rates were this high in the past:
Shiller’s suggested rule of thumb is the “excess CAPE yield,” which subtracts the bond yield from the CAPE yield.


Thanks for fixing the IGM link. You're the best