Good morning … still waiting for HIMCOs Q3 writeup and so i’ll move right along …
… U.S. Treasuries are starting to balk at post-electionfiscal prospects and the resulting spike in benchmark borrowing rates has knocked stock markets off their perch and lifted the dollar to its best level since early August … -Reuters Morning Bid
…. starting to balk? ‘Scuse me for interrupting but would seem to me the lows in 10yy came day before the Fed CUT rates (and so, the day the 2d FOMC meeting began) and we’ve known for while that no matter WHO wins the election, someone’s gonna spend $6t … to peg this on an all of a sudden move OR on, say, The Trump Trade (as many are likely to WANT to do) would seem to ME to be severely misplaced.
That’s as close to a political comment yer gonna get from me and so, a chart of 10yy with rate CUT notated …
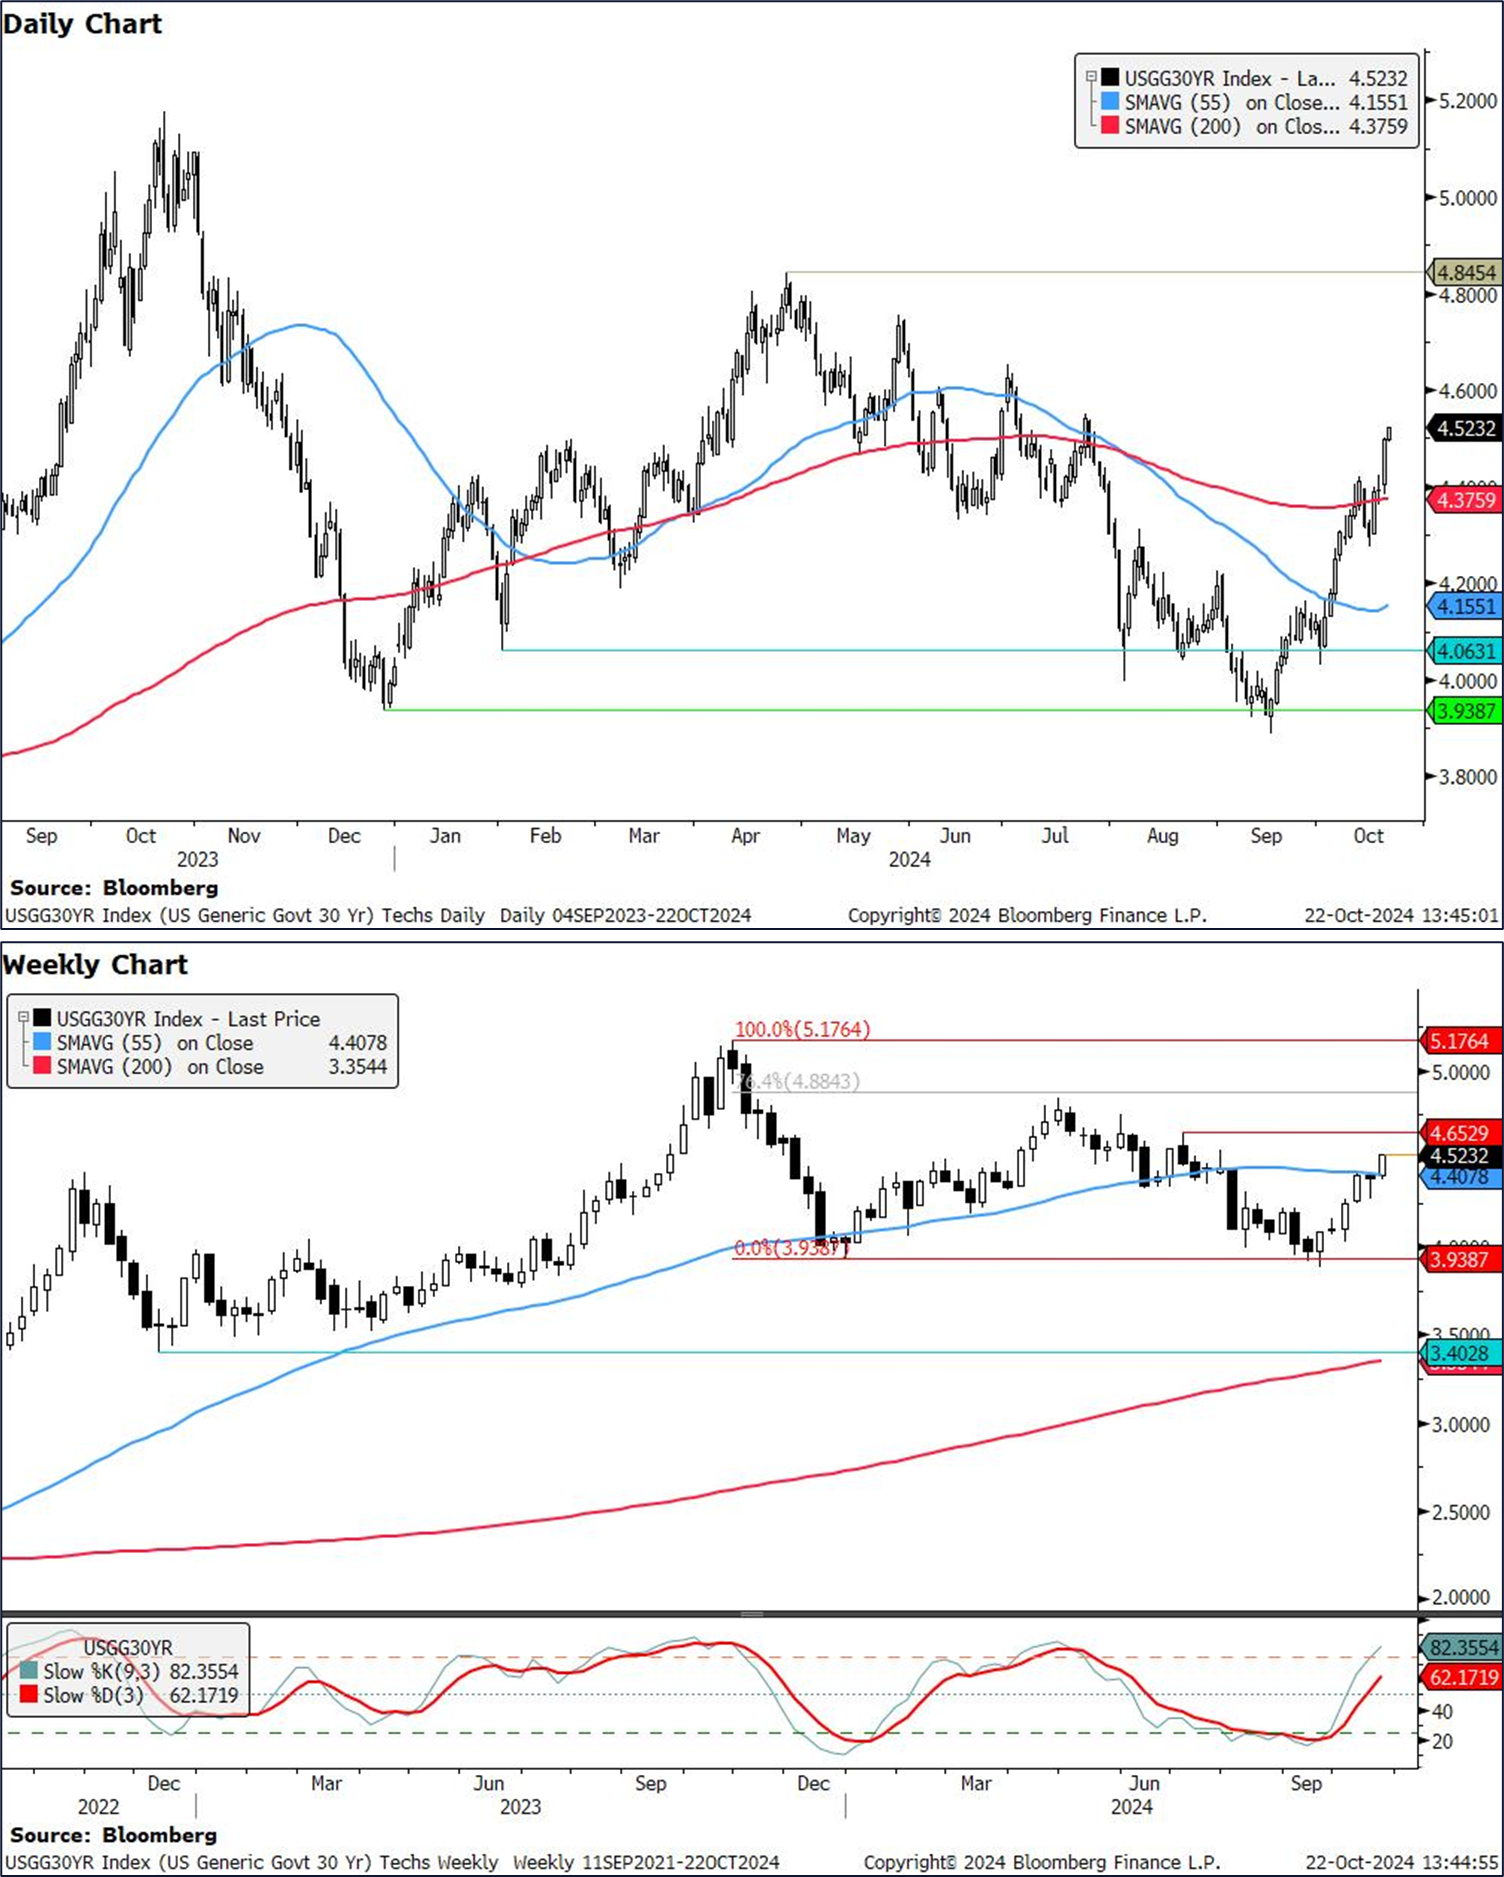
10yy DAILY: up OVER 200dMA (4.183%) a DipORtunity …?
… note, too, as yields have exploded about 60bps from pre FOMC CUT lows (3.60%), momentum has shifted and stochastics once again moved from overBOUGHT to now overSOLD and so, if they can remain here through tomorrows 20yr auction, I’d imagine bids will surface … for somewhat MORE on why 200dMA is not nearly as important as the 55wMA, continue scrolling …
… takeaway whatever you want BUT … this one sorta gets my blood pressure up a bit even though i’m NOT in that seat … and note the h’line is on bond TRADERS but the story is ‘bout investors … couple very different scategories of activity …
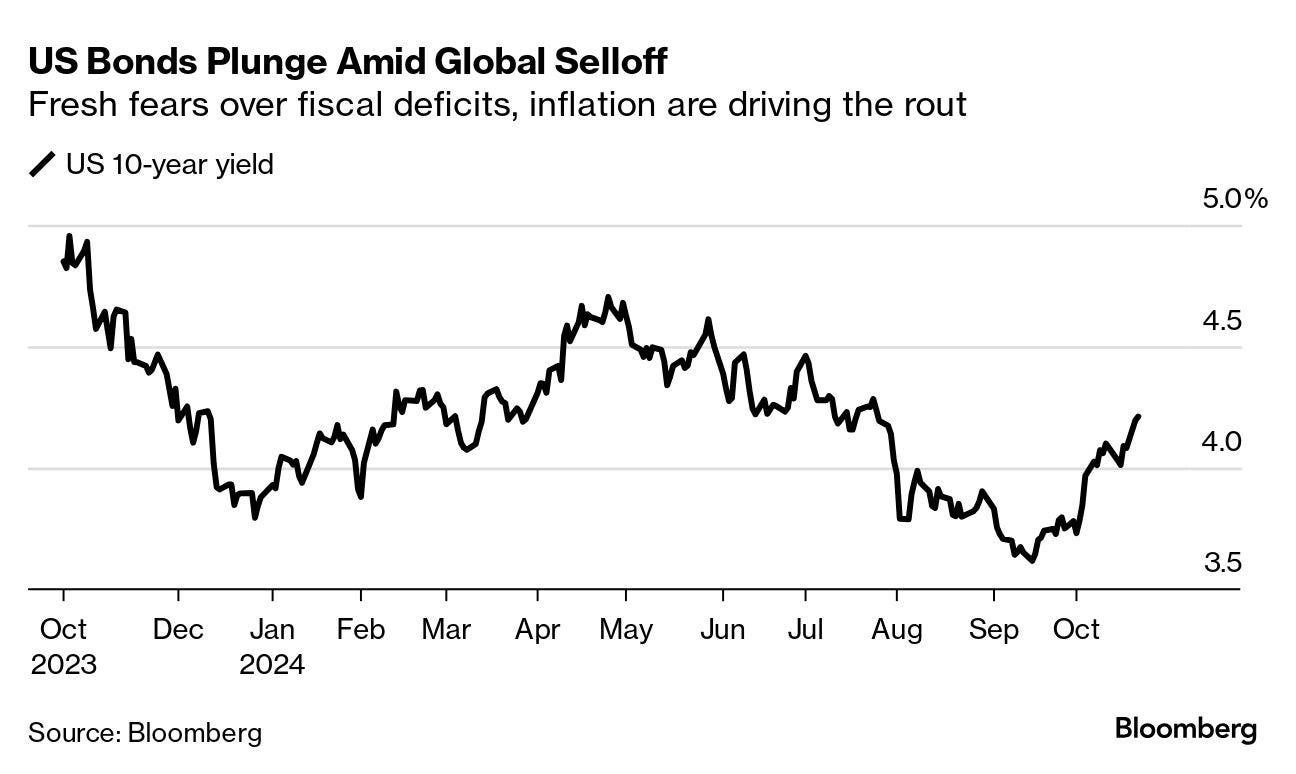
Trouble in bond markets Bonds markets are reeling from the risk that the Fed won’t cut interest rates as much as expected.
The 10-year Treasury yield rose above 4.2% for the first time since July, setting off a surge in borrowing costs from Australia to Germany. A gauge of expected debt-market volatility, called the Ice BofA MOVE index, is now around its highest of the year.
Once again, it looks like bond investors got carried away with a rally fueled by optimistic bets for easier monetary policy — only to be hit with the reality that change may not happen as quickly as they would like. It’s a pattern that played out on repeat for the past two years. Here’s some of the reasons behind the bond market selloff this time around:
Traders are rethinking the path of US interest rates. A repeat of September’s half-point cut is already off the table. Torsten Slok of Apollo Management sees a rising chance that the Fed will hold rates in November and others think policymakers will skip in December. On Monday, Fed officials indicated to varying degrees that they plan to take rates lower, but perhaps more slowly than anticipated.
The US jobs market is strong. The economy is proving more robust than expected. The Bloomberg Economic Surprise Index, which captures when data exceeds economist forecasts, is at the highest since May.
Threat of faster inflation under Trump. The presidential race is still a coin-toss with two weeks to go, but Republican Donald Trump has the advantage over Democrat Kamala Harris in betting markets. His support for higher tariffs and looser fiscal policy has been seen as unfriendly to bonds because it means faster inflation and more debt.
Budget deficits are getting bigger. The International Monetary Fund, which is holding its annual meetings in Washington this week, already predicts US debt will surpass 100% of gross domestic product next year. Deutsche Bank analysts also forecast the budget deficit will be between around 7% and 9% from 2026 through 2028, regardless of whoever is in the White House. The greater the deficit, the greater the issuance of bonds
NEWSQUAWK: Oil surges on recent geopolitical updates; speakers & earnings ahead … Bonds remain on the backfoot in a continuation of the pressure seen in the prior session … USTs are in-fitting with the above, and in a continuation of the "Trump trade" seen in the prior session. Region awaits its own supply which comes on Wednesday with a 20yr tap, but before that, Fed's Harker.
Finviz (for everything else I might have overlooked …)
Moving from some of the news to some of THE VIEWS you might be able to use… here’s SOME of what Global Wall St is sayin’ …
A few words on stocks (and Earl) …
BARCAP: U.S. Equity Insights: (Oil) Drums in the Deep
While the probability for a large oil supply shock remains low, we believe correlations make it prudent for equity investors to remain on guard. Our analysis of past supply-driven price jumps suggests that consumer-oriented sectors (Discretionary, TMT) and industry groups (Cons. Services, Durables, Retail) are most at risk.
…Figure 1. Heightened geopolitical tensions have already overseen a historic move in Brent crude futures
… a few techAmentals to consider as some were saying they’d buy dips …
CitiFX: US yields: Bent resistance, but not yet broken
US 10y yields have closed above the 200d MA on Monday, which sounds significant on the surface. However, we remain below the very pivotal 55w MA resistance at 4.22%, which remains the key level to watch. IF we see a weekly close above 4.22%, we think that the case would tilt in favor of even higher yields. However, for now, we think we just remain in the resistance zone of 4.17%-4.22%, rather than having broken above it. We also discuss US 2y and 30y yields in this update.
US 10y yields Yields have risen sharply above 4.12% (October 10 high) and also closed above 4.17% (200d MA). While these do form part of the building blocks for the case of higher yields, we are not yet convinced, with the main resistance level of 4.22% (55w MA) still holding (for now).
The 55w MA has been the key level to watch since 2021, where it has held as support on multiple occasions, before breaking below in mid 2024. As such this continues to be a significant level to watch.
A weekly close above the 55w MA, IF seen, would make the case for higher yields for us, with subsequent resistance at 4.29-4.30% (July 24th high, 61.8% FIbonacci). Subsequent resistance is at 4.47-4.49% (76.4% Fibonacci, July high)
To the flip side, support is only at 4.0% (psychological support), followed by 3.85% (55d MA).
… US 30y yields Yields have broken convincingly above the 4.41% (55w MA) level. IF we close above on a weekly basis, it would open the door to a move higher towards 4.65% (July high). This would be further supported by the move higher in weekly slow stochastics, which are showing no signs of crossing back lower.
For support, the key level remains 3.94% (Dec 2023 low), which we have not managed to close below on a weekly basis.
… a few words from German bank on yesterday’s move …
… There were several factors behind the move but none that particularly dominated yesterday. In the background there has been a rising concern about debts and deficits, particularly ahead of the US election. Indeed, the IMF pointed out in their recent Fiscal Monitor that global public debt is forecast to exceed $100 trillion this year, and rise further in the medium term, so this is a growing issue as policymakers gather for the IMF/World Bank Annual Meetings in Washington this week. Moreover, our US economists have pointed out that irrespective of who wins the presidency or congress, they could see deficits in the 7-9% area over 2026-28, which is a level unprecedented outside of major wars or massive economic shocks like the GFC and Covid-19.
In addition to the long-end moves, expectations of Fed easing continues to drift lower, with Fed funds pricing for next March (+8.0bps to 4.05%) moving back above 4% for the first time since the start of August, after having fallen to below 3.4% in late September. This came as Fed speakers continued to express preference for gradual easing moving forward, with Kansas City President Schmid favouring “modest” reductions while Minneapolis Fed President Kashkari was “forecasting some more modest cuts”.
Another factor behind the bond selloff were growing inflation risks, and yesterday saw Brent crude oil prices (+1.68%) pick up again to $74.29/bbl. That comes amidst growing focus on Israel’s expected retaliation against Iran’s missile strikes earlier this month, which is still yet to materialise. But oil prices were reacting to several weekend developments, including the drone strike on the private home of Israeli PM Netanyahu that we mentioned yesterday. Indeed, foreign minister Israel Katz said over the weekend that there was “no doubt that another red line has been crossed here”. Meanwhile, although the classic safe haven of gold (-0.06%) closed marginally lower, after posting four consecutive session ATHs, this morning its +0.43% higher as I type and back at what would be record closing levels again …
The end games for the Fed and ECB continue to pull in different directions. It's been quite the change in sentiment in the past six weeks. The Fed was supposed to be the big cutter on a delayed start. Now the pressure is greater on the ECB. This is manifesting in ongoing widening in the Treasury-Bund spread. And in the end, direction is being bullied by Treasuries
… and a statement of the obvious and reiteration of another 50 by year end …
UBS CIO: Rate cuts should help to sustain the expansion
Recent data have included some significant surprises to the upside. With help from Fed rate cuts, we expect growth to continue at a good pace in the quarters ahead.
• Shelter inflation has finally turned lower, which should help constrain overall inflation in the months ahead.
Our base case remains that the Fed will cut by 25bps at the two remaining meetings this year, then slow to a once-per-quarter pace in 2025.
Yesterday’s pontification of Federal Reserve speakers created a stir in bond markets. There were a range of views expressed, from “keep on cutting” to “more gradual cuts”. Markets, rendered skittish by Fed’s “data dependency” on undependable data, have raised yields. US inflation is down one percentage point since last December, which would justify a similar reduction in rates over the course of this year…
Summary The Leading Economic Index sank in September to a level last seen in 2016. This oncewidely followed gauge has a credibility problem. We maintain that the U.S economy is achieving a soft landing, but even if a recession were to start tomorrow, it would not redeem the fact that for more than two and a half years the LEI has cried wolf.
Yes, that has been our advice since mid-August. Our August 19, 2024 Morning Briefing was titled, "Get Ready To Short Bonds?" We wrote: "Bond investors may be expecting too many interest-rate cuts too soon if in fact August’s economic indicators rebound from July levels and the Fed pushes back against the markets’ current expectations for monetary policy. So we are expecting to see the 10-year Treasury yield back in a range between 4.00% and 4.50% next month." At the time, the 10-year Treasury bond yield was 3.88% (chart).
We were right about the economy and bond yields despite the Fed's reaction function turning out differently than we expected. Instead of remaining moderately hawkish, Fed Chair Jerome Powell turned extremely dovish in his August 23 Jackson Hole speech. That drove the bond yield down to 3.62% on September 16. On September 18, the Fed cut the federal funds rate by 50bps. We concluded that was too much, too soon. We reiterated our view that the yield would climb back up over 4.00% on better-than-expected economic data and on a none-and-done outlook for rate cutting by the Fed over the rest of the year.
The 10-year yield rose to 4.18% today, up 56bps since September 16. The expected inflation spread between the 10-year nominal and TIPS yields rose 26bps. The inflation spread has widened despite the recent drop in oil prices (chart). The bond market seems to agree with our view that the Fed may be stimulating an economy that doesn't need it.
In our April 7 QuickTakes, we wrote: "We would also add to precious metals positions under the circumstances." We were alluding to rising geopolitical risks as a good reason for being bullish on gold and silver. We noted that the prices of both gold and silver were breaking out to the upside (chart)….
… And from Global Wall Street inbox TO the WWW …
… NOT how one wants to start the day thinkin’ about bonds, indecision (on cuts)…
Bloomberg: Bonds Are Selling Off Everywhere as Traders Trim Rate-Cut Bets
Odds of Fed keeping rates on hold in November are increasing
Inflation, rates set to stay higher in medium term: BlackRock
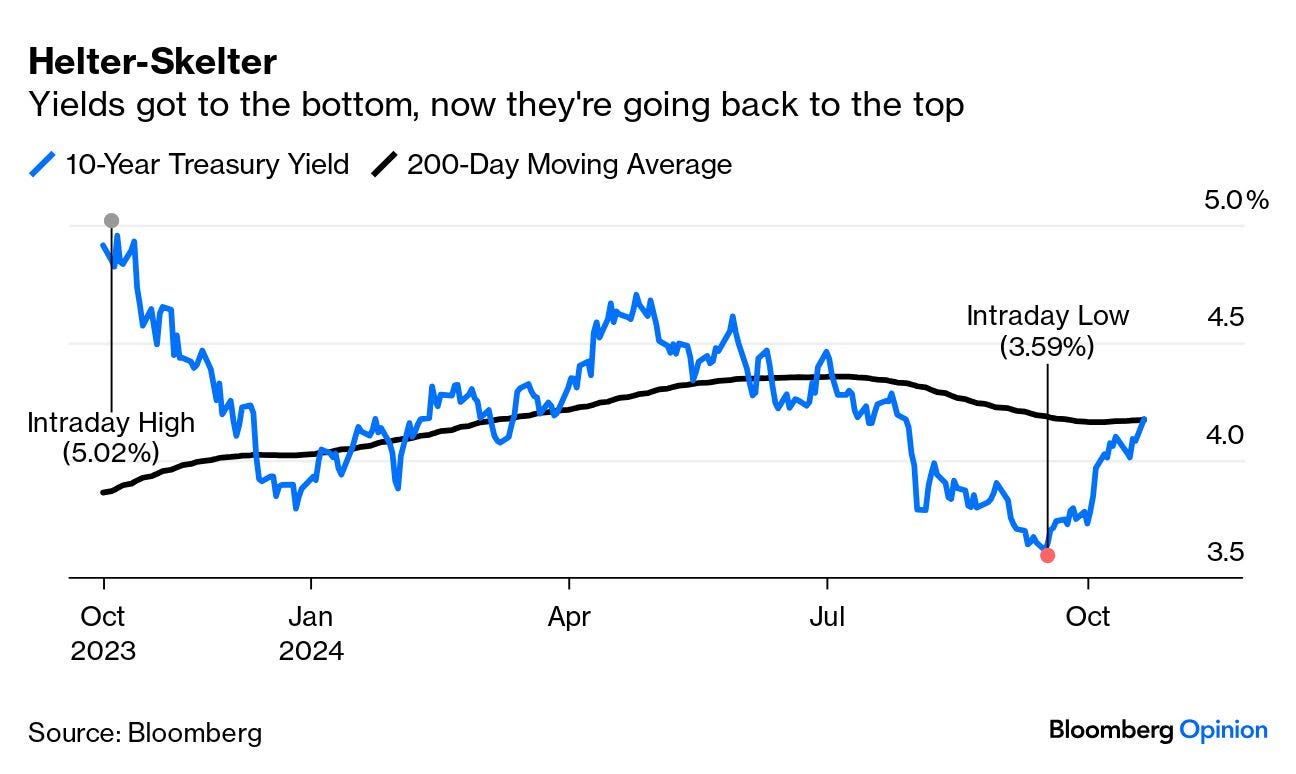
Bloomberg (Authers OpED): Helter-skelter in bonds as markets doubt Fed cuts Treasury yields are back above 4%. Blame Powell, blame Trump, but don’t pretend like the election is already done. It’s not.
Helter-Skelter If you thought the bond market had got its story straight, think again. On the anniversary of its brief trip above 5%, the 10-year Treasury yield is surging upward once more. In the wake of the Federal Reserve’s decision last month to make a jumbo cut of 50 basis points to the fed funds rate, the 10-year yield dropped below 3.6%. It’s now above its 200-day moving average, at 4.19%. The helter-skelter ride continues:
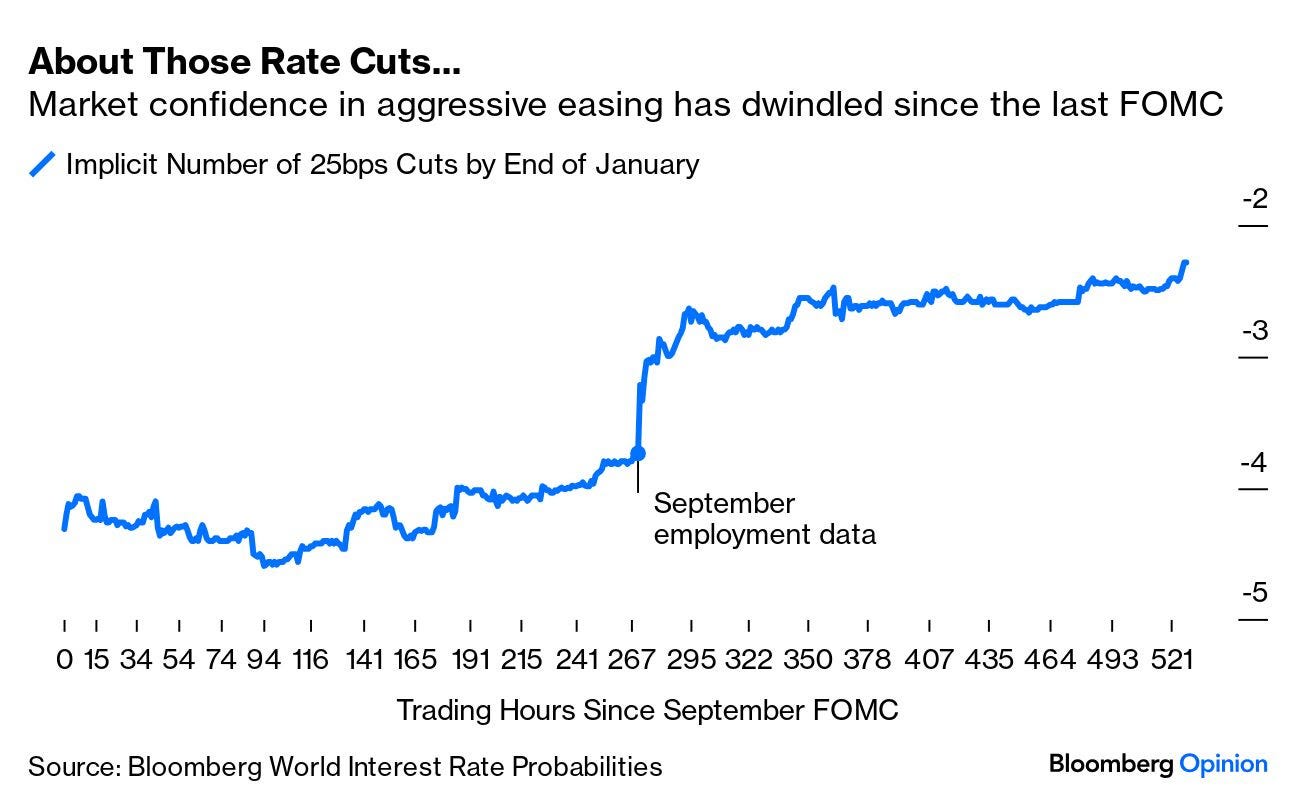
Why the change of direction? Chiefly, there is a reassessment of the Fed’s likely next move. In the wake of the jumbo cut, the fed funds futures priced in further cuts of 100 basis points by January’s meeting. That meant certainty that there would be at least one more big cut. The surprisingly strong employment data for September reined that in drastically. Since then, the expected cuts have continued to whittle away, and now the market thinks that there will most likely be only 50 basis points of cuts over the next three meetings. From pricing a certain jumbo cut, they are now positioning for a likelihood that there will be at least one meeting when the Fed stands pat:
This seems a largely sensible response to ongoing Fedspeak, as speakers from the central bank are beginning to tell us all in pretty clear language to forget any more out-sized cuts. Jeffrey Schmid, president of the Kansas City Fed, said he favored a “cautious and gradual approach to policy”:
While I support dialing back the restrictiveness of policy, my preference would be to avoid outsized moves, especially given uncertainty over the eventual destination of policy and my desire to avoid contributing to financial market volatility.
Neel Kashkari of the Minneapolis Fed similarly said that he would need “real evidence” that the labor market is “weakening quickly” before he would deviate from a cautious path aimed at getting to a neutral rate (often known as R*):
Right now, I am forecasting some more modest cuts over the next several quarters to get to something around neutral, but it’s going to depend on the data.
Lorie Logan of the Dallas Fed argued for “a strategy of gradually lowering the policy rate,” while Mary Daly of the San Francisco Fed was less hawkish in comments Monday, saying she did not want to see the labor market loosen further. But she did nothing to stoke the notion that more jumbo cuts lie ahead, and admitted that last month’s decision had been a “close call.”
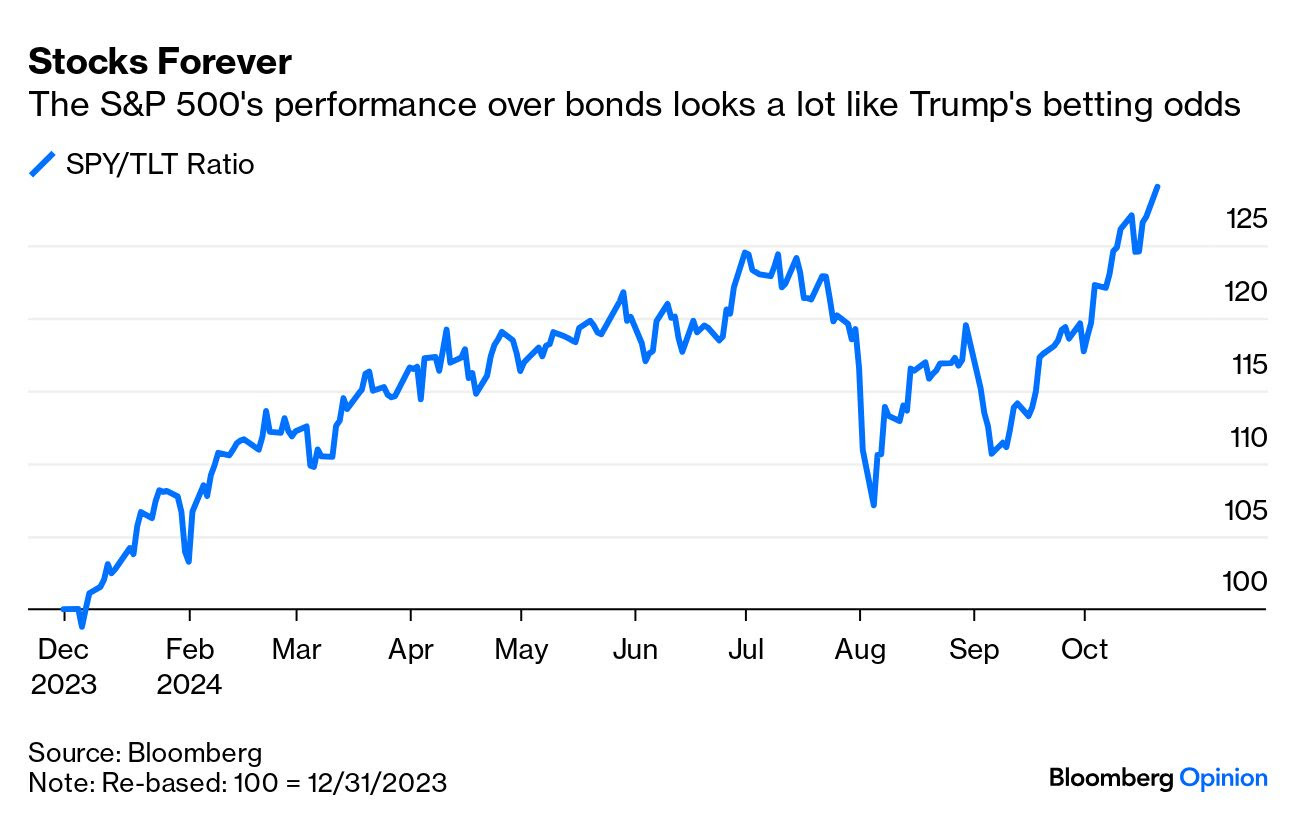
… There are important differences. The PredictIt prediction market put Trump’s chance of victory at 22% on election eve in 2016; the same market now puts him at 58% (while others rate him higher). So whatever happens in the next two weeks, we can assume that a Trump victory wouldn’t provoke quite so big a reaction, because it wouldn’t be such a big surprise. Investors are already attempting to price it in. In fact, it looks as though they’ve overdone it. The pro-growth trade of buying stocks relative to bonds continues to surge. The following chart uses my favorite simple measure employing exchange-traded funds, and compares SPY (tracking the S&P 500) and TLT (tracking Bloomberg’s index of 20-year+ Treasuries). This chart also has an obvious family resemblance to the perceived ebb and flow of Trump’s chances through the year:
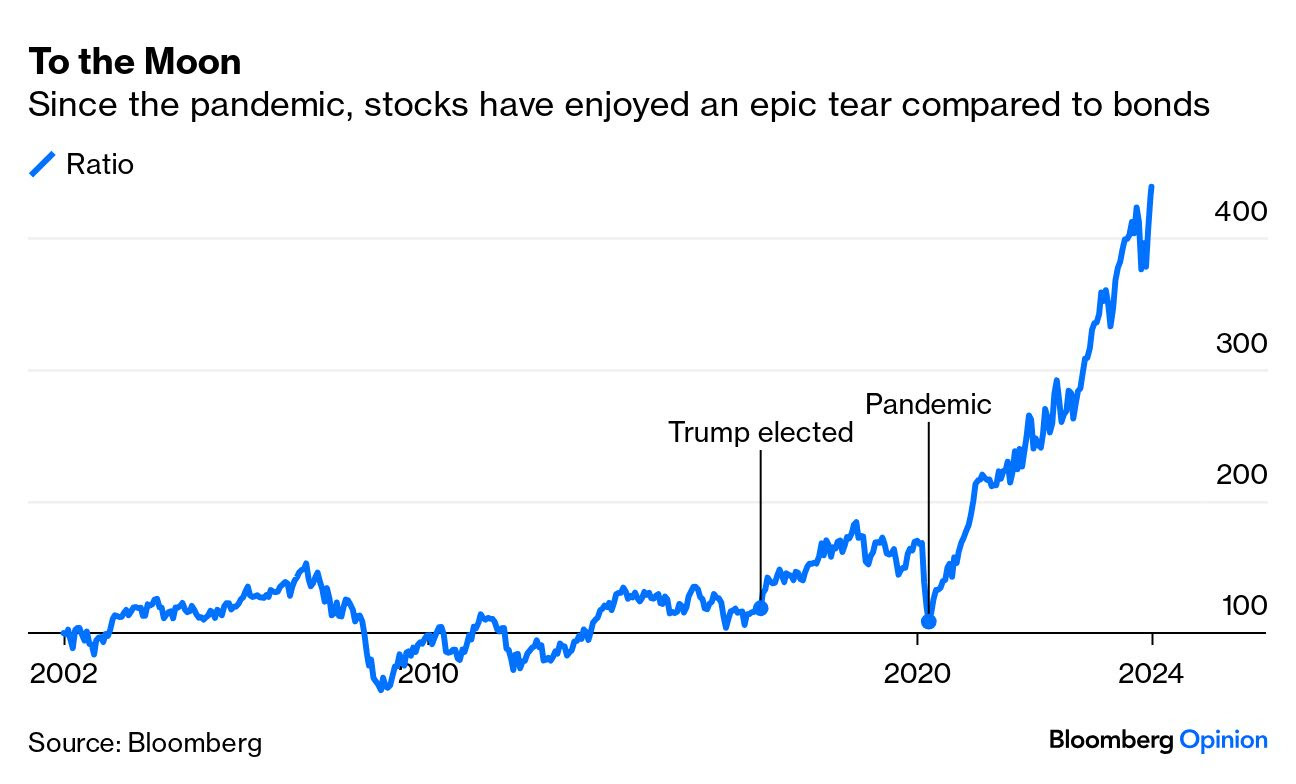
Some historical perspective might be handy. Stock outperformance like this is not normal. These two ETFs have been available since 2002. This is how the trade has performed since TLT was launched:
By the time Trump won election in 2016, stocks and bonds had been tracking each other for more than a decade, characterized by the bursting of the dot-com bubble, the Global Financial Crisis, and then years of bond-buying by the Fed that tended to buoy both asset classes. That election spurred the first big Trump trade — which culminated in the alarming selloff now known as the Christmas Eve Massacre at the end of 2018. Then the Fed’s massive bond-buying to deal with the pandemic prompted a reversal. Since then, it’s been one-way traffic, uninterrupted by the arrival of Joe Biden, or the Fed’s aggressive monetary tightening in 2022 and 2023.
Whether stocks could continue to rally like this amid a trade war, growing bond yields, and rising inflation is another question.
… i’m a sucker for a picture of a market with QE overlay …
Hedgopia: Russell 2000, With Improved Action In Recent Weeks, Hoping For Goldilocks Economy
… In the meantime, core PCE, which is the Federal Reserve’s favorite measure of consumer inflation, has gone sideways at 2.6s for four consecutive months through August, when it increased 2.68 percent year-over-year. In February 2022, core PCE was growing at a four-decade high of 5.65 percent. It has come down quite a bit from that high but is proving stubborn above the central bank’s goal of two percent. (September’s numbers are due out on the 31st this month.)
Strength in the most recent macro data thus has turned markets’ interest-rate outlook on its head. Until just a few weeks ago, particularly after the FOMC cut the fed funds rate by 50 basis points in September (17-18), futures traders were pricing in another 50 in November and a 25 in December, followed by 125 more basis points of cuts next year, ending 2025 at a range of 275 basis points to 300 basis points. Their enthusiasm has now cooled down – to expecting two more 25-basis-point cuts this year and another 100 next year (Chart 4). This is 50 basis points lower than what they were expecting just a few weeks ago…
… someone ELSE says it’s different this time and we’re OK with it … so long as they are offering snazzy explanation about how change is good and inherent in all things finance …
… A notable development is the recent growth in bank deposits. After a prolonged period of contraction following the Fed’s aggressive tightening in March 2022, deposit growth is now accelerating at an annual rate of 5.5%. This increase implies a similar growth of the money supply which is a positive sign for broader financial conditions.
The Fed has only made modest progress in cooling the economy, with the labor market remaining unexpectedly strong. This raises an important question: Is the neutral rate—the interest rate consistent with full employment and stable inflation—higher than anticipated? Earlier this year, I estimated the neutral rate at around 3.5%, but the latest data has pushed my estimate up toward 3.75%. (The Fed, recall, indicates a neutral rate of 2.9%.)
This recalibration of the neutral rate has direct implications for long-term bond yields. Historically, the 10-Year Treasury yield has traded about 100 basis points above the Fed Funds Rate, and even wider in non-recessionary periods. With the Fed Funds Rate likely settling around 3.75%, this puts the 10-Year yield on a trajectory toward 4.75%…
In retrospect COVID seems to be some well-executed Wealth Transfer by the Gov/Fed to themselves and their Special Friends, such as Buffet Gates etc. Anyone else remember all the charts of billionaires Doubling Up or more after CARES Act? Just yellin' into the wind here....


In retrospect COVID seems to be some well-executed Wealth Transfer by the Gov/Fed to themselves and their Special Friends, such as Buffet Gates etc. Anyone else remember all the charts of billionaires Doubling Up or more after CARES Act? Just yellin' into the wind here....