while WE slept: bonds are at lower end of range; "US Rates: Lower yields, but caution is warranted" -CitiFX; bonds are ALMOST back -BBG; 60/40 STILL not dead -BBG
Good morning and pardon the Juneteenth markets interruption. While markets were closed, futures remained open AND, well …
ZH: US Markets May Be Closed But Tech Stocks Continue To Melt Up
… Nothing can stop this thing, not even a market which is, in theory, closed!! What is NOT being highlighted but is noted below …
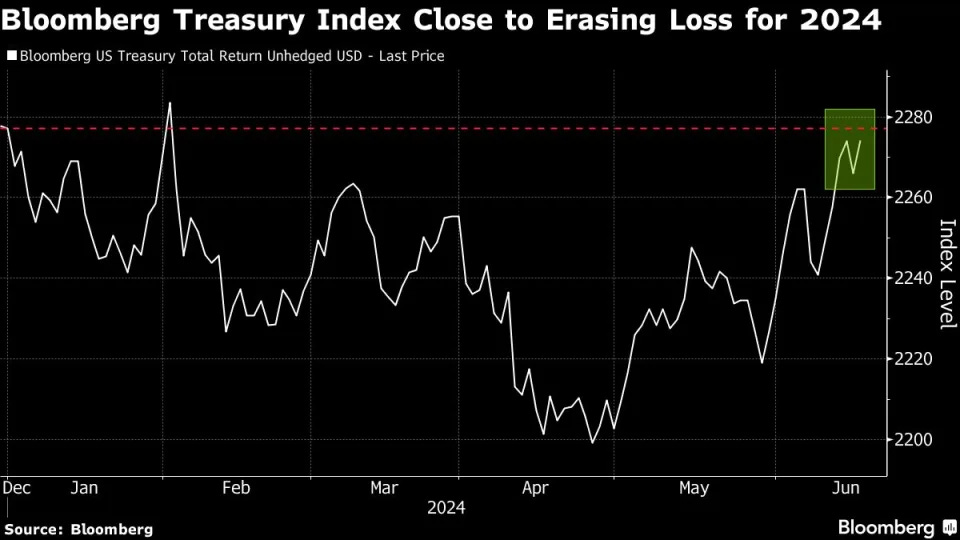
Bloomberg: Treasuries Are a Whisker Away From Erasing This Year’s Loss
US Treasury gauge was down as much as 3.4% for 2024 in April
… A Bloomberg gauge of returns in the world’s biggest bond market is now down just 0.1% for 2024, after having lost as much as 3.4% for the year in April. At the heart of the rebound are investor bets that cooling US prices will convince the Federal Reserve to cut interest rates sooner and by more than officials have signaled, effectively putting a lid on how high Treasury yields can climb…
That in mind, a quick look back at Tuesday as ReSale TALES weakness …
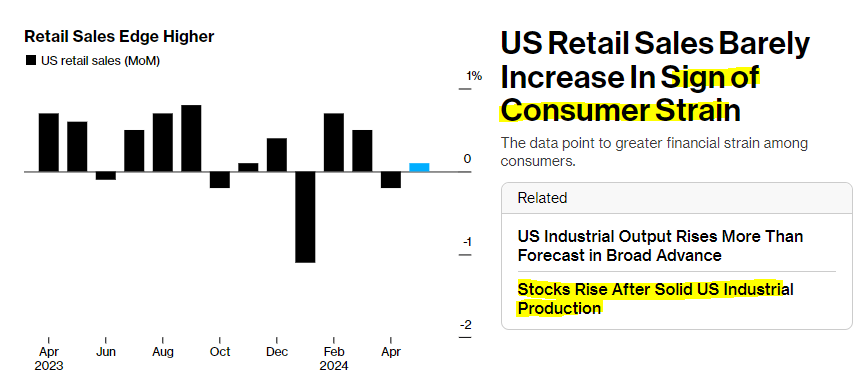
ZH: Retail Sales Disappoint In May, April Revised Even Lower...
… was followed by industrial sized STRENGTH …
ZH: US Industrial Production Surges In May, Biggest MoM Jump Since Jan 2023 As ISM Tumbles
… AND markets doing what it is markets do, seeing what they wanna see, BBG dot COM looked like this in wake of the data
… and FRBNYs John Williams weighed in …
Bloomberg: Fed’s Williams Says Economy Strong, Needs More Data for Rate Cut
New York Fed head says economy ‘moving in the right direction’
Williams declined to comment on when first rate cut would be
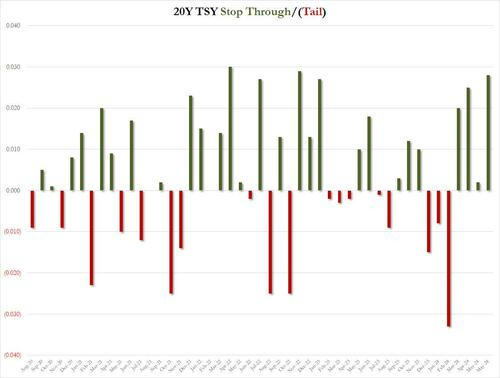
… all an act / appetizer to set table for 20yr auction which WAS experiencing a bit of a ‘concession’ (noted) ahead of the data. Mentioned there also was BAMLs expectation for ReSale Tales to BEAT along with expectation for trading strategies (short 20s) which, prior to the data, offered a perfect track record so far, YTD…
… Starting at the top, the high yield of 4.452% was below last month's 4.635% and the lowest since January's 4.423%. This was a whopping 2.8bps stop through to the 4.452% When Issued, which was the biggest stop through since Nov 22 and the third highest on record!
The bid to cover jumped to 2.74 from 2.51, and well above the six-auction average of 2.60 if nowhere close to the highest on record which was 2.87 exactly one year ago.
… okie dokie … so goes idea to GET / BE SHORT 20s! Signals schmignals … Sell long bonds NOW they said … Bonds almost UNCH on the year and technically, now look poised to gain further (CitiFX below).
Lets jump TO some news and views but first … here is an earlier than normal snapshot OF USTs as of 638a:
… and for some MORE of the news you might be able to use…
NEWSQUAWK: US Market Open: Equities in the green, CHF slips post-SNB and GBP softer ahead of the BoE; Fed speak due … Bonds are softer, Bunds initially lifted post-SNB but has since pared, French auction passes without issue … USTs are softer but comfortably within yesterday's ranges where newsflow was light on account of the US holiday, as attention turns to US IJC & Philly Fed data, as well as a few Fed speakers. Holding at the low-end of a 110-16 to 110-26+ range.
Finviz (for everything else I might have overlooked …)
Moving from some of the news to some of THE VIEWS you might be able to use… here’s SOME of what Global Wall St is sayin’ …
ABNAmro: US - Resolving the labor market puzzle | Insights newsletter
This month’s labor data came in mixed. The establishment survey showed large job gains (272k) after a softer reading in April (165k). For the same month, the household survey showed a drop in employment of more than 400k, pushing the unemployment up to 4.0%, despite a decrease in participation. The fact that these two surveys point in different directions in any given month is not unprecedented; they disagree in one of every three months. The question is whether the trends of the two align, and the answer is a clear ‘no’.
BARCAP May Retail Sales: Soft headline, solid details
Retail sales registered a disappointing 0.1% rise in May following April's dip, mainly reflecting the drag from lower gas prices. However, the details were more solid than the headline suggests, with a solid bounce-back in the control group, positioning PCE for a Q2 increase similar to Q1's 2.0% q/q saar gain.
BARCAP May IP: Not dead yet, I think I will go for a walk
Industrial production jumped 0.9% m/m in May following a flat April reading, led by broad-based gains in manufacturing, as well as solid prints for utilities and mining. Today's print defies downbeat signals from recent ISMs, once again placing manufacturing on a sideways trajectory over the past 12 months.
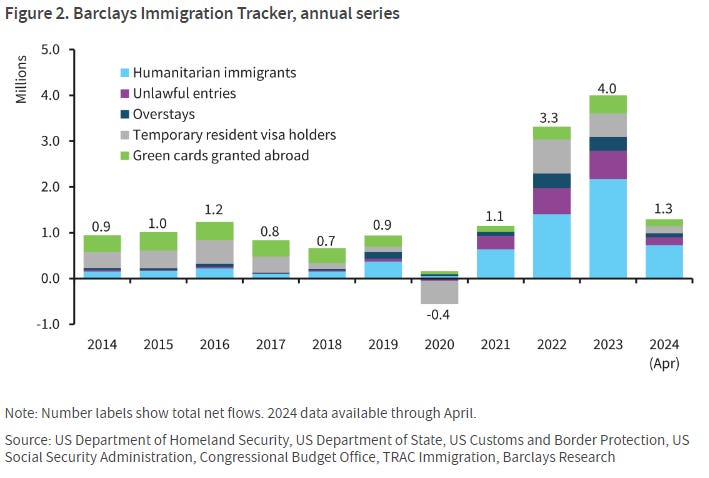
Surging US immigration has helped boost economic growth, reduce inflation, and fuel expectations of monetary easing. With policy measures threatening to upend the status quo, we quantify immigration flows and assess likely effects on the outlook under alternative scenarios.
… In Figure 2 we show the Barclays Immigration Tracker net immigration flows at an annual frequency, split by immigration category. Between 2014 and 2019, immigration remained relatively stable, with flows oscillating around 1mn per year. The most drastic reduction took place in 2020, when pandemic-era restrictions limited cross-border mobility, and as a result, net immigration in 2020 was negative (ie, emigration surpassed immigration). Since these restrictions were lifted in 2021, immigration flows have risen steadily, reaching an all-time high of 4mn in 2023.
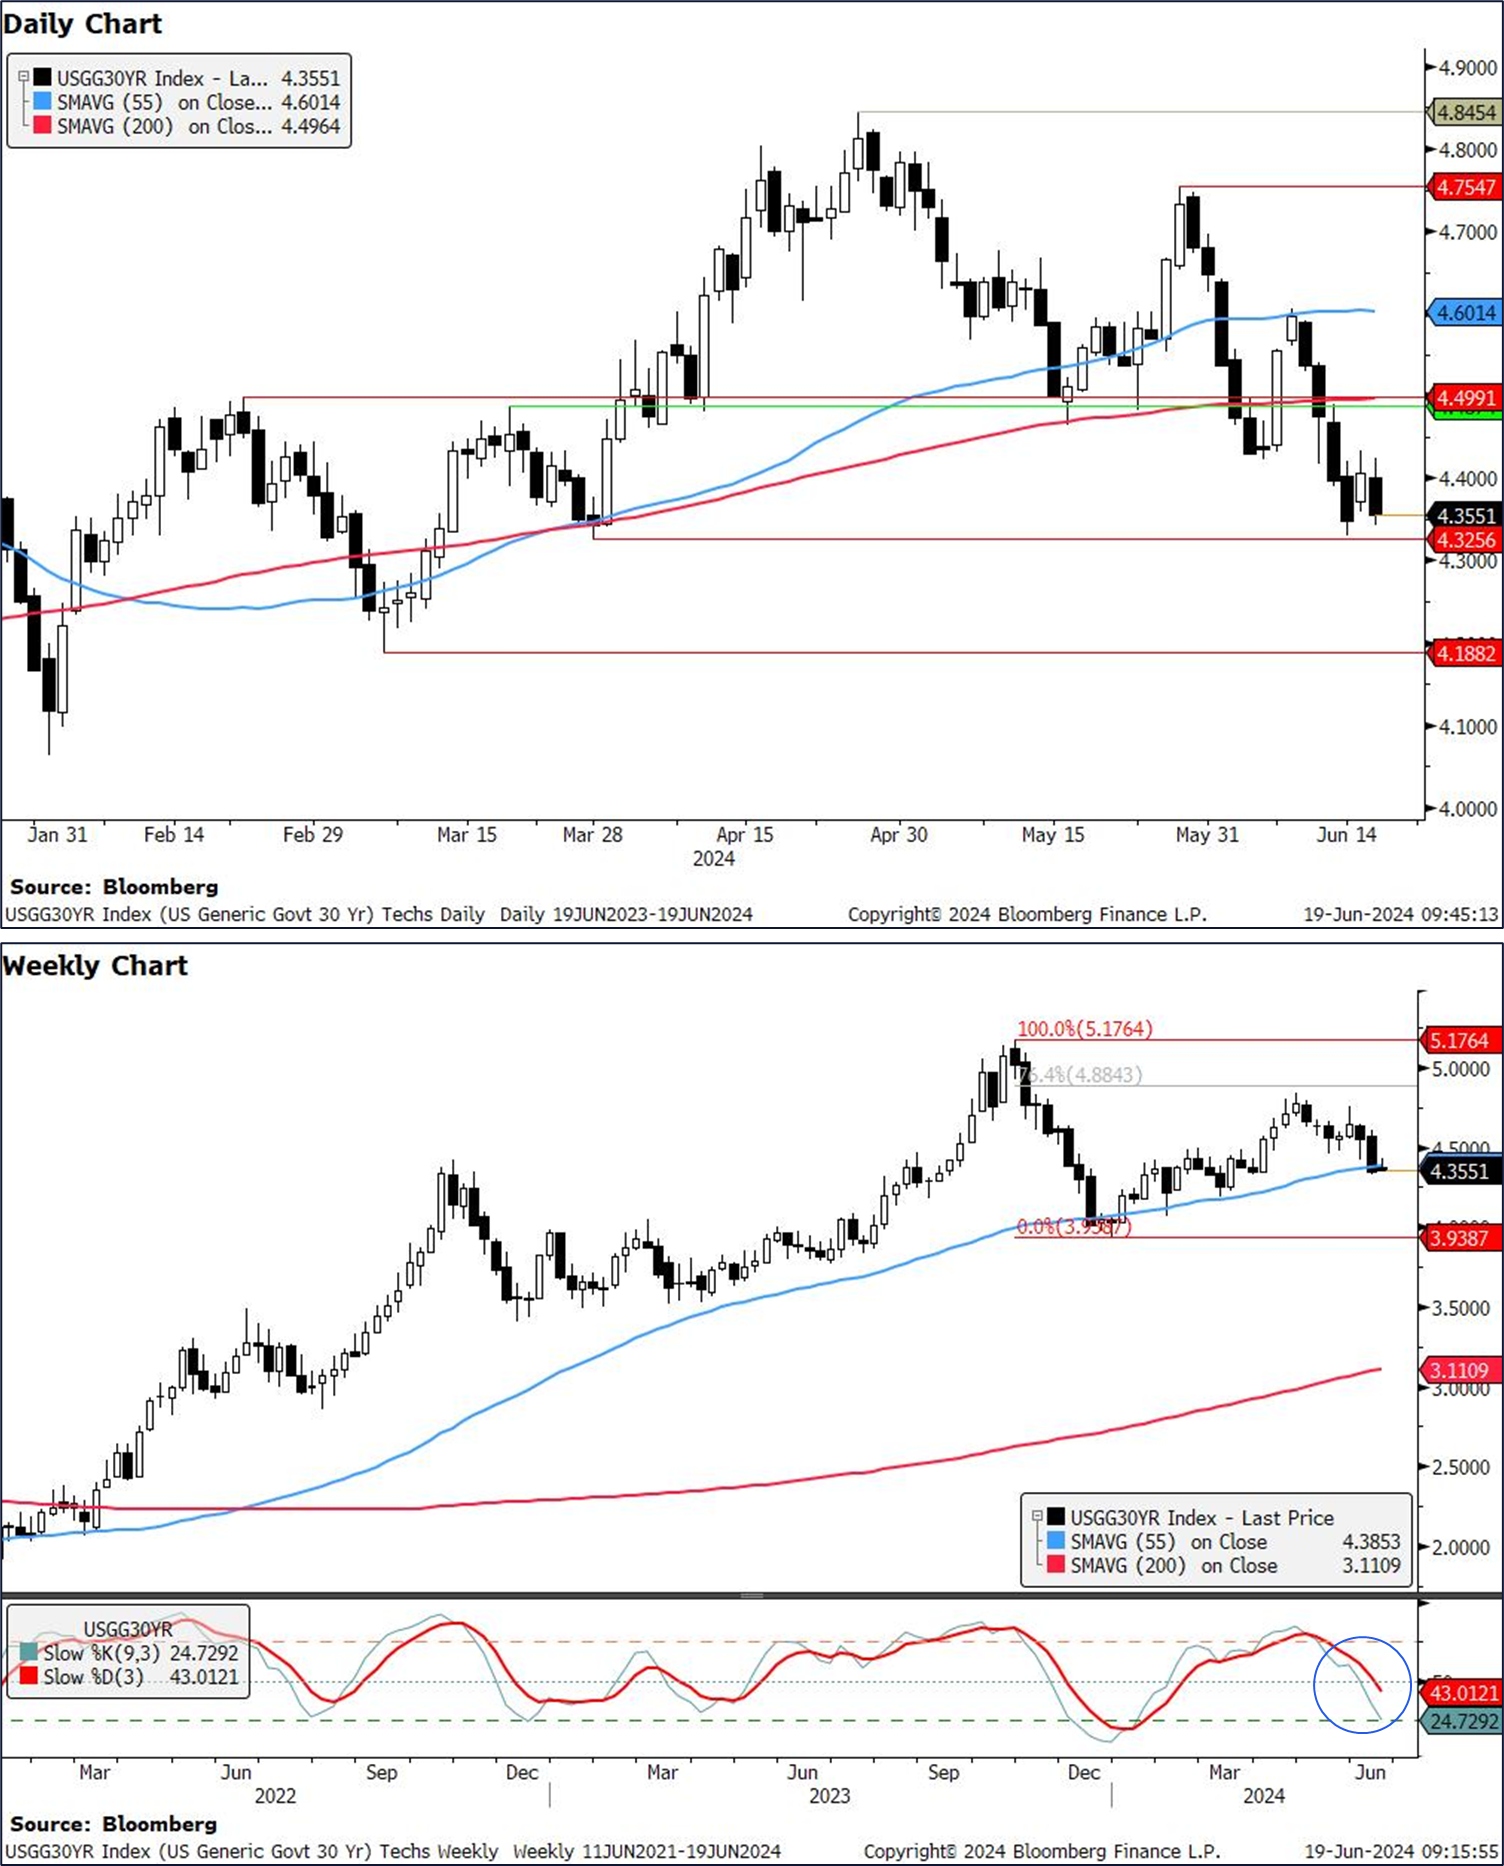
CitiFX: US Rates: Lower yields, but caution is warranted
Daily and weekly developments (especially the weekly close below 55w MA support levels) suggest that we could see lower yields in the short term. However, medium term caution is warranted in our opinion, especially since we saw a false break below the 55w MA support in late 2023. We detail levels to watch:
US 2y yields: Testing support at 4.70%
US 5y yields: Near support at 4.17%
US 10y yields: Posted outside day candlestick, testing support at 4.18%
US 30y yields: Support at 4.30-4.33%.
…US 30y yields Yields have tested the 4.30%-4.33% support level (March 28 low) in recent days. IF we close lower on a weekly basis, it would open a move towards 4.19% (March lows).
Brent and WTI: Since breaking the 200w MA two weeks ago, we have seen a strong rally in prices, which have now broken above key resistance levels. A weekly close above these levels could suggest another 5% rally…
… WTI Price has broken above 80.45 - 80.62 (55d MA, May highs), and is testing intermediate resistance at 81.87 (61.8% Fibonacci). This happens as we see a cross higher from overbought territory in weekly slow stochastics. As a side note we also flag CTAs were signaled to add to WTI longs after closing above max long signal at 79.89 (based on our CETS CTA Model).
What does it mean: Like Brent, there are no strong resistance till 84.09-84.46 (76.4% Fibonacci, April 26 high).
Our colleagues in US Economics yesterday introduced a dashboard of measures of r-star. It showed a wide range of estimates but with a clear and general upward trend since pre-Covid and an average current value of around 1.5% (the level assumed in our US rates forecast).
The dashboard includes two distinct types of measures: (1) actual r-star, measured using macro models estimated on GDP, inflation, and short-term interest rates; and (2) expectations of r-star, as derived from bond market pricing and/or surveys. The two should in theory converge but since r-star is time-varying and unobserved – real-time or ex-post – they need not.
In any case, sitting at the bottom of the range of measures and showing by far the smallest increases over recent years are estimates from two widely-tracked Fed models: Laubach-Williams (LW) and Holston-Laubach-Williams (HLW). However, as today’s chart shows, estimates from those models have, over time, been revised significantly and in one direction – up – which suggests some discounting of current readings may be called for. Specifically, the chart compares initial or “real-time” estimates of r-star to current estimates; that is, for a given quarter’s observation, it compares the initial estimate of r-star, formed the following quarter based on then-available data, to the estimate of it today, formed with the benefit of subsequent observations and data revisions that can help to pin down its level.
The key point is that the model estimates have undergone large and systematically positive revisions, with average and median increases to LW of around +60bp. Real-time estimates from HLW are available over a much shorter sample but revisions to them broadly track those to LW over the period since.
Time will tell if that’s where we’re headed again.
LW estimates of r-star have been revised up significantly over time
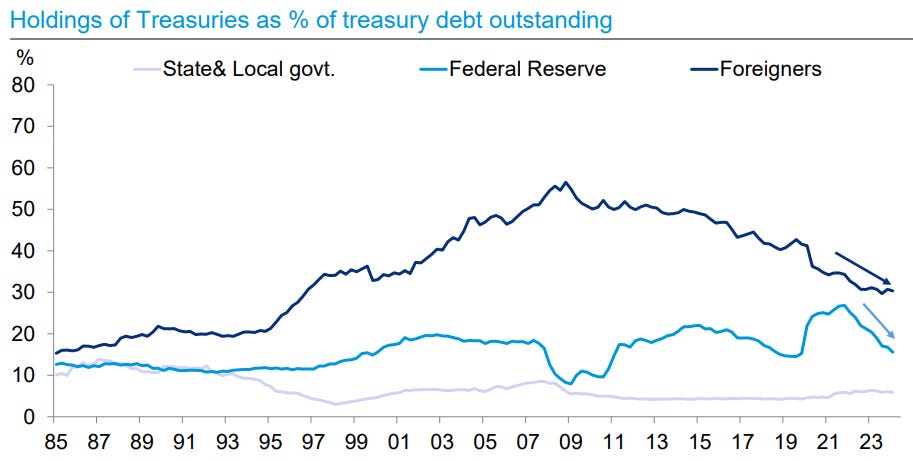
DB: Who is buying Treasuries, mortgages, credit and munis?
…The bulk of private-sector Treasury holdings (i.e. ex-Fed) is under 5 years in maturity
…Foreign share of Treasuries has fallen from a peak of 56% to just 30% at the end of 2023
…Primary dealer positions in Treasuries have surged recently
… The control-group showed more strength than not – e-commerce, sporting goods/hobbies, misc. stores, and healthcare bounced back after a soft April. Apparel continues to run strong. Weakness was concentrated in home furnishing, gasoline sales, and food (both at home and dining out). The downward revisions to April retail sales were fairly broad-based across e-commerce, gen merch, gasoline, and sporting goods, while motor vehicle sales and home furnishing being revised up.
One notable point was the decline in food services (-0.4%M)– the largest decline since January. This category more broadly has been losing momentum as households pull back discretionary spending and move back towards eating at home. Softness in dining out, gasoline sales, and building material sales pushed headline retail sales below control…
… We are now tracking 2Q consumption at 1.9% annual rate, a tick below 2.0% growth in 1Q24. Goods consumption is tracking 0.7% Q/Q annualized growth in 2Q24, stronger than -1.9% in 1Q24, but a slowdown from 3% in 4Q23 and 4.9% in 3Q23. We expect goods consumption to remain weak this year, growing by just 0.6% 4Q/4Q in 2024, before rebounding in 2025 to 2.5% growth, off lower interest rates and a pick-up in housing activity. Services consumption is tracking 2.0% growth in 2Q24.
The Bank of England offers some excitement as investors await the start of the UK interest rate easing cycle. That start is probably not today, but should be soon. The BoE relishes dissent and discussion to help form higher quality decisions (the Federal Reserve might like to take note), making policy outcomes less predictable. With consumer price inflation down nine percentage points from the recent highs, the case for lowering real interest rates is strong—but the BoE might want a couple more data points before acting…
Wells Fargo: May Retail Sales Miss Suggests Consumer Momentum Fading
Summary The downside miss for May retail sales amid downward revisions to past data paint a picture of a softening consumer, but weakness appears overstated when considering lower inflation. We look for a gradual moderation in spending to take hold as the year progresses.
… And from Global Wall Street inbox TO the WWW,
Apollo: The Positive Effect of Fed Hikes On Consumer Spending
When the Fed raises interest rates, money market funds pay a higher dividend to households. The chart below shows that this effect is very significant and currently running at $500 billion, or around 2.5% of consumer spending. Put differently, Fed hikes are boosting consumer spending through higher money market fund dividends.
Source: BEA, ICI, Haver Analytics, Apollo Chief Economist. Note: Q1 2024 and Q2 2024 are estimates, dividends include dividends paid and dividends reinvested. Consumer spending is PCE.
Bloomberg: Treasuries Are a Whisker Away From Erasing This Year’s Loss
US Treasury gauge was down as much as 3.4% for 2024 in April
Markets have seen peak in US government bond yields, GSFM says
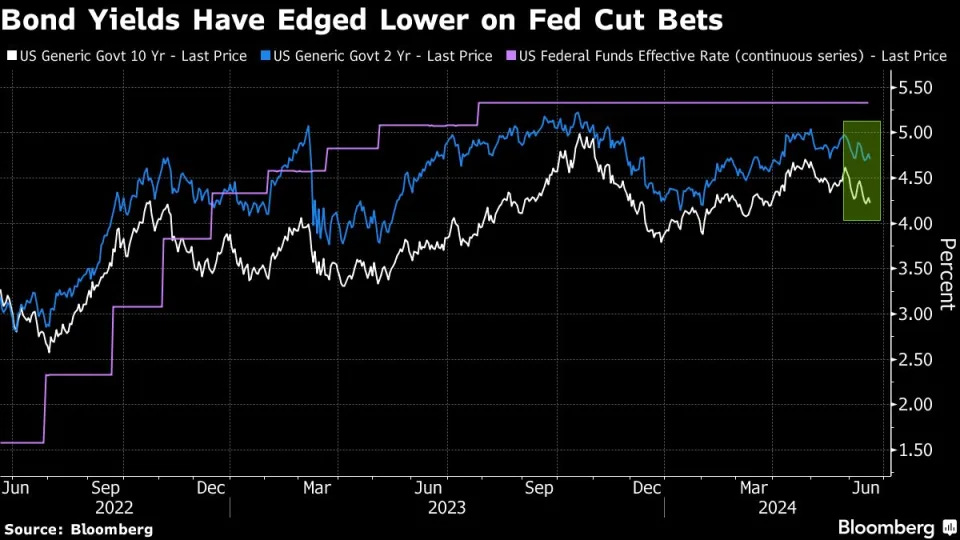
… A Bloomberg gauge of returns in the world’s biggest bond market is now down just 0.1% for 2024, after having lost as much as 3.4% for the year in April. At the heart of the rebound are investor bets that cooling US prices will convince the Federal Reserve to cut interest rates sooner and by more than officials have signaled, effectively putting a lid on how high Treasury yields can climb.
“We’ve seen the peak in yields,” said Stephen Miller, four-decade market veteran and investment strategist at GSFM in Sydney. “Bonds are now back as having a deserved place in a multi-asset portfolio.”
Treasuries have been whipsawed this year, with policy-sensitive two-year yields surging above 5% in April as fears over higher-for-longer US rates spurred investors to dump bonds. They have since dropped back to around 4.70% as inflation-to-retail-sales data suggested the world’s biggest economy may finally be cooling enough to warrant lower borrowing costs.
… “The key thing here is that that spread between market expectations and what the Fed is pricing has narrowed,” said Desmond Fu, a portfolio manager at Western Asset Management in Singapore. “That reduces volatility.”
Not everyone sees upside for Treasuries. Strategists at Barclays Plc earlier this month recommended switching back to shorting the 10-year note as they wager on a rebound in US economic activity following back-to-back weaker-than-expected data prints.
Bloomberg: Funds stay bullish, but central banks hold their breath (Authers YEST)
Global politics is terrifying. Across the western world, the established order is under challenge. In Russia and China, a new one is taking shape that many in the West dislike. But it’s still not too difficult to make money in the markets. The classic 60/40 asset allocation (60% equities and 40% bonds) has just ascended to an all-time high, according to Bloomberg’s global index:
Whatever the pessimism in the zeitgeist, it isn’t affecting the world of investment. For evidence, the latest edition of Bank of America Corp.’s monthly survey of global fund managers shows a continuing rise in overall bullishness, expressed by reduced allocations to cash and heavier moves in stocks:
The majority of managers — 53% — think there will be no recession in the next 18 months…
EPB Macro: America's Income Crisis: How It's Triggering a Collapse in Birth Rates
…The economy maintained a long-term real private income trendline of 2.8% from 1966 until 2008, and then it broke. It broke once more after the pandemic.
This is why consumers are feeling so downbeat about the economy despite the gains in the stock market. The average American continues to fall short of there they expected to be 5 years and 10 years in the future.
What’s happening is that as the economy becomes increasingly indebted, both at the private level and the public government level, the ability of the private sector to rebound from shocks and recession is impaired.
In the past, we’d have a recession, real income gains would drop but then recover in the next expansion.
Now, each time there is a recession or a shock, the private sector fails to regain the prior trendline in terms of the ability to generate real income, and the consumer is left with a feeling of falling further and further behind – this is the true situation facing most Americans that don’t have large stock portfolios to offset the reality of a weaker and weaker private sector…
WolfST: The Foreign Holders of the Ballooning US Debt: They’re Buying, But Don’t Keep Up
As China dumps Treasury securities, the Euro Area, Canada, and financial centers load up with immense appetite.
AND … investing is easy IF … you know what yer doing …
Was watching Margin Call yesterday. Considering you were 'in the chair' that day, when it's Hitting the FAN, are those emergency meetings & chaotic trading scenarios realistic? I admit I love the Jermey Irons character-"This is IT!". Bone Chilling!


Was watching Margin Call yesterday. Considering you were 'in the chair' that day, when it's Hitting the FAN, are those emergency meetings & chaotic trading scenarios realistic? I admit I love the Jermey Irons character-"This is IT!". Bone Chilling!
Investing's even easier if you're a GSIB w/a Primary Dealer Drip Line :)