while WE slept: USTs flat on light volumes; 2s10s steepeners(BNP); R* trendin' higher (DB); 'Is 60-40 still dead? Absolutely not!' (AOR?) and WMTs recession signal...
Good morning … #Got20s? If NOT and you’d like some, today’s yer time to shine …
… and this daily setup in addition TO what WEEKLY CHART noted as leaning nearer overBOUGHT territory making yesterday’s ‘concession’ slightly more common sensical.
Kindly add to this ‘analysis’ a story you’ll find in full just below from The Terminal …
Bloomberg: Trading Indicator With 100% Win Rate Signals Sell Long Bonds Now
Sell signal on TLT ETF triggered Friday after Treasuries rally
Strategy kicks in when momentum reaches extreme levels
…BlackRock Inc.’s $51 billion bond exchange-traded fund tracking Treasuries due in more than 20 years (TLT) surged on Friday through what technical strategists call the “trading envelope,” a breakout that suggests the fund was overbought. The move triggered a sell signal in a strategy based on the indicator, which calls for traders to unload the security when it reaches overbought conditions and to buy when it is deemed to be oversold.
The “moving-average envelopes” strategy has generated three previous signals this year — in January, February and April — and all turned a profit. It has returned roughly 18% in 2024, the best among more than 20 strategies using technical indicators tracked by Bloomberg.
Source: Bloomberg
The tactic — which aims to bet against a security’s momentum when it becomes extreme — has worked well this year as Treasuries oscillated in wide ranges along with expectations for Federal Reserve monetary policy…
… full detail / context below BUT an excellent read on day one gets to bid for 20s, which TLTs are an excellent proxy.
Anywhos … get those bids in Chicago voting style, early and often!! But first, ReSale TALES …
ZH: Retail Sales To Beat Estimates According To Latest Card Spending Data
Last month was the first time in about a year, when the Bank of America retail sales forecast - one derived from real-time debit and credit card spending and which is usually spot on and unerringly correct - was wrong, predicting a small beat when in fact the final number was a big miss, printing unchanged on consensus estimates of a 0.4% increase, with the control group unexpectedly contracting by a whopping 0.3%.
So will tomorrow's retail sales be two in a row when Bank of America's cheerful forecast has been wrong? We doubt it: after all, as regular readers are aware the hit rate of BofA's approach is remarkable.
With that in mind, BofA reports that total card spending per household (HH), as measured by BAC aggregated credit and debit cards, was up 0.7% year-over-year (y/y) in May, if down 0.9% month-over-month (m/m) in May on a seasonally adjusted (SA) basis. This comes on the back of a 1.3% surge in BAC card spending per HH in April, and a 0.7% drop in March. The bank attributes these large fluctuations to the lingering effects of this year’s unusually early Easter weekend…
… and if so, more ‘concession’ coming soon, to a theater near you and me soon AND those leaning on trading envelope signals likely to continue enjoying 100% success rate of the strategy. Time will tell and speaking of time, here is a snapshot OF USTs as of 705a:
… HEREis what this shop says be behind the price action overnight…and they’ll be gone ‘til Monday …
… WHILE YOU SLEPT Treasuries are basically flat after a modest RBA-inspired bear steepening move overnight on ~80% volumes. Antipodean weakness on the ‘hawkish hold’ (3y ACGBs +5.5bps) initially dragged JGBs (JPY 10y swaps +1.1bps) and USTs weaker, though light buying interest out the curve from real$ saw USTs recover into the London session. Franchise flows saw modest fast$ steepening interest in the front-end, but activity generally remains light prior to a steady drip of data and Fed-speakers today. Commodities are mixed to lower (CL -0.2%, HG -1.3%, NG +0.9%, XAU -0.5%), while APAC risk performance was solid (NKY +1%, SHCOMP +0.5%, KOSPI +0.7%). France govvies are 2bps tighter to Bunds alongside peripheral outperformance, while EU banks (+1.3%) and the DAX (+0.4%) are up in early trade. S&P e-minis are showing flat here at 7:15am.
… and for some MORE of the news you might be able to use…
WSJ: Rent Hikes Loom, Posing Threat to Inflation Fight Rents in several Northeast, Midwest cities are rising this year; Fed chair calls housing situation complicated.
NEWSQUAWK: US Market Open: US equity futures are mixed, Dollar is firmer & AUD benefits post-RBA; US Retail Sales due … USTs are softer by only a handful of ticks and resides just off today's lows, ahead of US Retail Sales and a slew of Fed speakers. USTs in a narrow 110-08+ to 110-16 band, which has edged to a new WTD base by a tick.
Divided government is probable, with legislative gridlock limiting the fiscal policy impact to risk assets. Corp taxes at the lower bound could be a LSD tailwind to SPX EPS & a bigger headwind if raised, but both unlikely. Expanded tariffs would be a modest hit to SPX EPS, mainly via cyclical & growth sectors.
BARCAP: French 2024 parliamentary elections: Between a rock and a hard place
Candidate registrations closed on 16 June and the latest polls suggest President Macron's coalition is squeezed between the left coalition New Popular Front and Mrs Le Pen's National Rally party. The two most likely outcomes based on polls remain a hung parliament or 'cohabitation'.
BNP: Quant trades of the week (gettin’ steepeners on … )
KEY MESSAGES Market Themes:
US hard data surprises and France election risk premium have prompted fast regime changes, while past FCI levels imply a re-acceleration in US hard data by the middle-end of June.
The current ‘R’ market regime implied probability may have been partly driven by France idiosyncrasies. Our valuation models suggest that FX is pricing in the smallest premia within assets under our coverage.
This week’s projection continues to see past FCI levels imply a reacceleration in US data strength, albeit to a lower level than previous readings. This accounts for the week-on-week tightening in financial conditions, reflecting the French election premium manifesting itself through higher vol and weaker equities.
This week we focus on tactical and relative value trade ideas amidst the rising French election risk premium.
… Initiating US 2s10s steepener: US 2s10s has been bull flattening recently, in line not only with US hard data deteriorating versus both trend and consensus, but due to a more hawkish move in Fed dots and strong demand during US supply.
US 2s10s now looks 15bp (-2.5 za-scores) too flat, US 10y looks 19bp (-3.0 z-scores) too low, while US 2y is trading more in line with its fair value, only 3bp (-0.5 z-scores) too low, our analysis suggests.
US 2s10s trade at the bottom of the range and tactically look positioned at an attractive entry point for steepness. Given that we have just seen US inflation data surprise significantly to the downside, any further upside in activity data would more likely lead to a steeper US curve rather than bear flattening, we argue.
Given current MarFA™ Macro mispricing, we tactically enter a US 2s10s steepener, targeting -33bp.
Global growth for 2024 and 2025 should be robust, not over-hot. Disinflation continues, but the journey to target is not quite over yet, and the road should stay bumpy. With confidence that inflation is trending downwards in 2H24, the Fed follows the ECB’s start this month and begins cutting in September.
Markets – All Is Well in Moderation A benign macro backdrop and rate cuts set up a constructive outlook for risk assets. Fair fundamentals and supportive technicals act as additional tailwinds. But uncertainties cloud the outlook beyond year-end, with US elections a key risk event.
Strategy – Focus on the 3 Cs – Cheap Optionality, Convexity, and Carry
… Cross-Asset Themes | It’s Always Sunny in Pivot-Landia A clearer path of disinflation, growth, and easier policy over the next few months sets up a constructive outlook across markets.
… Asset Class Views | Global Rates Tactically neutral on US duration; bullish in the EA; bearish on JGBs
Wells Fargo: Construction Caught in the Cross Currents Fiscal Policy Helping Construction Cut Through Interest Rate Headwinds
Summary Prospects for the Built Environment
The construction sector seems to be defying restrictive monetary policy. Total construction spending ended April up 10% on a year-over-year basis. To be sure, the recent rise in financing costs and tighter lending standards have weighed on project outlays, in particular residential and commercial development. A downdraft in new project starts for these types of construction suggests a drop in activity is ahead in the near-term.
That noted, several segments of construction have performed considerably better, thanks in large part to fiscal policy. Notably, there has been a boom in manufacturing project spending directed toward the build-out of electric vehicle and semiconductor supply chains following the passage of the CHIPS and Science Act. The Inflation Reduction Act and Bipartisan Infrastructure Law have been a boon for investment in energy and infrastructure projects.
Looking ahead, the fiscal tailwinds look set to only intensify over the next few years as more funding from these federal programs is distributed. Meanwhile, the drags imposed by restrictive monetary policy should begin to fade as the Federal Reserve gradually lowers the federal funds target rate. Currently, inflation appears on the path back to 2% and, as such, the FOMC looks to be getting ready to initiate an interest rate cutting cycle at some point this fall. Although likely to remain elevated compared to recent norms, lower interest rates should ultimately lead to a stronger pace of construction.
Source: U.S. Department of Commerce and Wells Fargo Economics
Wells Fargo:Bank of Japan Pauses Along Its Policy Normalization Path
Summary
The Bank of Japan (BoJ) did not make any meaningful policy changes at its June 13-14 meeting, reiterating that it would encourage the uncollateralized overnight call rate to remain at around 0.0%-0.1% and would conduct bond purchases in accordance with the decision made at its March monetary policy meeting.
The monetary policy statement did include a signal that the BoJ would reduce its pace of bond purchases following their July 31 meeting. In a post-meeting press conference, Governor Kazuo Ueda noted that officials would take a careful approach to this process, but that the size of the change could be "substantial".
We believe further monetary policy normalization is ahead. However, given our outlook for only gradually improving economic growth, inflation and wage growth trends, we believe the BoJ will take a gradual approach to policy normalization.
We maintain our view for the BoJ to wait until October to deliver another policy rate increase, where we expect a 15 bps hike in the uncollateralized overnight call rate to 0.15%-0.25%. Beyond that, we forecast the BoJ will wait until its April 2025 announcement before delivering a 25 bps rate hike.
We also expect the BoJ to normalize policy through a gradual reduction in the pace of its bond purchases, a process which we believe the BoJ will enact independently of the timing of any policy rate increases. In our view, the BoJ will reduce its pace of bond purchases by 1 trillion yen at a time, beginning in July with a confirmation of a slower ~5 trillion yen pace of bond purchases through the remainder of Q3-2024. We then see a slowing to ~4 trillion yen pace in Q4-2024, ~3 trillion yen pace in Q1-2025 and ~2 trillion yen pace from Q2-2025 forward.
… And from Global Wall Street inbox TO the WWW,
Bloomberg: Trading Indicator With 100% Win Rate Signals Sell Long Bonds Now
Sell signal on TLT ETF triggered Friday after Treasuries rally
Strategy kicks in when momentum reaches extreme levels
A technical trading strategy with a perfect trading record this year is signaling that it’s time to sell long-maturity Treasuries after a rally last week.
BlackRock Inc.’s $51 billion bond exchange-traded fund tracking Treasuries due in more than 20 years (TLT) surged on Friday through what technical strategists call the “trading envelope,” a breakout that suggests the fund was overbought. The move triggered a sell signal in a strategy based on the indicator, which calls for traders to unload the security when it reaches overbought conditions and to buy when it is deemed to be oversold.
The “moving-average envelopes” strategy has generated three previous signals this year — in January, February and April — and all turned a profit. It has returned roughly 18% in 2024, the best among more than 20 strategies using technical indicators tracked by Bloomberg.
Source: Bloomberg
The tactic — which aims to bet against a security’s momentum when it becomes extreme — has worked well this year as Treasuries oscillated in wide ranges along with expectations for Federal Reserve monetary policy.
Last year, it fared poorly, losing about 6.5% across five trades, modestly trailing the performance of a simple buy-and-hold strategy. The Treasury market overall struggled for most of 2023, until the final two months of the year when it rallied as bets mounted that the Fed would soon pivot to easing.
The indicator’s latest signal flashed Friday, when it called for investors to sell at the open Monday, after Treasuries posted their biggest weekly advance since December. Benchmark 10- and 30-year yields fell to the lowest level in more than two months Friday after slower-than-expected inflation data last week boosted confidence that the Fed may start cutting rates as soon as September.
On Monday, 30-year yields rose as much as 8 basis points to 4.43% and the TLT fund — one of the most actively traded bond ETFs — slumped more than 1%, as traders braced for a wave of corporate issuance this week.
The last time the strategy sent a trading signal was a buy on April 16, when 30-year yields rose to 4.8%, at the time their highest for 2024.
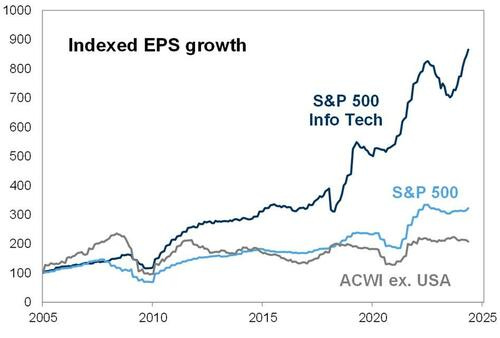
Goldilocks (via ZH): 5 Stocks Account For 60% Of The S&P's YTD Return: Charting The S&P 5 vs The S&P 495
Nvidia (NVDA) accounts for 34% of the 14% SPX year-to-date gain, and five stocks have accounted for 60% of the S&P 500 total YTD return; MSFT, NVDA, GOOGL, AMZN, and META have collectively surged by 45% and now comprise 25% of the S&P 500 equity cap.
A key reason for this unprecedented outperformance is that these five companies posted Q1 EPS growth of 84% YoY vs 5% for the typical S&P 500 stock. Furthermore, strong results for the past four quarters have prompted analysts to raise their 2024 EPS forecasts by 38% for these five Tech stocks. In contrast, the profit forecast for the other 495 stocks in the index have been reduced by 5%…
… Recessions are typically felt first, and ultimately more emphatically, by lower income individuals than by the wealthier parts of the economy. Walmart specifically caters to the lower income distribution and thereby could provide an early read on a burgeoning recession. The WRS compares Walmart’s stock price performance to a group of stocks whose businesses are tied to the wealthiest parts of the economy – the S&P Global Luxury Index. As economic activity slows and recession risk builds, retailing purchasing patterns tend to gravitate toward discounters like Walmart and away from luxury retailors. Consequently, a rise in the WRS could warn of a potential recession.
The accompanying chart overlays the WRS (blue line) with corporate credit spreads (red line). Since 2007, the WRS and corporate credit spreads have moved closely. When recession risk builds credit spreads often widen and spending trends typically are driven toward Walmart and away from high end retailors. Both the WRS and credit spreads provide similar recession warnings. What is most interesting, however, is when they diverge.
In 2007, both correctly began warning about an approaching recession which ultimately was the Great 2008-09 Recession. In 2015-16, however, when credit spreads widened significantly to about 8% implying another recession was nearing, the WRS remained docile “correctly” indicating that credit spreads were giving a false signal about a near-term recession. Then, in the last half of 2019, while credit spreads stayed tight suggesting the economy was healthy, the WRS spiked higher and “correctly” gave investors an early warning of the 2020 pandemic recession…
Blake Millard from The Sandbox Daily: When markets price presidential elections, plus the vibecession, a conversation with Ryan Detrick and Sonu Varghes… (having been part of the ‘40’ for over 25yrs, not sure that segment can / will readily be summarized by AOR … but then again, maybe it can and that’s precisely why i’m no longer card carrying member?)
… Is 60-40 still dead? Absolutely not!
The iShares Core Growth Allocation ETF (AOR) is BlackRock’s simple solution to build a globally diversified portfolio using a single low-cost fund so investors can easily access a 60-40 portfolio (60% stocks, 40% bonds).
Despite the significant drawdown in fixed income that resulted from central banks synchronously raising interest rates in 2022-2023, the recovery in equity markets has been so powerful that it has propelled the 60-40 portfolio back to all-time highs. This is welcome news for investors who utilize this fairway shot when choosing an asset allocation strategy at a moderate level of risk.
As Mike jokes: “60/40, which died long ago, closed at an all-time high (on a total return basis).”
The WMT recession indicator is fascinating, predicts the mild 'non-recession' of 1st half of 2022. The persistent 20 yr inversion of the 30 yr also fascinates me, believe it's an inversion of 3 yrs in late Oct wowzers!


Talking Data Episode #298: Thoughts on CPI and the Fed Meeting
With Jim Bianco
https://youtu.be/YvtkG0FgsgQ?si=_YWHnKmSmBQrFGhT
The WMT recession indicator is fascinating, predicts the mild 'non-recession' of 1st half of 2022. The persistent 20 yr inversion of the 30 yr also fascinates me, believe it's an inversion of 3 yrs in late Oct wowzers!