Good morning … Here are a few things I am thinking about as the week comes to a close and will mull over ahead of JPOWs speech (845a — welcoming remarks at conference on International Roles of the US Dollar — HERE is link to calendar — search today’s date / activity and the watch live link).
Overnight, BOJ unchanged, adds to their statement that “it is necessary to pay due attention to developments in financial and foreign exchange markets and their impact on Japan’s economic activity and prices”. For more,
ZH: Yen Tumbles As BoJ Refuses To Change Ultra-Easy Monetary Policy
This will matter and I’ve got somewhat more in a moment.
… here is a snapshot OF USTs as of 728a:
… HEREis what another shop says be behind the price action, you know,
WHILE YOU SLEPT Treasuries are modestly cheaper, led by the wings (2s5s10s -3.2bps) and underperforming EGBs (FR 10y -9bps) after the BoJ did not alter policy course overnight and the ECB’s Lagarde pledged to support peripheral spreads (5y BTP -21bps). There were some block buyers of FV put options (FVQ2 110s) and selling of upside plays in TY (TYQ2 116/118 CS) overnight. The London session has seen block sellers in TU totaling ~1mln/01, while the 2s5s curve is flattening after re-testing the May lows at ~19bps in early trade. Risk-assets are buoyant alongside the move in USDJPY (+1.6%) to 134-handle, SPX futures showing +31pts here at 7am. Crude is flat, Copper is lower by -0.5%, while the DXY is +0.7% alongside a slide in AUD (-0.8%).
… and for some MORE of the news you can use » IGMs Press Picks for today (17 June) to help weed thru the noise (some of which can be found over here at Finviz).
From the NOTHING WITHOUT CONSEQUENCE department, note the largest weekly increase in US mortgage rates since 1987 according to Freddie Mac. For MORE context,
A few other items that popped up over the course of the day which rattled MY cage and which I cannot let go — might be needing to rehash these — and which may / may not help as we collectively form views about a way forward — ie where’s next 25bps?
ZH: Bond Meltdown's Next Driver Is BOJ Policy Implosion
Interesting idea esp as it comes same day a fan fav analyst of a large German institution asking,
What happens to global markets if the BOJ abandons YCC?
1. Expect a snap in JGB 10y yield by 50bps, and a big curve steepener; 2. USD/JPY down by 5 big figures initially; 3. Nikkei -5% as financial conditions tighten sharply, and expected future BOJ QE is much more restrained. 4. Japan bond and equity vol leaps higher on a sustained basis, keeps USD/JPY vol elevated with big USD/JPY vol curve inversion. Obvious global spillovers: 5. More of G10 yields higher, risk softer, but could see this contained to more of a one or two day trade. 6. Select USD softer vs G10 (given much greater short-term and long-term short JPY exposure versus USD than most G10 pairs. We would expect an increase in Japan investor long-term hedge ratios will keep USD/JPY under pressure. 7. Favorite EM ‘carry’ trades financed by yen, and under-hedged, lose the most. Notable possibles: BRL, MXN, ZAR, IDR, INR. Toshin foreign currency assets as one select indicator of asset exposures can be found here: https://www.toushin.or.jp/ english/statistics/
Now as far as any ‘meltdowns’ are concerned, some definition in form of an updated call from large German institution
We now expect 10yr yields to reach 3.85% this year, reflecting a view that the Fed will hike rates much more aggressively than previously anticipated, and term premia (slope adjusted for the monetary policy cycle) should rise further to reflect: (a) high inflation, (b) higher inflation risks, and (c) shifts in supply/demand. Consistent with our economists' Fed outlook, our forecast implicitly assumes a peak fed funds rate of 4.125% in Q1 2023. We also assume that the market will move to price 100bps of cuts in late 2023 and early 2024.
We anticipate 2s/5s to invert toward year-end as the intermediate sector will likely be more affected by the market pricing Fed cuts and a lower end-of-cycle policy rate. We also expect 10s/30s to trade flat to slightly inverted given the long-end convexity value and pension support. We see scope for a meaningful resteepening of the curve in 2023 if the Fed moves toward a softer stance in the second half of the year.
With bond meltdown and higher rates calls in mind, here’s a visual of a different angle / same story — from Bloomberg
The cracks are widening in the credit market. Spreads on US junk bonds topped 500 basis points for the first time since November 2020, an important psychological level that shows investor fears of higher defaults is growing. As my colleague Natalie Harrison points out, higher premiums make it more expensive to borrow for companies that need funding the most. It's becoming a particular problem for firms with poor credit ratings due to weak cash flows or high debt loads compared to their earnings. And even blue chip corporate bonds are under pressure. US investment grade bond funds have seen 12 straight weeks of withdrawals, the longest losing streak going back to at least 1992, according to data compiled by Bloomberg. Still, spreads remain well below levels indicating significant market dislocation, such as the peak of the pandemic fears or the financial crisis. But the stress is mounting as traders increasingly price in the risk of a US recession in the bond market.
How are YOU positioned at the moment? 60/40? risk ON? hiding (in the front-end? cash?)? Goldilocks attempts to answer at least part of this as they are,
… we build a framework to impute real money positioning from US bond fund returns and assess its usefulness as a forward-looking indicator for Treasury yields.
We assess the extent to which this class of investors are over/underweight duration by estimating average duration (and curve) betas of the largest constrained bond funds in excess of a benchmark bond market index. Reversals in asset-weighted exposure (the “Fund Positioning Indicator”), with appropriately calibrated thresholds, generate useful buy/sell positioning-based signals.
Yields tend to rally following a reversal from bearish extremes (identified by the indicator re-entering pre-determined standard error bands), and sell off on reversals from bullish extremes. We find that since 2015, 10s have rallied over the next six months 75% of the time after our Fund Positioning Indicator has generated a buy signal; meanwhile, 10s have sold off 58% of the time in the six months following a sell signal.
At present, our positioning monitor suggests real money accounts remain underweight and have increased their steepening exposure relative to the index (though this could reflect their pre-existing mortgage underweights). However, we do not see a turning point in positioning that would generate a buy signal yet.
… Exhibit 1 shows the average asset weighted net duration position of each fund class versus the Agg’s estimated duration. Here, a negative value suggests funds are net underweight relative to the Agg whereas a positive value suggests an overweight position. This metric suggests that funds have been underweight Treasuries this year. This is particularly true in the case of core bond plus funds, which seems reasonable given the more flexible mandate these funds tend to have.
What does this tell us about the current fund positioning? Exhibit 3 shows the estimated net positioning of bond funds vs Barclays US Agg index in Treasuries and curve by quarter over the last year on an asset weighted (on the left) and equal-weighted basis (on the right). At present, our implied fund positioning indicator (FPI) seems to suggest that real money accounts have increased their duration underweights in the current quarter. This could be reflective of their carry-over underweight positions in mortgages since Q1 given the extension in MBS duration. While the FPI has breached the lower standard error band, funds have not started adding long positions in size to generate a buy signal yet. For curves, our framework suggests real money accounts reduced steepeners in Q1 (relative to the Agg), but have since increased this exposure this quarter.
As stocks and credit spreads are one in the same trade (IMO), and with positioning in mind, here’s something from Barclays to consider
The last time the Fed hiked rates by 75bp in Nov'94, and the ECB's 'whatever it takes' of Jul'12, were each followed by a strong equity rally. Now, much higher inflation makes it trickier to engineer a soft landing. And while a recession is almost priced in, capitulation remains elusive and CB's put still feels far off.
…Déjà-vu 2012 for the ECB? Adding to the market angst, it is not only the Fed that is in aggressive tightening mode now, but all the other main DM central banks (except the BOJ). The SNB was the last one to surprise market expectations on Thursday, delivering a first rate increase in 15 years, which was followed by another hike by the BOE. After its hawkish meeting last week, we did not have to wait too long for the ECB to shift to fire fighting mode. The emergency meeting on Wednesday initially helped to ease fragmentation concerns in the bond market, with spreads coming off after the big increase of the previous days. But in contrast to the 'whatever it takes' moment of Jul'12, this time around euro was left unimpressed by the vague Governing Council's comments. Back 10 years ago, high inflation was not a concern for the ECB, and the Draghi's put strike marked the peak of stress in peripheral bond markets and the trough in equities. But now, EA inflation is much higher, growth is slowing, and the ECB has not even started to normalise policy. Although past experience shows that the ECB knows how to handle bond market stress, our economists believe that designing an operational, credible and effective market fragmentation tool is going to be a challenge given conflicting views in the GC and potential legal challenges (see ECB Update - The courage to act or not to act, 15 June 2022). As seen in the last few days, EU banks are sensitive to gyrations in peripheral spreads, as they own large shares of domestic government bonds (which might actually prompt the ECB to act sooner rather than later). We continue to like Banks given they benefit from higher rates while the sector has materially strengthened balance sheet, asset quality and profitability. But renewed stress in peripheral bond market would be a concern, while the sector is unlikely to be immune if we follow the classic recession script.
That in mind and from a European angle, here’s what US stock jockeys are asking,
With equities now firmly in bear market territory, a natural question is if all the risks are already in the price. While pricing of stagflation risk is a tad too pessimistic there are several other negative drivers which are not appropriately priced in our view.
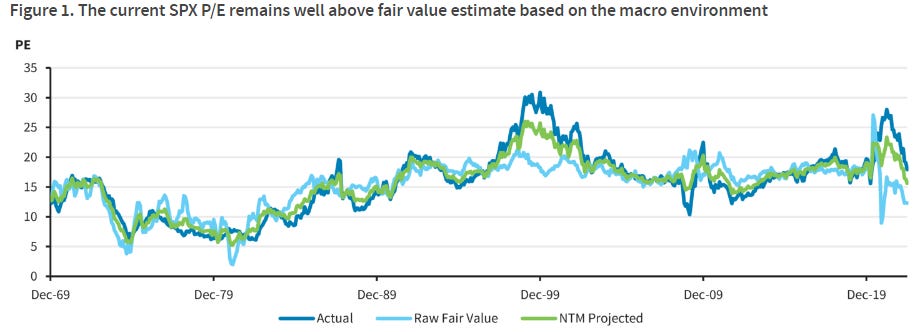
… Valuations approaching our macro adjusted fair value estimates As we have discussed previously (see U.S. Equity Strategy: Beware of the 'Reasonable' Valuations Trap, 6/1/22), it is dangerous to use the pre-pandemic levels as a benchmark for "fair level" of valuations since the macro environment is clearly different now. Instead, we prefer to use our fair value model which explicitly adjusts for the prevailing macro conditions. Empirically, the level of inflation is the most important driver (rather than real yields as is popularly believed) and hence the current level of inflation is a major headwind for valuations. Figure 1 shows the current raw fair value and our actual projected value. The latter is a weighed mean of the raw value and current levels to account for the fact that the reversion to the raw value does not happen instantaneously.
Chart of the Day: Unprecedented volatility in fixed income markets continues, with German 10yr Bond Yields seeing the largest ever true range on record (i.e. high to low daily range), driven by the disparate drivers of a surprise 50bps SNB hike, the BoE and an article that a new anti-fragmentation tool would involve offsetting purchases of peripheral bonds by selling other securities. Despite all this, the market reversed sharply from our next previously identified support/objective at 1.895%, posting a large “shooting star” bullish candlestick. This sharp reversal suggests the market may now move into a new short-term consolidation phase, as we argued in the spotlight above.
The firm TURNED tactically bearish 5yy following closing BREAK ABOVE 3.105% looking for move up to 3.765% (w/stop below 3.265%). The firm will turn tactically BEARISH 10s @ resistance (3.28). The firm has also put some hay in the long bond barn noting
… Our successful tactical bearish bias from 3.085% reached support at 3.425/46%, where we turned tactically neutral. We intend to stay tactically neutral going forwards given our curve flattening view and more rangenbound outlook for the longer end.
And, well, given continued increased volatility and in addition to the ‘Fed memo’ noted HEREyesterday, a more realistic set of binary choices Fed currently is apparently faced with