while we slept; a picture(s) worth a thousand words; "Beware The Bible"; implied forward curves; impact from QT; got20s?
Good morning … they say a picture is worth a thousand words and so,
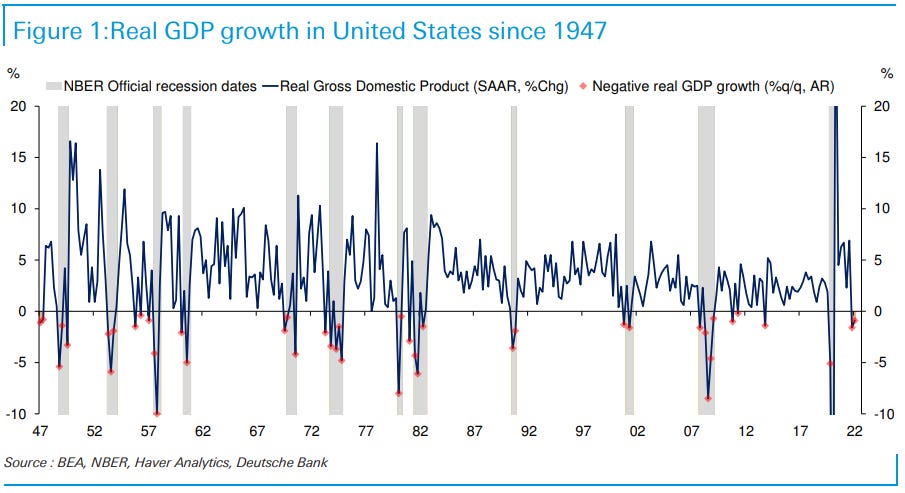
I’ll spare you my ‘2 cents’ as this economic ink blot test can and will continue to be the focus for the remainder of the summer. I will only say that I am sympathetic to both sides of the debate BUT as a former markets guy, the price action (outright, curve) is where those are putting their money where their mouth is and I would respect that, first and foremost. It’s one thing to listen to those up in the Ivory Tower and quite another to be knee deep in career-risk trades / investments. When you look at that visual above (and before you consider couple below), think about the the worst downturn of our lifetime prior TO C19. 2008 now hardly shows up on the map. The economic backdrop is still normalizing and CPI will remain a concern beyond the next few weeks. The Fed knows this…and likely knows what its next move is going to be. The markets are attempting to price this in here / now rather than wait.
The next FOMC meeting (calendar HERE) is not until September 20-21. Between now and then, the next most important date to keep in mind would be the Jackson Hole Economic Symposium run by the KC Fed and THAT takes place August 25-27. This year’s title, “Reassessing Constraints on the Economy and Policy,"
… here is a snapshot OF USTs as of 720a:
… HERE is what this shop says be behind the price action, you know,
WHILE YOU SLEPT
Treasuries are modestly lower, and the curve steeper, dragged along by the under-performing Bund and Gilt markets after EU growth and inflation readings surprised to the upside. DXY is notably lower (-0.5%) while front WTI futures are higher (+2.3%). Asian stocks were mixed, EU and UK share markets are all higher (SX5E +1.3%, SX7E +2.3%) while ES futures are showing +0.8% here at 7am. Our overnight US rates flows saw continued selling of the long-end from Asian real$ while USDJPY saw a violent move lower (-0.8%) as well. Overnight Treasury volume was decent at ~120% of average overall (20's and 30's led with ~150% of average volume overnight).… we wonder aloud if the lagged relationship between M2 money growth and CPI will play out as implied in the coming months- similar to the way that shelter costs have risen with a lag to HPA (18mo lag there too, as we've posted) this year...
… and for some MORE of the news you can use » IGMs Press Picks for today (29 July) to help weed thru the noise (some of which can be found over here at Finviz).
A couple MORE items which may be of interest, both here from REUTERS and are specifically relating TO aformentioned DRAG on USTs (Bunds and Gilts)
Euro zone inflation hits yet another record high after big jump
… Still, the ECB has made clear that inflation fears trump growth concerns, suggesting that policymakers are willing to lift rates even if that hurts growth, as inflation is now at risk of getting embedded…
Euro zone Q2 growth accelerates, defies expectations of slowdown
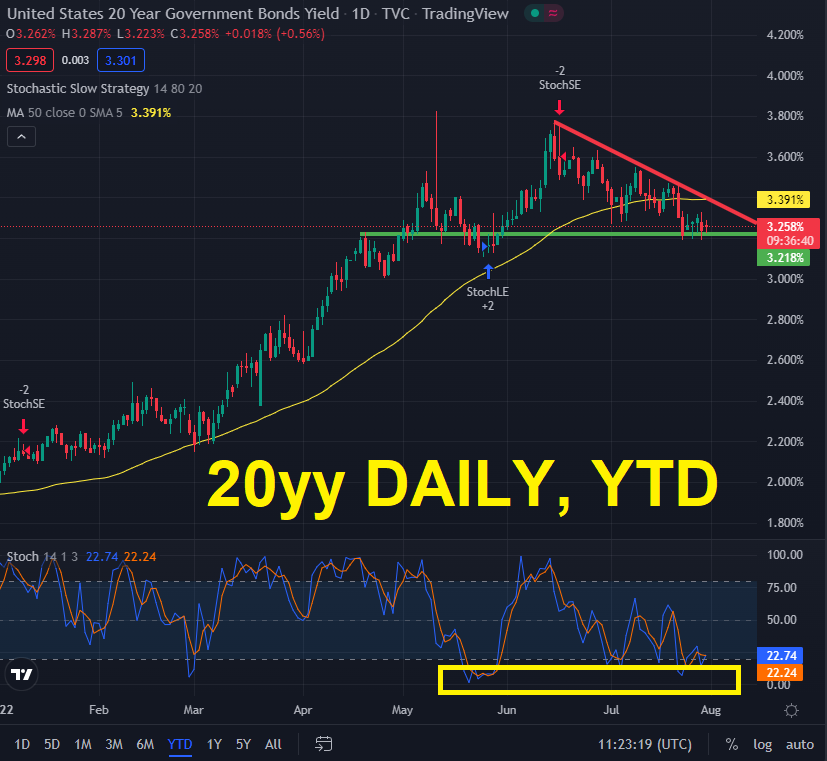
Before jumpin’ in to a couple items from Global Wall Street’s inbox, here’s a look at the 20yy ahead of the next quarterly refunding (August 1st, if I’m not mistaken) where it’s assumed more cuts to issuance will be announced.
I’ve highlighted couple levels and conditions which may be of interest (3.22 resistance as ‘the market’ approaches overBOUGHT territory just ahead of supply plans … which, as you know, ALWAYS cuts both ways with a concession always welcomed BUT with reduced supply, perhaps it will be less than hoped for…)
Given the bigger than big week almost behind us with a Fed hike into what is clearly an economic slow down as those in DC are angling for some large green new deal like tax hikes, there are a few things from Global Wall Street’s inbox I would like to share…
First, somewhat more regarding the large German banks visual above,
A technical US recession maybe, but not a "proper" one, writes Jim Reid. Why? Because the unemployment has not yet risen materially. That raises the question of why there is such focus on two consecutive quarters of negative growth. The answer: since 1947, there have never been two successive negative quarterly GDP prints in the US without it being ultimately included in an 'official' recession as designated by the US National Bureau of Economic Research.
So it would be incredibly foolish to dismiss the fact that we might already be in recession but for a quarter or two or three, this time could be slightly different.
Then there’s this important one from the CHARTS Department — CitiFXs BIBLE (2s5s) annotated SO I ask you … if a picture is worth a thousand words, what then if the picture also has a thousand words on it?
If The Shoe FITS: Beware The Bible
… The question to be asked is “Are we there yet” and the answer is YES.
We have talked/written on this topic many times in recent months but this time we have reached (in my view) a very critical juncture.
2’s 5’s long term chart
Yesterday the 2’s 5’s curve inverted to minus 22.69 basis points.
Why so specific?
CLICK through to read on about WHY so specific but continue to watch this spread (and any further inversion below -25bps, for example).
Since we’re throwing around yield curve indicators, the latest WEEKLY FIX from BBG
Treasuries resurgent on bets the Fed will blink
Calling the Top
Peak inflation may or may not be here, but bonds are leading the way in declaring that the top is in for aggressive central bank tightening. Global bonds are set for their best monthly gain since 2020, bouncing back from a record slump in the first half of 2022.
A few months after bond investors shot down Federal Reserve Chair Jerome Powell’s thesis that inflation would be “transitory,” they are now rushing to bet that he will get cost pressures under control. While Powell assured the US that this year’s rapid 2.25 percentage points of rate hikes do not a recession make, a second-straight contraction in gross domestic product led traders to slash rate expectations.
Bonds had already started pricing in a recession. A Powell-favored part of the yield curve is flattening at a record pace to sound the alarm. There are concerns that markets are misreading the Powell pivot, as well as debate on whether it might be too early for such a shift amid decades-high inflation.
Nevertheless, investors are very confident inflation is coming down sometime soon, and that will allow the Fed and other major central banks to ease off on the pace of tightening.
Australia, for example, saw traders pare rate expectations even before the Fed met. Bonds rallied hard as inflation there jumped to the fastest annual pace for 20 years, missing expectations it would reach a 30-year high. The moves may have been exacerbated by lingering low-liquidity concerns.
The Bank of England has already moved to a cautious approach on raising rates, which Goldman Sachs Group says will hurt the pound. And the European Central Bank may also end up lifting rates less than had been expected, with JPMorgan Chase warning the region is set for a recession by year’s end…
Finally, part 2 of a series from WFC
The Fed's Balance Sheet: Your Questions Answered
Part II: What Is the Impact from QT, and When Will It End?Summary
In Part II of this three-part series, we discuss the impact on financial conditions from quantitative easing (QE) and quantitative tightening (QT) as well as the outlook for the size of the Fed's balance sheet over the next several years.
QE primarily affects financial conditions through two channels: the portfolio balancing channel and the signaling channel. The former works by reducing the supply of certain securities thus increasing their price and lowering their yield. The latter works as a form of forward guidance regarding the future path for the federal funds rate. Research suggests that the significant growth in the Fed's balance sheet over the past 15 years has kept financial conditions more accommodative than they otherwise would have been.
The exact impact of QT on Treasury yields and financial conditions more broadly will depend ultimately on how much the Federal Reserve reduces its $9 trillion balance sheet. So what is a "normal" or "equilibrium" size for the Fed's balance sheet, and how long will it take to reach that size?
The Fed's balance sheet was equivalent to about 6% of nominal GDP, on average, between 1990 and 2007. Returning to that ratio today would require a balance sheet of roughly $1.5 trillion, an enormous $7.4 trillion decline from current levels.
We think it is highly unlikely the Fed's balance sheet will return to $1.5 trillion anytime soon. An "ample reserve" framework makes the pivot to QE much easier should it be needed in the event of another deep economic downturn at some point in the future. In addition, the post-2008 regulatory regime for the financial system has created an environment in which demand for bank reserves is structurally higher than it once was.
So when will QT end, and how big will the balance sheet be at that point? Projecting the optimal size of the balance sheet is primarily driven by identifying the "right" level of bank reserves.
The Federal Reserve's experience with QT from 2017-2019 provides a useful template for when the central bank might stop QT during the current episode. We assume that the Fed will end the process of balance sheet reduction when the amount of bank reserves falls to about 8.5% of GDP.
Our calculations show that the reserves-to-GDP ratio will approach 8.5% in early 2025. Therefore, we project that for the balance sheet to reach its "equilibrium" size, QT would continue unabated through Q4-2024, slow in Q1-2025 and then stop altogether in Q2-2025.
Under this scenario, we project that the Fed's balance sheet would recede from its current size of $8.9 trillion to about $6.5 trillion in Q1-2025. Research suggests that this would be roughly equivalent to raising the target range for the fed funds rate by about 50 bps on a sustained basis.
The FOMC probably wants to approach the "terminal" amount of bank reserves slowly rather than stopping the process of balance sheet reduction abruptly. Our calculations show that the reserves-to-GDP ratio will approach 8.5% in early 2025 (Figure 9).9 Therefore, we project that for the balance sheet to reach its "equilibrium size," QT would continue unabated through Q4-2024, slow in Q1-2025 and then stop altogether in Q2-2025.
But the odds of a recession are clearly elevated at present. Should the economy enter a downturn in the foreseeable future, then the Federal Reserve likely would bring QT to an end well before its balance sheet has reached $6.5 trillion. Under either scenario, the Fed's balance sheet would likely remain elevated for the foreseeable future.
The good news to remember, and I quote,
Sorry. Not sorry … THAT is all for now, hopefully I’ll get time this weekend for somewhat MORE.
Off to the day job…


