Good morning / afternoon / evening - please choose whichever one which best describes when ever it may be that YOU are stumbling across this weekends note…
First up, lets deal with a couple / few data points from yesterday since it may well be last batch of data — of consequence — we get for awhile …
CalculatedRISK: Personal Income increased 0.4% in August; Spending increased 0.4% CalculatedRISK: PCE Measure of Shelter Slows to 7.4% YoY in August ZH: Savings Rate Tumbles To One-Year Lows As Fed's Favorite Inflation Signal Remains 'Sticky' High
One of The Fed's favorite inflation indicators - Core PCE Deflator - slowed to 3.9% YoY in August (its lowest since Sept 2021). Headline PCE jumped up to +3.5% YoY, its highest since May...
ZH: UMich Sentiment Sinks In September, Inflation Expectations Rise Intramonth
Right … ok SO markets into weeks / months and QUARTERS END … with long bonds UP nearly 80bps on the quarter,
I’ll only say momentum (stochastics) remains overSOLD and so, ripe for a consolidation at any time … OR, perhaps this overSOLD condition works itself off with time at a price … I’ll move right along.
Before jumping in TO what I learned from Global Wall Street this weekend, I interrupt to bring you this message from WSJs Heard On The Street — bond BULLS have given up, apparently …
… Bond bulls are now giving up, says George Goncalves, head of U.S. macro strategy at MUFG Securities. He thinks that if interest rates just stay at current levels beyond a year or so, interest costs will become a strain on government finances. But rates also could fall without repression, because of the drag they are now exerting on the U.S. economy, forcing the Fed to ease.
Thanks in part to the bond vigilantes, the late 1990s were great for bond investors and epic for stocks. The coming years could look very different.
Will check in on some bond bull / bear ‘mathiness’ next — at least as far as I can do nowadays … with an updated look at CoTR data in just a moment.
But first, some words from our ‘sponsors’
RTRS: Fed's Williams says central bank may be done with rate rises
… “My current assessment is that we are at, or near, the peak level of the target range for the federal funds rate,” Williams said in a speech text. “I expect we will need to maintain a restrictive stance of monetary policy for some time to fully restore balance to demand and supply and bring inflation back to desired levels.”
HERE is the speech in the case you are having any trouble sleeping at night OR wish to place bets WHO is telling truth — Ka$hkari OR Williams — let me know and thanks.
BAML- Flow Show w/chart of FF going back to 1915 Barclays- upgraded econ outlook based on recent data flow BMOsetting up fwd entry LONG 2s (4.98, 40dMA) Citi(FX)s CoTD — 30y yields likely to FALL (thank ‘nasty shooting star) DB- specs EXTEND NET SHORT by 122k contracts (TY equiv) GMO Q3 letter - “Beyond The Landing” — just read it MS- remaining LONG 5s (but now, NOW they’ve got ‘tight stop’ — thanks) SocGen- techs, 10s ‘inching’ up towards 4.84/88 in ‘relentless’ uptrend
Moving along and away FROM highly sought after and often paywalled and Global Wall Street narratives TO a few other things widely available and maybe as useful from the WWW
There is something weird going on in US government bond markets, and the relentless increase in long-term interest rates is quite ominous for the economy, and perhaps also for financial stability.
We are late in the cycle, and Fed hikes are biting harder and harder on consumers and firms. Stock markets see the negative effects of tighter monetary policy, and equities are trading lower. But long-term interest rates should be going down, not up.
So what is going on?
With the term premium accounting for the entire move in long rates since July, we know that the source of higher long-term interest rates is not Fed expectations.
If the move is not driven by changing Fed expectations, what are then the reasons why long rates are moving higher? There are several potential explanations…
… No matter which explanation is more important, it is clear that the spike in rates is having a very negative impact on consumers and firms, and the risks of a hard landing are intensifying.
For investors in the 60/40 portfolio, the ongoing volatility in a high rates environment is stomach-churning, see chart below. Over the past two months, the 60/40 portfolio has lost 5%, and with an outlook of high rates and slowing earnings—which is needed to get inflation under control—the outlook for the 60/40 portfolio remains negative.
Barring an act of God or Congress, the US government will likely shut down this weekend. While that’s typically a non-event for markets in the grand fullness of time, this particular episode lands at a sensitive juncture for Treasuries.
Unlike in recent shutdowns, the Federal Reserve’s monetary policy dial is firmed turned to restrictive territory with well-telegraphed plans to stay there. That’s a much different setup than the record 35-day government shutdown that kicked off in December 2018, when the Fed had signaled it was about to wrap up its hiking cycle and was tilting dovish.
That backdrop means that unlike the handful of government shutdowns we’ve seen over the past couple decades, Treasuries yields may continue to climb throughout, according to JPMorgan Chase & Co.
“The thing that actually concerns us is there’s an acute awareness and concern on fiscal right now and Treasury supply, to the extent that that has manifested itself with an increase in term premium over the past couple months,” JPMorgan’s Jay Barry, co-head of US government-bond strategy, told me on Bloomberg Television’s Real Yield. “That’s something that may even pressure Treasury yields modestly higher if we have a shutdown.”
Which isn’t exactly a soothing message to hear after September’s breathless selloff, which sent yields across the curve careening to decade-plus highs — particularly on the long-end of the curve. Even with a late-day bid in US trading on Thursday, 10-year yields are currently hovering just below 4.6%, after entering the month below 4.2%…
Bloomberg (via ZH) - Bonds Remain Oversold After Fastest Yield Rise On Record
Authored by Simon White, Bloomberg macro strategist,
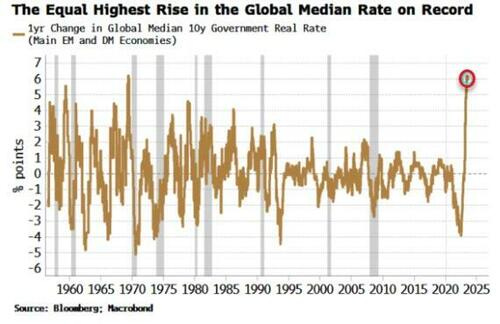
Bonds continue to look oversold after the equally-sharpest rise in the global median real yield seen in at least 60 years. More consolidation in the shorter term is anticipated as bonds continue to work off their oversold condition.
Yields across DM have hit cycle highs in recent days. They started to swing lower Thursday afternoon and are following through in the European morning.
Term premium has been rising as bonds’ efficacy as a portfolio and a recession hedge is impaired when the stock-bond correlation is positive. After most of the last two decades being negative, the correlation is positive again as inflation and inflation expectations have a greater influence on markets.
The global real yield of the largest EM and DM countries has increased by the most over one year since 1969, rising by over six percentage points.
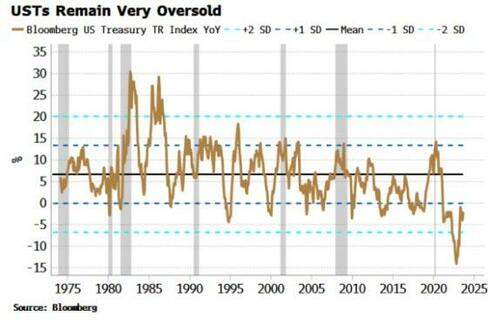
After such a rise, bonds are likely due some interim relief or consolidation. They remain oversold on a short and a medium-term basis. The chart below shows that US bonds are still more than one-standard deviation below their long-term mean growth rate.
Positioning is generally long, so there is a risk of more selling if bonds continue to fall, but a stabilization should see positions held on to.
Moreover, +4.5% yields will start to look irresistible to many longer-term buyers of debt, such as liability matchers.
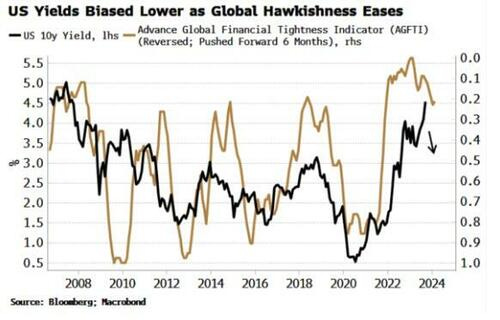
Further, peak global hawkishness is behind us. The Global Financial Tightness Indicator (GFTI) is a diffusion of central-bank rate hikes around the world. When it’s falling, as it is today, it means fewer banks are raising rates.
As the chart below of the GFTI shows, US 10-year yields tend to track its ups and downs. The easing of the GFTI should mean less impetus for higher yields (for now).
Nonetheless, the secular picture for bonds remains inhospitable. Rising inflation expectations, mounting supply, and bonds’ diminishing hedging utility (these are all sides of the same coin), mean that any rally in bonds would be considered a trade, not an investment.
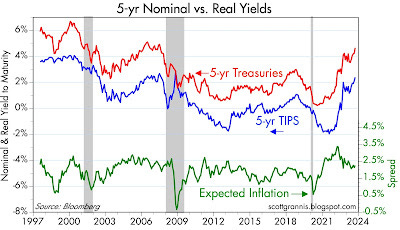
… Chart #6 looks at the level of 5-yr real and nominal yields, and the difference between them (green line), which is the rate of inflation the market expects to prevail over the next 5 years. Inflation expectations are well grounded, and have fallen in the past year or so—thanks to the Fed's decision to jack interest rates up. One important conclusion thus appears: interest rates are higher not because of inflation fears, but because of the Fed's actions. And the Fed's actions appear to be driven meaningfully by mistaken worries that the economy might prove to be too strong and thus inflation might remain too high. Balderdash: the economy is still experiencing sub-par growth even as inflation has plunged. Growth didn't cause inflation, deficit spending that was monetized did, and it's not happening anymore.
ING - US inflation slows, but higher savings mean a resilient consumer
The Fed's favoured measure of inflation undershot expectations and has boosted the case for the Fed not hiking rates in the current quarter. But huge upward revisions to houshold savings suggests the consumer can remain more resilient than we thought likely and supports the case for the Fed keeping monetary policy tighter for longer
The drop in U.S. equity markets this month created technical damage and oversold conditions. Despite the widespread selling pressure, the S&P 500 managed to hold up above its rising 200-day moving average (dma).
Oversold conditions of this magnitude are rare during an uptrend and historically point to a buying opportunity based on positive forward returns during commensurate periods.
So long September—seasonality trends improve into year-end. The fourth quarter is historically the best quarter for the S&P 500, with average gains of around 4.2%.
… The sharp drop this month created oversold conditions. The Relative Strength Index—a momentum oscillator used to measure the speed and magnitude of price action—slid to 30.3 on Tuesday, marking its lowest reading in 12 months. Furthermore, oversold conditions within the index have become widespread. Earlier this week, over 20% of S&P 500 stocks reached oversold levels based on RSI readings below 30. At the sector level, defensive sectors such as utilities, real estate, and consumer staples were the most oversold, suggesting (along with sector breadth and relative performance) that there has been no major discernable shift from offensive to defensive sector positioning.
State Street - What's the impact of a government shutdown?
US Government Shutdown Is Not Just Theater The impending US government shutdown does not have significant macroeconomic implications given that the debt ceiling agreement would kick in by year-end and restore normal operations at similar levels. In this regard, it will mirror most previous shutdowns, with consumption and investment patterns largely unaffected. The shutdown nonetheless portends future fiscal stress as well as political risks going into the 2024 election cycle.
… Overall, debt servicing costs are going to continue to rise, leading to the second signal: difficult politics ahead.
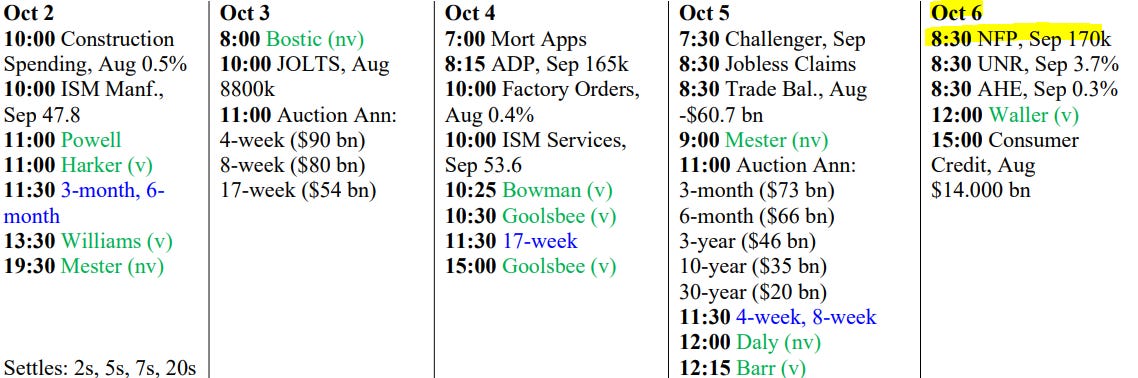
… AND for any / all (still)interested in trying to plan your trades and trade your plans in / around FUNduhMENTALs, here are a couple economic calendars and LINKS I used when I was closer to and IN ‘the game’.
Keeping in mind, too, this all may NOT happen as data releases will be put on hold IF there is in fact a government shutdown … and if there IS,
ZH: Here Is What Stops, And What Doesn't, When The Government Shuts Down This Weekend
First, this from the best in the strategy biz is a LINKthru TO this calendar,
Call me a simpleton, but Simon at Bloomberg hit the gorilla right between the eyes w/a 2-ton heavy thing: MOUNTING SUPPLY. IMO it's simple math, that ever-increasing Avalanche of DEBT being main-veined into the financial markets, along with IRA 'stimulus', the economies being choked out. IMHO!


")

I just like how Steve doesn't use the word "curated" about his service! Such a goldmine of information in a 10 min read.
Call me a simpleton, but Simon at Bloomberg hit the gorilla right between the eyes w/a 2-ton heavy thing: MOUNTING SUPPLY. IMO it's simple math, that ever-increasing Avalanche of DEBT being main-veined into the financial markets, along with IRA 'stimulus', the economies being choked out. IMHO!