(USTs are lower, STEEPER on ~120% avg vol) while WE slept; Ka$kari, (a)durable goods; "For the first time this year, Bloomberg's 60/40 is TRENDING DOWN"; S&P493 now equal weight;
Good morning … Yesterday was fun ( boy that accelerated quickly … OR a boiling frog sort of analog — please choose one). Or so I’m told and can surmise from the price action …
Weren’t those data points just adoorable? (More on durable goods below) Perhaps it was KA$HKARI comments?
CNBC: Fed’s Neel Kashkari isn’t sure if interest rates are high enough to stop inflation
These comments aren’t new ‘news’ as we’ve recently consumed and digested the updated DOTS PLOT, right? Combined at days end …
ZH: Bonds & Bullion Purged As Crude & King-Dollar Surge Into Qtr-End
In totality - they didn’t seem to help (or matter) as rates POPPED in TO the 5yr auction and I believe that helped get auction of 5s done …
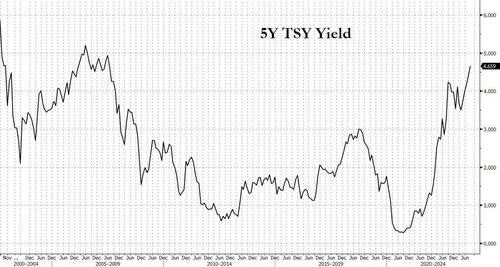
ZH: Strong 5Y Auction Prices At Highest Yield Since Summer Of 2007
The last time a 5Y auction priced here, quants suffered a historical meltdown.
We are of course talking about the summer of 2007, and just like then, moments ago the 5Y auction priced at a high yield of 4.659%, and up 16bps from August. But thanks to the ongoing collapse in rates across the curve, the auction stopped through the When Issued 4.671% by 1.2bps, the biggest stop through since May (when it was 1.4bps) and follows three consecutive tailing auctions.
And while the Bid to Cover was just 2.52, down from 2.54 last month and tied for the lowest since March, internals were quite solid, with foreign demand surging to a 4 month high as Indirects took down 71.15%, up from 67.9% last month and one of the highest on record. And with Directs awarded 17.6%, below the 6-auction average of 18.9%, Dealers were left holding 11.2%, the lowest since May's 9.3%…
… Overall, there was solid demand for today's auction, largely thanks to the yield which at 4.66% was the highest in 16 years. As a reminder, the 5Y at 5% is what BofA's Michael Hartnett called the Big Cyclical Buy signal. We are now just over 30bps away.
Said another way, supply (at a price)brought out it’s own demand … for better or worse. Unsure if said process will be so comforting to those friends still tasked with tidying up portfolios ahead of week / month / QUARTERend and / or international buyers of DURATION (7yr auctions typically better gauge of this demand than, say 2s or 5s), but they will get an opportunity to show their resolve (or lack thereof) with this afternoons 7yr auction …
… diggin deep to try and find something nice to say ‘bout markets here / now and while a bit premature to talk MONTHLY charts and TLINES, it would appear to ME (at least now, to best of my limited capabilities) that here / now would be as good a time as any for RATES to hold … pause … and whether the move HIGHER continues or not, well, might be a topic for continued discussion in days/weeks/months and quarters just ahead.
AND … here is a snapshot OF USTs as of 705a:
… HEREis what this shop says be behind the price action overnight…
… WHILE YOU SLEPT Treasuries are lower with the curve still pivoting steeper off a little-changed front-end. German bunds and especially UK Gilts have led the heave-ho this morning. DXY is lower (-0.3%) while front WTI futures are little changed after touching above $95 earlier (see attachments). Asian stocks were generally lower but Chinese shares held up well, EU and UK share markets are mixed while ES futures are little changed here at 7am. Our overnight US rates flows saw another futures block-dominated Asian session with more FV-US switches printed along with two 5k blocks in TYs posted. Our Asia desk flows saw better fast$ buying from the front-end out to intermediates. Our London desk continues to see better selling from their region with fast$ selling in the belly a feature there. Overnight US Treasury volume was ~120% of average across the beard.
… Our first shows that Treasury 30yr yields have spiked to a support zone derived by a cluster of move highs in yields seen between 2008 and 2011. Long-term momentum (lower panel) still guides bearishly but we'd not be surprised if 30yr yields spend some time around 4.80% over the coming weeks.
Clearly we’re all fishin’ here in the same pond trying to find some sorta levels of importance, present them to YOU (whoever and where ever you are) and HOPE it preserves our own — ‘stratEgerist’ — relevance. Thankfully, I’m no longer compensated in that way and so … I’m just a messenger and, as I always was, am on your (investor. PM, trader, reader, humble observer) side of the table
… and for some MORE of the news you can use » The Morning Hark - 28 Sept 2023 and IGMs Press Picks (who CONTINUES to be sportin’ that new, fresh look) in effort to to help weed thru the noise (some of which can be found over here at Finviz).
From some of the news to some of THE VIEWS you might be able to use… here’s SOME of what Global Wall St is sayin’ …
Apollo - Why Are Long Rates Going Up?(asking the right question … sorta … problem is NO answers as to WHEN it stops and WHEN to back up the proverbial truck and load up long bonds … only to say, watch NEXT mo’s NFP as IT will be THE most important ever … aren’t they all?)
The term premium is up one percentage point since late July, see chart below showing that the ongoing rise in long rates is driven less by changing Fed expectations and more by:
1) The US sovereign downgrade
2) Japan exiting YCC
3) Fed QT
4) Fewer dollars for China to recycle in a falling exports environment
5) The US budget deficit
6) The large stock of T-bills and the Treasury’s intention to increase auction sizes.
Looking ahead, the real risk to the economy, including financial stability, is if weak economic data doesn’t result in falling long-term interest rates. The Treasury market’s reaction to the employment report next week will be very important and likely set the tone for markets in Q4.
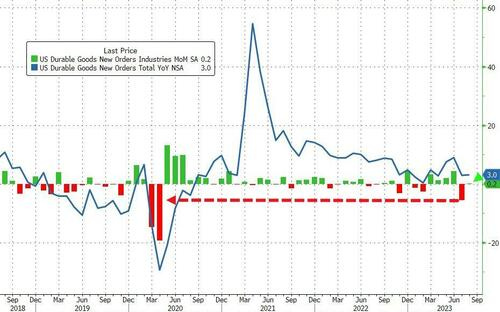
Durable Goods Orders in August unexpectedly increased +0.2% MoM vs. -0.5% consensus. July was revised to -5.6% from -5.2%. Ex-transportation improved +0.4% MoM vs. +0.1% July and +0.2% forecast. More relevant to Q3 GDP expectations were the non-defense ex-aircraft figures -- orders jumped +0.9% MoM vs. +0.1% expected while July was revised to -0.4% from +0.1%. Shipments were notably stronger as well, gaining +0.7% in Aug compared to a flat consensus and -0.3% July change. The inventories to shipments ratio was unchanged for the fourth consecutive month at 1.84x. Overall, it was a solid read that has done nothing to offset the "no landing" narrative …
Bloomberg BNP - US: Government shutdown may leave Fed, markets in extended fog (this note title screams, ‘we’ve got nothing to add BUT please don’t forget ‘bout us)
KEY MESSAGES
A federal government shutdown at the end of September is now our base case.
Economic effects could amount to 0.1-0.2pp on annualized GDP growth each week the shutdown persists. We view the low end of that range as likelier given the promise of backpay, with effects largely reversed as services restart.
Nonfarm payrolls are unlikely to reflect much impact for technical reasons, but the unemployment rate could rise above 4% in October data.
In our view, a lengthy shutdown would help stay the Fed’s hand at November’s meeting, as major data releases on employment and prices would be unavailable starting on Monday, 2 October.
In the context of a highly data-sensitive Fed, the absence of reliable data could lead to a repricing of market expectations for further tightening. We expect this will support our existing view for lower front-end yields and could prompt a tactical USD retracement.
Higher energy prices, and the underlying reasons for them, have important ramifications for global macro.
We eventually expect macroeconomic headwinds to push prices lower from current levels, but near-term risks are skewed higher and there is a wide range of uncertainty.
We assess the impact of higher energy for our views on curve steepeners, the EUR, FX carry trades, G10 and EM commodity FX, breakevens and EM rates markets.
… A stagflationary shock, at least for now Renewed risks to growth and inflation: The recent rise in oil prices is likely to weigh on economic activity while putting upward pressure on headline inflation.
In other words, it is another stagflationary shock to the global economy. The precise impact is uncertain, however, as is the reaction of central banks. In part, these will depend on the size and duration of the shock…
… Higher oil prices support high-for-longer policy rates … We think central banks will be more attentive to the inflationary implications of the shock than the growth ones – Fed Chair Powell does not want to risk repeating the mistakes of Arthur Burns, while the ECB hiked interest rates in September despite a weaker growth outlook, on inflation risk-management grounds.
All else equal, then, the shock increases the risk of requiring tighter policy, which could be achieved through either a higher peak or a longer duration of restrictive rates. To be clear, we are not changing our policy forecasts on the back of these moves, in particular because our base case assumes that second-round effects will be more contained this time around, due to the magnitude of the shock being smaller and generally less excess demand in economies now.
Overall, we think the key implication for central bank policy is to support a ‘high-for-longer’ environment, with cutting cycles starting relatively late. Indeed, we see both the Fed and ECB beginning to cut rates – while leaving them restrictive still – from mid next year. Higher headline inflation on the back of the spike in oil prices could reduce the risk of an earlier move…
… Steeper curve view challenged by higher energy prices…
BNP - US rates: Closing 3m10y strangle at stop-loss (the idea which sounded good on paper — and which I understood if if I knew I didn’t understand it at the time — did NOT work out…shocking what happens when you use complicated and intricate financial tools to get long or short, eh?)
After initially ‘pivot flattening’ in reaction to September’s FOMC meeting, the curve bear steepened with 10y yields breaking to new cycle highs.
Over the past week, bear steepening has followed through with 10y yields up roughly 25bp and 3m10y vol up 20bp.
As such, the range trade we had expected in Q4 for 10y yields is not playing out and we have reached our stop on our short 3m10y +/-25bp strangle.
Hence we close the trade at 28.75bp for a 7bp loss …
… 10y yields break to new highs: While the yield curve initially reacted to the September’s FOMC meeting by ‘pivot flattening’ (long-end yields down, short-end yields up), markets quickly reversed course and began bear steepening…
Brean - Durable goods orders rose slightly in August on defense and capex rebound (read with British accent of John Ryding … )
Key Takeaways: The durable goods data are reported in nominal dollars and, therefore, it is important to adjust for price changes of manufactured goods in inflationary times. Although durable goods orders and core capital goods orders and shipments were modestly above expectations, when adjusted for price changes they point to relatively flat order growth in the third quarter and a small decline in business equipment spending. However, there are no signs here that the weakness in manufacturing activity is intensifying in the third quarter.
CitiFX Techs - As The Sun Rises: Oil on the boil (apparently I missed the memo that today’s THE day to finally recognize and talk EARL — OR everyone else got the wake up call just today — EARL matters?)
…Why it matters? Next resistance at $97.66 is >3% away, and price could move as high as $103, >8% away.
Bullish signs:
We saw support hold strong twice at 88.07 (September 5 highs)
We tested $93.74 resistance on Wednesday and look set to close decisively above on Thursday
We are on-track to post a bullish outside week
Original double bottom on the weekly chart (neckline at $83.53) suggests a formation indicated target of $103.
With a potential federal government shutdown looming, it is useful to review how prior shutdowns have impacted the economy and financial market participants. Given that no appropriations bills have been passed at the time of publication, a shutdown next week would likely involve all non-essential federal employees, making the 2013 episode a useful parallel.
The direct impact on real GDP is relatively straight forward. As in previous episodes, the BEA will consider the lost hours worked by furloughed federal employees as depressing the quantity of federal government consumption expenditures. We estimate that a full government shutdown resulting in 850k federal employees would depress quarterly annualized real GDP growth by roughly 0.1ppt per week.
Most importantly for market participants would be delays to economic data releases from the BEA and BLS. This was also a feature of the 2013 shutdown as both the September and October employment and CPI releases were rescheduled. For a data-dependent Fed, a government shutdown would provide another reason for monetary policymakers to "proceed carefully" in upcoming rate decisions, and likely keep rates steady at the November 1 FOMC meeting.
Goldilocks - Durable Goods Above Consensus Expectations (so above the CONsensus means the CONsensus will treat as good news (stocks) and so, bad news (rate CUT hopes?) … askin’ for a friend who’s NOT wanting to fall into trap of a GOOD Q3 GDP report and its meaning … mentioned HERE by 1stTrust just the other day )
BOTTOM LINE: Durable goods orders increased 0.2% in August, against consensus expectations for a moderate decline, and core capital goods orders also grew by more than expected. July growth was revised lower for durable goods orders, durable goods orders ex-transport, and core capital goods orders. We boosted our Q3 GDP tracking estimate by 0.2pp to +3.2% (qoq ar) and left our domestic final sales growth forecast unchanged on a rounded basis at +2.6%.
FirstTrust - New Orders for Durable Goods Rose 0.2% in August
… Implications: Durable goods orders surprised to the upside in August, with growth across most major categories. The only notable weakness came from commercial aircraft, where a June surge in orders has tempered over the past two months … In the past year, orders for durable goods are up 3.5%, while orders excluding transportation are up a more modest 1.1%. But when you consider that producer prices for capital equipment are up 3.8% in the past year, it means that orders have declined when adjusted for inflation. A number of factors are likely to keep the path forward rocky as we close out 2023: a tighter Federal Reserve, the tightening of lending standards following stress in the banking sector, and withdrawal symptoms following the COVID-era economic morphine that artificially boosted both consumer and business spending. In addition, the return toward services means a large portion of goods-related activity will soften in the year ahead, even as some durables that facilitate services recover. While the data to-date have shown continued economic growth, we believe a recession is likely before the end of 2024. Finally, we got data on the M2 money supply yesterday which declined 0.2% in August, and is down 3.7% from a year ago. Monetary policy operates with a lag, and we are likely to feel the negative economic effects of these declines in the months ahead.
■ Durable goods orders rose 0.2% in August on the headline, and rose +0.4% ex-transportation. Core capex orders also rose +0.9%, the biggest increase since March 2022. The headline is weighed down somewhat by a drop-off in Boeing orders, but the core is supported by demand fueled by the Inflation Reduction Act and CHIPS and Sciences Act. ■ The shipments data is also encouraging, with headline durable shipments up 0.5% and core capex shipments up 0.7%. The latter is a good proxy for nonresidential fixed investment in Q3 GDP. This 0.7% increase follows a -0.3% decline in July, so the data offers some more encouraging signs this month. ■ Going forward, capex investment demand is likely to be rangebound. There is support on the bottom from the legislation passed in recent years that directs investment into building factories for a variety of different things, but the upside is limited by the interest rate environment.
LPL - Housing Demand is Down But We See Value in Mortgage-Backed Securities (interesting … )
With the Federal Reserve (Fed) aggressively raising short-term interest rates in an effort to arrest generationally high inflation, interest rates across the U.S. Treasury yield curve have moved higher in concert. The move higher in Treasury yields has put upward pressure on most other business and consumer interest rates including residential mortgage rates. Last week the 30-year fixed national average rate for U.S. borrowers jumped to 7.41%, which is the highest level since 2000. Higher rates have certainly impacted the demand for housing. The release of today’s MBA mortgage applications index showed that home purchases and refinancing activity continue to fall with the broader index at its lowest level in decades. Moreover, purchase activity is down 27.3% year over year and refinancing activity lower by 21.4% year over year.
… We continue to think the risk/reward for Agency MBS is attractive, particularly relative to lower rated corporate credit. Yields and spreads (or the additional compensation for owning debt riskier than U.S. Treasuries) remain elevated relative to historical averages and with the Fed close to the end of its rate hiking campaign, falling interest rate volatility could be a tailwind to the asset class …
Wells Fargo - Durables Look Good From Afar, but Are Far From Good (good but not good … take yer pick however you wanna read … the headline / data point and / or this note)
Summary Durable goods orders exceeded expectations, and a surge in core capital goods shipments will lift estimates for third quarter business spending. Yet after backing out a surge in defense spending and accounting for steep downward revisions, the report gets a lot less exciting.
Yardeni - Saudis Have A Vision (don’t quit on the headline as I almost did … Dr Ed has what I think is an interesting point…)
Saudi Vision 2030 is the vision of Saudi Crown Prince and Prime Minister Mohammed bin Salman (MSB). He wants to diversify the economy of his country. Saudi Arabia’s sovereign wealth fund aims to spend $40 billion a year on the domestic economy—including the construction of Neom, a futuristic city in the desert with an estimated price tag of $500 billion. By some estimates that requires that the price of oil remains around $100 per barrel. It rose over $96 today, up 33% since mid-June (chart).
The rally has been attributable to voluntary production cuts by Saudi Arabia of 1.0mbd and 0.3mbd by Russia during the summer. On September 5, they both extended their cuts by another three months.
In our opinion, $100 oil will depress global demand for gasoline and other petroleum products. Indeed, it risks triggering a global recession if consumers are forced to cut back on other purchases. Another risk is that the rebound in oil prices will boost not only CPI energy prices around the world, but also put upward pressure on other prices and wages. That would force central banks to continue raising interest rates. Meanwhile, non-OPEC production should increase in response to higher oil prices. So MSB's vision of oil settling at $100 may be a desert mirage, in our opinion…
ZH: Durable Goods Orders Unexpectedly Bounced In August, But... (there’s always a big ‘ole BUTT isn’t there … on brighter note, perhaps once govt shuts down we’ll be spared some data …)
Thanks to a large downward revision for July (from -5.2% MoM to -5.6% MoM - the largest drop since the COVID lockdowns), preliminary August durable goods orders rose a marginal 0.2% MoM (vs -0.5% MoM exp).
Looking under the covers, we find more noise in this time series with orders ex-transports rose 0.4% MoM (+0.2% MoM exp), thanks to a big downward revision in July (+0.4% to +0.1%).
Additionally, we note that the value of core capital goods orders, a proxy for investment in equipment that excludes aircraft and military hardware, soared 0.9% last month after a revised 0.4% decline in July.
Core Capital Goods Orders have been downwardly revised 5 of the last 6 months...
Finally, as a reminder, this series in in nominal dollars...
… AND from highly sought after views you might be able to use TO a few run of the mill links widely avail on the intertubes (which ALWAYS truly surprise me — quite a level of goodness readily avail out there for the consumption)
… In such conditions, there’s nowhere to hide. Bloomberg’s global version of the classic 60:40 (60% stocks and 40% bonds) portfolio also appeared to hit a durable low in October. It’s now dropped back below its 200-day moving average once more, for the first time since the turn of the year:
That raises a number of questions…
… As ever, the greatest responsibility rests with the Fed. It always does. Everyone expected a “hawkish pause” at this month’s meeting of the Federal Open Market Committee — in other words, no rate hike, but a clear threat to raise rates further in future. Even so,the package of projections, in combination with the words of Chair Jerome Powell, sent the market into a funk. The 10-year bond yield has gained 50 basis points in the five trading days since that FOMC. Its three big jumps this month, marked on the chart below, were caused by the non-farm payroll data, the FOMC meeting, and Wednesday’s news on oil inventories.
Of course, it seems a tad unfair to blame Powell and his colleagues for this latest spike in yields. They only did what they’d strongly trailed they would do, after all, and didn’t even raise rates. The problem is the dawning realization that it’s not the speed of rate hikes or the level they reach that matter, so much as just how long the Fed intends to keep the economy in a vise.
… By the time the October bottom for Treasury prices, and high for yields, had been tested and confirmed by the banking crisis in March, it seemed a great bet that the overall low for the market had been made. Did anything give away that the October nadir couldn’t be trusted?
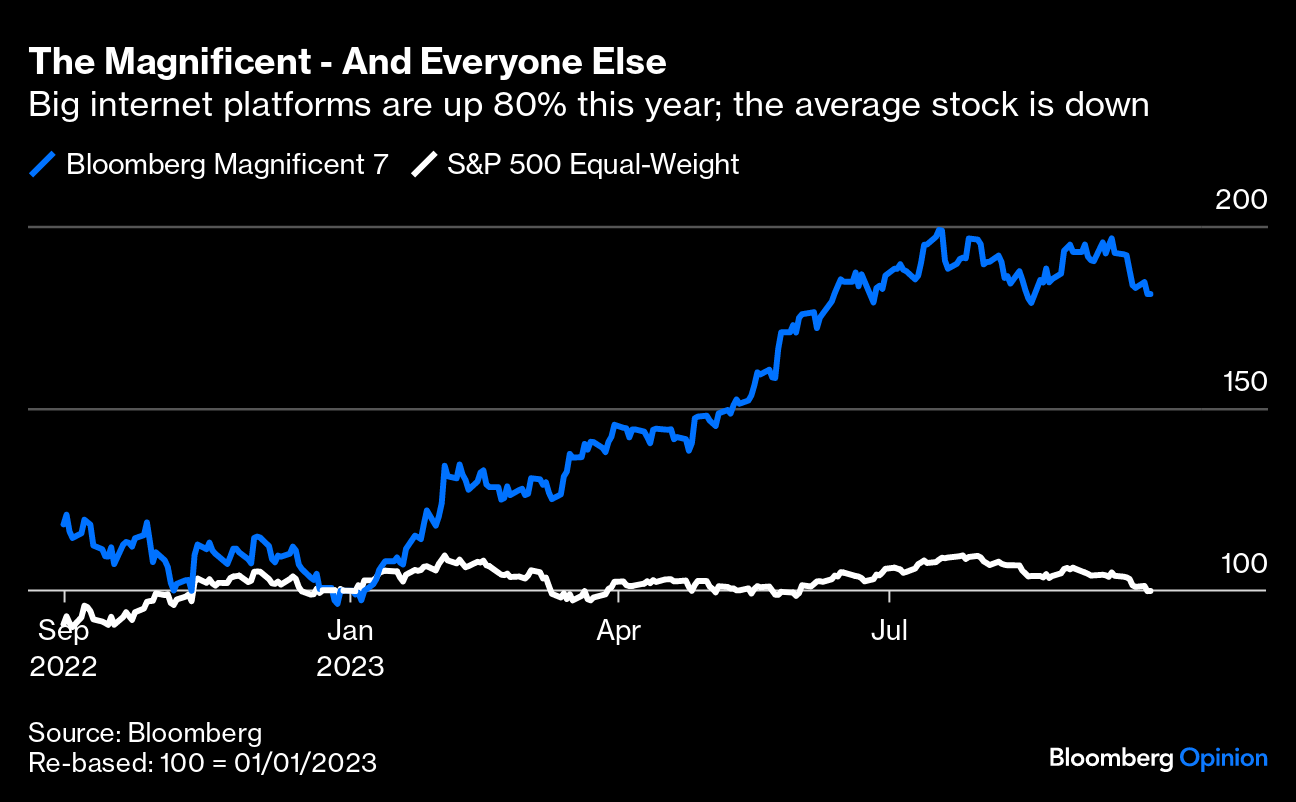
Peter Atwater of Financial Insyghts, whose recently published The Confidence Map is well worth reading, suggests that a “tell” about this rally was that true speculation remained absent. Volatility has remained startlingly low. And most telling, the companies leading the market are much more associated with safety than with speculation. To demonstrate this, check out the performance of Bloomberg’s index of the Magnificent Seven — Apple Inc., Amazon.com Inc., Alphabet Inc., Meta Platforms Inc., Microsoft Corp., Nvidia Corp. and Tesla Inc. — in comparison with the S&P 500 equal-weight index, which effectively measures the average stock.
The disparity is stunning, but note that this is nothing like the rally in dot-com stocks before the turn of the millennium, or even the boom in the smaller tech companies associated with Cathie Wood’s Ark Innovation ETF, which quadrupled in the aftermath of the Covid selloff. They were risky and speculative. The appeal of the Magnificent Seven, by contrast, is that they’re well established and can’t go too far wrong. If they’re leading the market, it suggests people are still cautious. And indeed, the fact that two of them are now under attack from the US government for unfair anti-competitive practices casts the entire rally in a discomfiting light; the companies on which we've relied on to keep our stock portfolios afloat are also, allegedly, ripping us off.
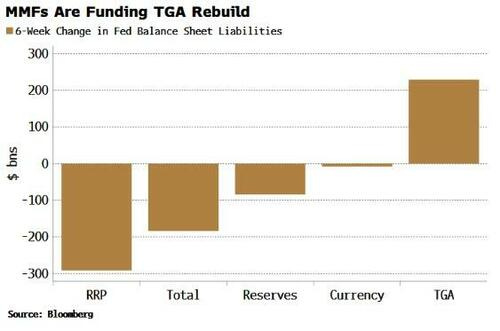
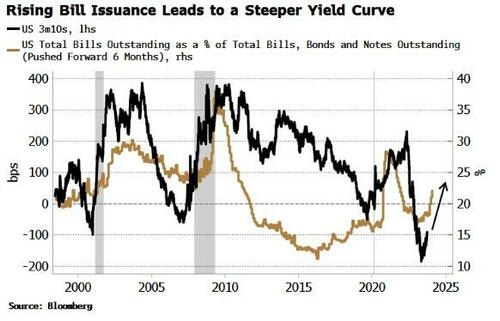
Bloomberg- Treasury-Bill Issuance Increase Will Support Steeper Yield Curve
… Bill rates are high enough above the RRP rate that (mainly) money market funds (MMFs) have been buying the issued bills, and drawing down on the RRP to buy them. Reserves have fallen only $85 billion over the last six weeks, despite $220 billion of TGA rebuild and ~$100 billion of QT.
Increased bill issuance is filling the TGA, and it also points to a steeper yield curve, as shown in the chart below.
The relationship is counter-intuitive at first. Increased issuance at the short end would mechanically lead to a flatter curve. But the fact the relationship is the other way suggests that demand is the more dominant driver of yields in the medium term. There is an elastic demand for bills (even more so when there is $1.8 trillion of liquidity on hand in the RRP), so that when supply increases, demand rises to meet it, while reducing demand further along the curve.
That’s perhaps even more germane in the current environment. If longer-dated bonds are losing their hedging capabilities in a positive stock-bond correlation environment, then shorter-dated debt or bills become increasingly attractive.
Bond Economics - At Least It's Not As Bad As 1994 (the h’line grabbed me as I was just a couple / few years in TO my career on Global Wall St and likely had NO idea what it was we were living / trading through out the time)
The current Treasury bear market has been impressive, and unfortunately for the bond bulls, there is no valuation reason for it to stop. For example, the 5-year Treasury is still trading well below the overnight rate. If we look back to the 1994 bond bear market, the 5-year traded about 250 basis points above cash — versus about 100 basis points below now…
It's the liquidity, stupid! My current favorite chart shows the S&P 500 running in tandem w/Fed net liquidity. So it's not so much the peak or pause in rate hikes that matters, but rather what happens to the Fed balance sheet & reverse repo operations.
InvestOpedia- Return of the Rising Rates (as a ‘visual learner’ these charts caught my attention — click thru for descriptive words if you wish / require…)
1/ 10-year Yield Resumes Uptrend
2/ 20+ Year Treasury Bonds Gap Down
3/ Credit Spreads Sanguine…For Now
WolfST- S&P 500 Equal Weight Index Dips into Red Year-to-Date. Shows Entire Market Depends on 8 Giants, but They’re Swooning Too (remindsME of that daily spark talking about the S&P493 being basically FLAT ON THE YEAR … but stocks … for the long run doesn’t nec mean ALL of them…)
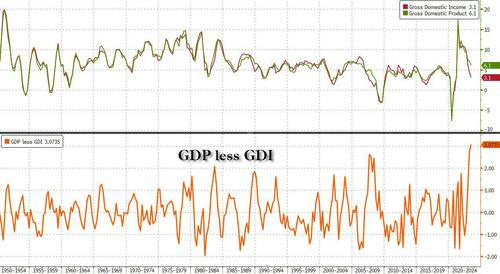
ZH: What's Behind The Record Divergence Between GDP and GDI, And Why Tomorrow The US Economy Will Be Revised Sharply Lower
Tomorrow morning years of politically-motivated upward drift in US economic "data" will get their come to Jesus moment of gravitational reacquaintance: at 8:30am ET on Thursday, alongside the final Q2 GDP print (expected unchanged at 2.2%) the BEA will also publish its once-every-five-years revision of GDP from Q1 2005 to Q1 2023, which according to Morgan Stanley will lead to a sharp downward revision, of as much as 80bps from Q2 GDP, and could potentially even indicate economic contraction in the first half of 2023.
There are several reasons why GDP may be revised right off the proverbial cliff, but chief among them is the previously discussed record divergence between GDP and GDI, two series which - in theory - should be identical.
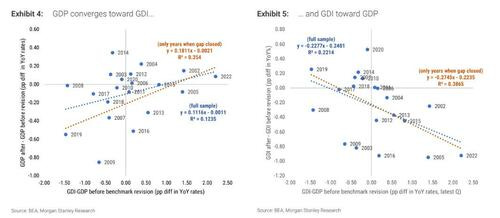
Besides GDP, Gross domestic income (GDI) and select income components will also be revised from Q1 1979 through Q1 2023, but as Morgan Stanley explained previously, the likely drift in revisions will be toward a lower GDP and higher GDI. This is how the bank's chief US economist Ellen Zentner explained it previously:
GDP will likely be revised down toward GDI. Not only does the GDI/GDP gap tend to close in absolute terms, but we also find evidence that GDP usually converges toward GDI in YoY% rates. Exhibit 4 shows the relationship between the percentage point difference between GDI and GDP before the revision (latest quarter available before revision, YoY%) and the change in GDP growth rate after the revision (pp difference after vs before). There is a positive link between the two variables suggesting that a negative GDI/GDP difference like the one we have now might result in a downward revision to GDP. In Exhibit 4 we show two linear fits, one using the 20-year sample and the other only focusing on the revisions where the GDI/GDP gap closed, with a stronger link between the variables. Using the predictions from these simple models, we would expect to see a downward revision to 2Q 23 YoY% GDP of as much as -50bp to -80bp
And while we discussed all this and more previously, a key question some may ask is what is the reason behind the massive divergence between GDP and GDI?
For the answer we go to a recent note from JPM chief economist Michael Feroli who correctly notes that one dark cloud hanging over the US economic outlook all year has been the very weak performance of real gross domestic income (GDI), which has contracted 0.5% over the past four quarters.
As noted before, GDI should equate with GDP, and past research has indicated that averaging GDI with GDP (also called GDO, or gross domestic output) provides a better measure of the underlying growth of economic activity than either measure viewed in isolation. Obviously, incorporating GDI clearly sends a more downbeat message about the economy’s recent performance, and suggests that the surge in the US Dollar and 10Y yields are just huge headfakes, and once the revised data is released we could see a brutal mean reversion in both the greenback and US Treasuries…
… Finally, Deutsche Bank's Jim Reid agrees, and in a recent note he writes that while tomorrow's revisions could make GDI look more healthy (interest payments add income to parts of the economy) they could "also make interest costs in the economy look more realistic and hurt fundamental models of interest cover for those indebted." As such, "the revisions are potentially an important event and could make us think differently about the US economy in the recent past and therefore the future" especially if it is revealed that due to faulty data, the Fed kept hiking in the first half of 2023 even though true GDP was flat if not outright negative.
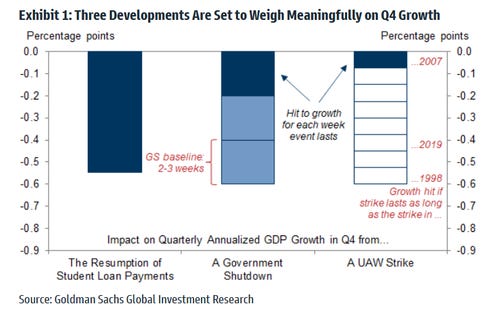
And if the sharp historical revision to GDP wasn't enough, the coming plunge in Q4 GDP on the back of...
The resumption of student loan payments, which will subtract (at least) 0.5% (and likely much more) from quarterly annualized GDP growth
The government shutdown which will reduce quarterly annualized growth by 0.2% for each week it lasts
The ongoing UAW auto strike which reduces quarterly annualized growth by 0.05-0.10% for each week it lasts.
...which will almost certainly push the economy into contraction, should be sufficient to put a sharp stop to any further surge in either the dollar or US interest rates.
Finally with all this ‘heady research’ and ‘analysis still sinking in, I wanted to offer a distraction … a glimpse into my lunch ‘date’ conversations just the other day,
Now isn't he a handsome fella, and a good boy too!
Is today the calm before the last trading day of Q3? Gold getting hammered, yields-dollar up strongly indicates a dollar shortage out there somewhere (China?). I heard a podcaster say that the potential Gov shutdown causes or creates a dollar shortage. I don't understand the WHY though, does the Treasury stop issuing bills/notes during a gov shutdown? OUTSTANDING work big guy many thanks!


Wow...a quite a newsletter....Amazing work !!!
I heard the US Treasury is auctioning 330B in T-Bill per week and
that going to 370B, by Y/E........Holy Crow !!!! It's CRAZY !!!
The US Gov't has got Debt and Interest coming out their.............
Those GDP/GDI revisions will be interesting...
I don't think the Econ Numbers will help the Bond Bulls.......more pain to come for them.
Rates haven't peaked..........need a Recession, to stop this Train
Great Work !!!!!
Now isn't he a handsome fella, and a good boy too!
Is today the calm before the last trading day of Q3? Gold getting hammered, yields-dollar up strongly indicates a dollar shortage out there somewhere (China?). I heard a podcaster say that the potential Gov shutdown causes or creates a dollar shortage. I don't understand the WHY though, does the Treasury stop issuing bills/notes during a gov shutdown? OUTSTANDING work big guy many thanks!