(USTs 'modestly higher' on above avg volumes) while WE slept; UAW strike = higher 'flation; 10yy simply back to 'avg'; what to make of (CPB)World Trade (fade); BUY Yom Kippur?
Good morning … what did I miss? Allow me to lean on one of Global Wall Streets popular kids to answer,
… the biggest story yesterday was the dramatic rise in sovereign bond yields, which left them at multi-year highs on both sides of the Atlantic. For example, the 10yr US Treasury yield ended the day up +10.0bps at a post-2007 high of 4.53%, and overnight they’re up a further +1.6bps to 4.55%. Meanwhile, the 30yr yield rose +12.8bps to a post-2011 high of 4.65%, and is up +1.6bps overnight to 4.67%. Watch out for the latest 30yr mortgage rates! The recent rise in yields is partly because investors are pricing in that policy rates will remain higher for longer, particularly after the Fed’s dot plot last week. But it’s also been driven by the growing realisation that supply is set to remain elevated given mounting budget deficits, along with a small uptick in longer-term inflation expectations. Indeed, although real rates led the moves in longer-dated yields (10yr +11.7bps to 2.17%), the 30yr inflation breakeven was still up +1.0bps yesterday to 2.39%, which is its highest level in over 6 months. My CoTDs over the last two days have shown that 10yr USTs are now at their 230 plus year average again and that c.86% of time over that period, 10yr rolling inflation has averaged below 4.5%.
Here are 10yy on a very short (DAILY) and longer term (monthly LOG) scaled basis where I’d note on DAILY basis, momentum remains overSOLD BUT … perhaps signaling a bit of a reprieve …
AND in longer-term context,
And finally, from Global Wall Street, perhaps we’re spilling lots of ink and all for naught as rates are simply back up to ‘normal’
DB CoTD: Just an average day for US Treasuries (this was written / offered BEFORE weekend on 22 Sep)
Overnight a major milestone was reached. 10yr US government yields hit their longterm average yield (since 1790) of 4.5% for the first time since 2007…
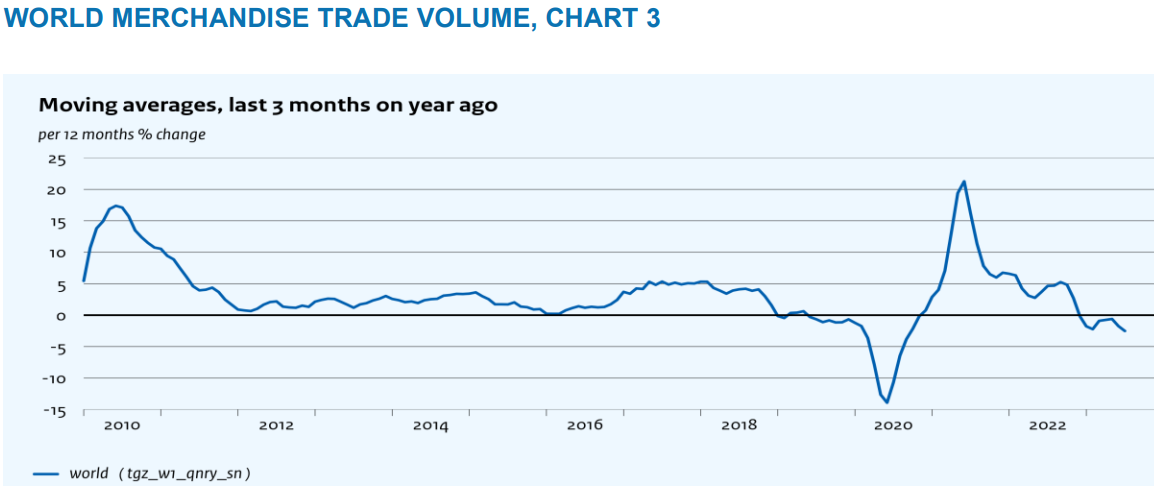
Now as rates are going UP — back UP towards average or beyond as it may be — it would appear that topical CPB World Trade is continuing to trend in the opposite direction,
Developments in global international trade and industrial production July 2023:
• World trade volume decreased 0.6% month-on-month (growth was -0.6% in June, initial estimate -0.7%). • World trade momentum was -0.4% (non-annualised; -0.3% in June, unchanged from initial estimate). • World industrial production decreased 0.1% month-on-month (having increased 0.2% in June, initial estimate 0.4%). • World industrial production momentum was 0.1% (non-annualised; -0.5% in June, unchanged from initial estimate).
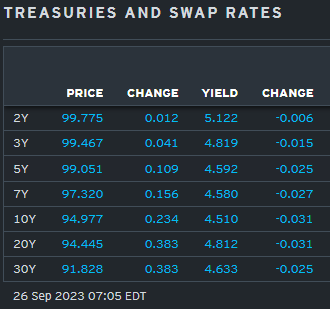
For somewhat more, watch the video noted HERE and in the meanwhile, don’t forget to get those bids in for 2yy early and often AND … here is a snapshot OF USTs as of 705a:
… HEREis what this shop says be behind the price action overnight…
… WHILE YOU SLEPT Treasuries are modestly higher and the curve a touch flatter after Treasury 10-year yields probed channel support (see last attachment) overnight, rejecting it so far. DXY is little changed (-0.05%) while front WTI futures are lower (-0.8%). Asian stocks fell (NKY -1.1%, SHCOMP -0.4%), EU and UK share markets are mostly lower (SX5E -0.9% but FTSE 100 UNCHD) while ES futures are showing -0.45% here at 6:45am. Our overnight US rates flows saw tepid flows despite new move highs in yields with fast$ selling seen in intermediates. Overnight Treasury volume was decent at ~135% of average overall.
… Our first attachment this morning takes a long-term look at Treasury 2-year yields via the monthly chart. Oversold across all momentum timeframes we typically care about, Treasury 2yr yields have so far respected support derived by their 2007 high yield print (5.128%) and the highest monthly closing/opening levels seen in 2006. We suspect that a longer-run(?) battle will be waged at this support area...
#Got2s? #SUPPORT #BTFD (? anyone ? Bueller…) … for some MORE of the news you can use » The Morning Hark - 26 Sept 2023 with an excellent effort to to help weed thru the noise (some of which can be found over here at Finviz).
From some of the news to some of THE VIEWS you might be able to use… here’s SOME of what Global Wall St is sayin’ … (reminder — HERE are some UPDATED WEEKLY NARRATIVESand HEREare some ‘rainy day / random thoughts’ with what I believe to be MUST SEE TV in form of an interview from Danielle DiMartino Booth with Lacy Hunt) …
The ongoing UAW strike across the "Big Three" US auto producers could pare-down the already low level of auto inventories, posing upside risks to auto prices in Q4, when we had assumed modest deflation. The estimated boost to core CPI y/y is 0-0.5pp in December 2023, depending on the scope and duration of the strike.
Bespoke- Buy Yom Kippur? (hadn’t heard this one before …)
When it comes to seasonal patterns in the market, one less widely known pattern is related to the Jewish calendar regarding Rosh Hashanah (the Jewish New Year) and Yom Kippur (Judaism’s holiest day of the year). The old saying says to sell Rosh Hashanah and buy Yom Kippur as, often, it tends to be a weak time of year for the market. We’ll leave it to others to try and explain the reasons behind the axiom, but the actual results don’t refute the pattern.
The table below shows the performance of the S&P 500 from the close before the start of Rosh Hashanah to the closing price on the day Yom Kippur ends from 2000 through 2022. During that span, the S&P 500’s median performance during this period has been a decline of 0.50% (average: -0.79%) with positive returns less than half of the time (43%).
While equity market returns have been weak during the period between these high holy days of the Jewish calendar, market returns for the rest of the year have been positive. In the twenty-two prior years shown, the S&P 500’s median rest-of-year performance has been a gain of 6.07% with gains 74% of the time. In the table, we have also shaded those years where the S&P 500 bucked the market headwinds and posted positive returns during this period, but it tended to have no impact on performance for the remainder of the year
One word of caution behind the possible explanations for the equity market’s weakness in the period between Rosh Hashanah and Yom Kippur is that they also occur during September which is already a weak time of year for the market to begin with.
BNP - Quant Trades of the Week: Buying the dip in bonds, but not yet in equities or FX (the idea sounds good / interesting but the execution is WAY above my current — and former, to be completely honest — capabilities and understanding … idea, though, is BUY THE DIP and that message comes thru loud and clear)
KEY MESSAGES Market themes:
Investor sentiment has moved from risk seeking to neutral, according to our global risk premium index.
There is scope for further risk-off before it’s attractive to re-add risk, particularly as end-September tends to have negative seasonality.
We favour positioning long duration in nominal rates as US yields appearing elevated.
We maintain defensive exposures of short NZDUSD and receive PLN 10y vs USD
… US real yields appearing elevated: The rise of US real yields has been key to the retracement of risk assets last week. MarFA™ indicates that the rise of US 5y5y since last week’s Fed meeting appears too abrupt amid its uptrend. This suggests that we may see a pull-back over the week ahead. We favour positioning long duration in nominal rates – receiving 30y USD swap – where the dislocation is larger.
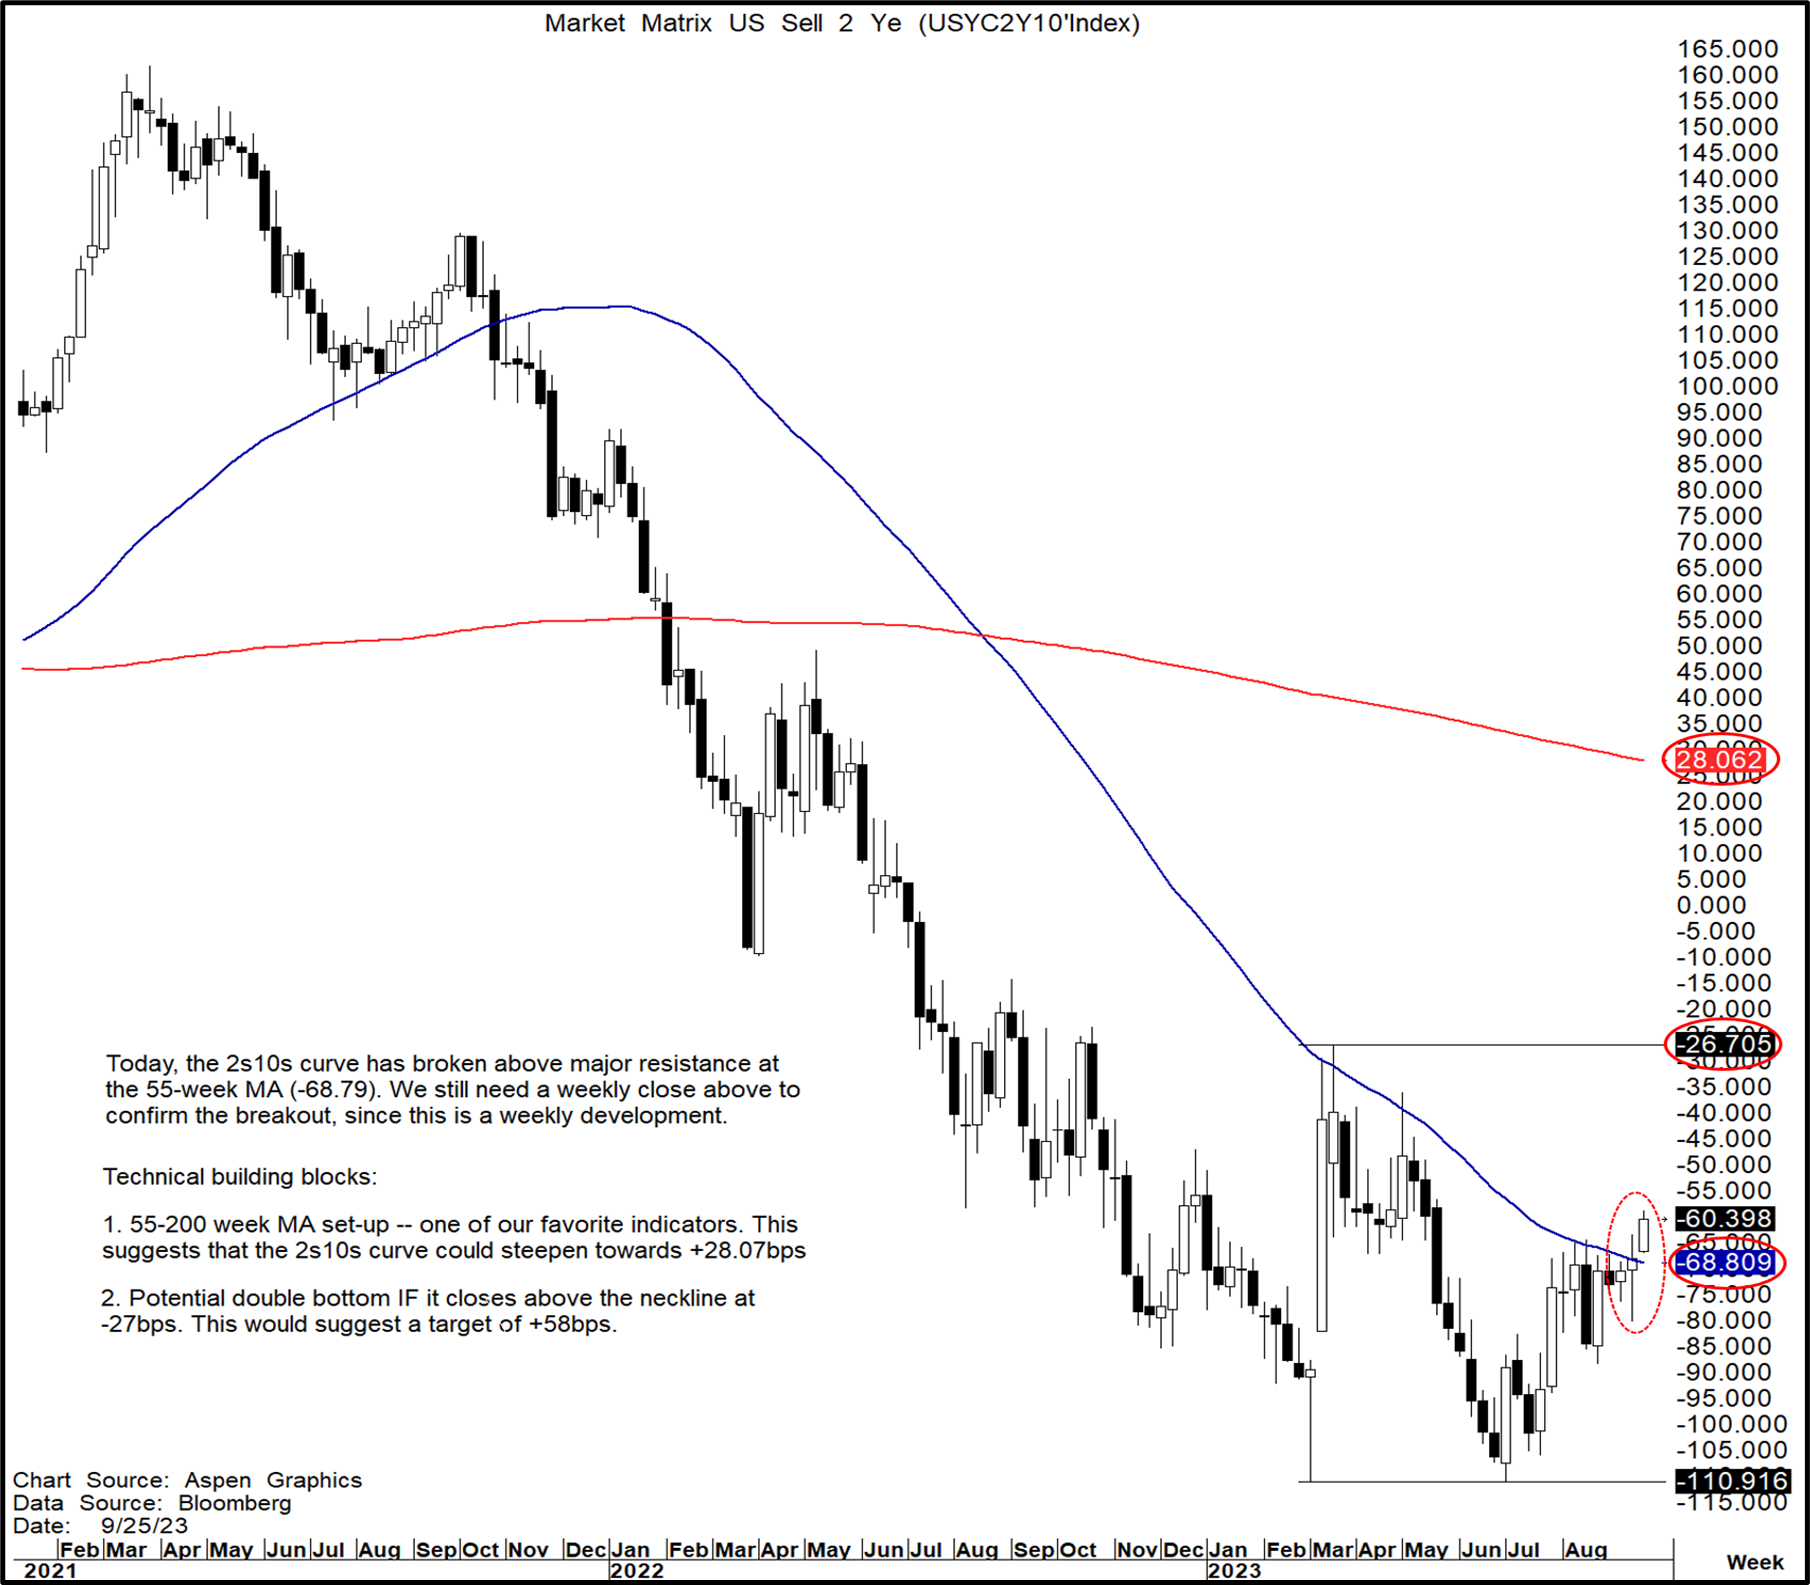
Perhaps, one of the most important charts out there right now.
2s10s Curve: Today, the 2s10s curve has broken above major resistance at the 55-week MA (-68.79 bps). We still need a weekly close above to confirm the breakout, since this is a weekly development.
Nevertheless, IF seen, it unequivocally suggests further steepening.
Moreover, given that the 2s10s curve spent the past 8 consecutive weeks trying to break above the 55-week MA, it suggests this steepening will occur swiftly.
The major building blocks are:
1) A close above the 55-week MA paves the way for a 55-200 week MA set-up. This suggests that the 2s10s curve could steepen towards +28.07bps.
2) If that's the case, then that would obviously take us above the very clear double bottom neckline at -26.71bps. The double bottom suggests a target of +58bps.
10yr real rates
This may be the main culprit for the equity sell-off in September and the continued strength in the USD.
Last week, 10yr real rates broke decisively above 2% after attempting to get above it since mid-August. This is the first time it has cracked above 2% since 2008.
Currently, it is trading very near the 76.4% Fibonacci retracement (2.12%).
This is a very important level because IF it makes a weekly close above it, there really is not much significant resistance to the upside. Therefore, it would suggest that 10yr real rates can go much higher.
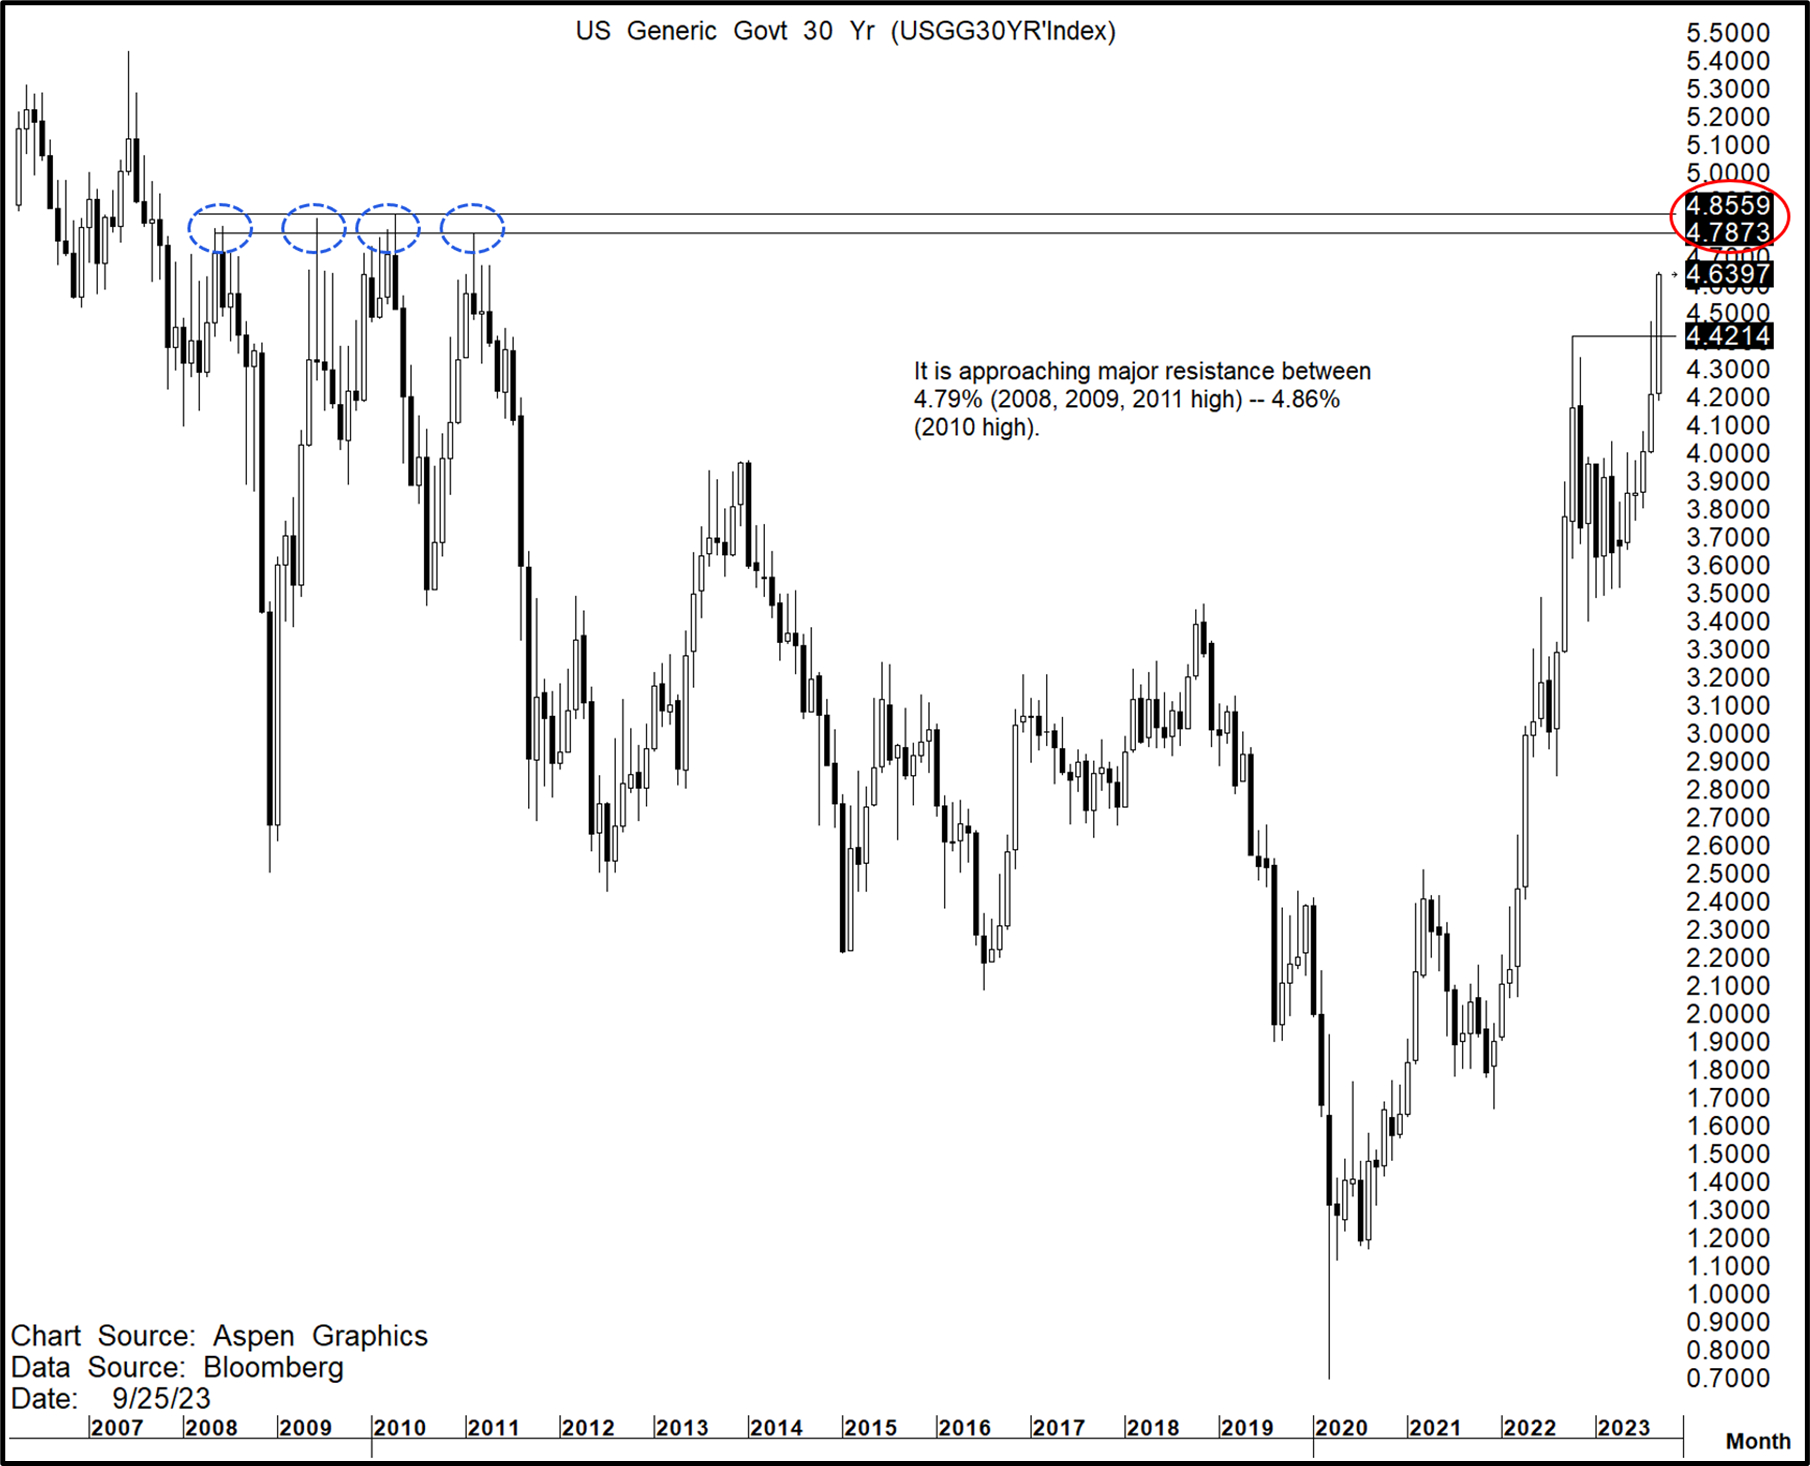
… 30yr Yields
It has clearly broken above to make new cycle highs.
It is approaching major resistance between 4.79% (2008, 2009, 2011 high) -- 4.86% (2010 high).
… Of course, the biggest story yesterday was the dramatic rise in sovereign bond yields, which left them at multi-year highs on both sides of the Atlantic. For example, the 10yr US Treasury yield ended the day up +10.0bps at a post-2007 high of 4.53%, and overnight they’re up a further +1.6bps to 4.55%. Meanwhile, the 30yr yield rose +12.8bps to a post-2011 high of 4.65%, and is up +1.6bps overnight to 4.67%. Watch out for the latest 30yr mortgage rates! The recent rise in yields is partly because investors are pricing in that policy rates will remain higher for longer, particularly after the Fed’s dot plot last week. But it’s also been driven by the growing realisation that supply is set to remain elevated given mounting budget deficits, along with a small uptick in longer-term inflation expectations. Indeed, although real rates led the moves in longer-dated yields (10yr +11.7bps to 2.17%), the 30yr inflation breakeven was still up +1.0bps yesterday to 2.39%, which is its highest level in over 6 months. My CoTDs over the last two days have shown that 10yr USTs are now at their 230 plus year average again and that c.86% of time over that period, 10yr rolling inflation has averaged below 4.5%. So after a decade plus of having little value in historical terms, it is finally a competitive asset class again against others such as equities, which raises the question about what return equity investors should demand going forward. See the two here and here…
DB - Reconnecting the dots (I like art and specifically those pictures from our youth when we’d connect the dots … typically, back THEN, the picture was something nice and easy on the eyes … not 100% sure higher rates here in this case, will be so desirable … perhaps I should start liking more abstract art forms?)
Several months ago, we argued that although the median SEP longer-run dot had remained steady at 2.5%, there were early signs in the SEP that views on r-star were rising (see “Connecting the dots”).
The September FOMC meeting provided further evidence of this. Chair Powell was more open to discussing the possibility of a higher neutral rate than he has been in recent communications. And while the median longer-run dot was unchanged, individual dots continued to migrate higher and SEP projections continue to imply a short-run neutral real rate above 2% next year.
Changing year-ahead r-star values from the SEP have led revisions to the median longer-run dot in the past. Alongside the fragility of the current median, this suggests considerable scope for it to move higher over coming quarters if the economy does not dip into a recession.
… As a reminder, changing year-ahead r-star values from the SEP have led revisions to the median longer-run dot in the past (Figure 3). Taken together with the relative fragility of the longer-run dot – it would only take 2-3 dots moving up from the median to shift it higher – we see considerable scope for the median dot to move higher over coming quarters if the economy does not dip into a recession.
We have plenty of data reports to go, but, so far, the third quarter is shaping up to be a strong one for the US economy. The Atlanta Fed’s GDP Now model is tracking a Real GDP growth rate of 4.9% for Q3, which would be the fastest quarterly growth rate since the earlier part of the COVID recovery.
Our models aren’t tracking quite so high but are projecting growth at about a 4.0% rate, still strong by the standards of the past couple of decades.
However, we would not get too excited about what’s happening in the third quarter and don’t think one quarter of strong economic growth means a recession is off the table…
… To be clear, we do not believe government spending is a positive for long-term growth. In fact, it often distorts and diminishes overall activity. However, in the short-term, as we saw during COVID (and apparently this year as well) it can make the economy look stronger than it really is. A price will be paid, and as all this extra stimulus wears off a recession is highly likely. We don’t see how it is avoided.
The next recession is unlikely to be as devasting as the ones in 2008-09 or 2020. But our view remains that a recession is on the way.
Last week saw weaker price action across cyclical areas, particularly in the Consumer Discretionary, Housing and Semiconductor sectors. Meanwhile, defensive leadership has resumed. We recommend a barbell of defensive growth stocks with Industrials & Energy.
… Higher for Longer?...The real rate/equity return correlation fell further into negative territory in the wake of last week's FOMC meeting, signaling that rate moves are an increasingly important determinant of equity performance from a directional standpoint. That said, one could argue that the post-FOMC equity market response was outsized for the rate move that materialized based on a performance regression over the last several months. One potential explanation for this dynamic is that the equity market is beginning to question a "higher for longer" backdrop in the context of a macro environment that looks more late cycle than mid cycle.
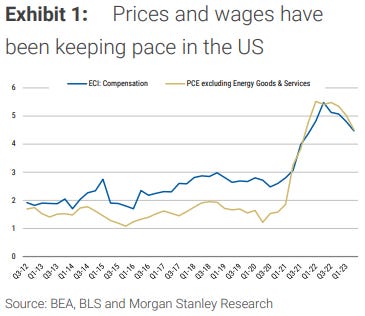
MS - The Weekly Worldview: Revisiting Wages and Prices (I get the sense this one is a note emphasizing how / why the ‘good news’ — for the Fed — is the very same ‘bad news’ for you and I … and frankly, NO idea how Mr. Markets will view it but perhaps ‘good’ <vague on purpose — YOU pick which market it will be ‘good’ for — just sayin’)
Wages are being closely watched by policymakers around the world. We examine what this means for the effects on prices.
The ongoing UAW strike has brought renewed attention to the wage bargaining process, and ultimately wage increases, in the United States (see our US team’s evaluation of the strike). Since inflation took off, markets have discussed the interplay between wages and prices, at times fearing a “wage-price spiral” that would leave inflation permanently higher. We revisit analysis of the relationship between prices and wages. In particular, could higher wages constitute a cost-push shock to firms, thereby leading to delayed increases in inflation?
A recent study from the IMF provides some historical perspective, using a cross-country database of 38 advanced economies over 60 years through 2021. The research finds scant evidence of wage-price spirals. In practice, after periods of accelerating consumer prices and nominal wages, the interaction between the two stabilizes to a point whereby real wage growth is roughly unchanged, on net.
Focusing specifically on the US, we have turned to the data to estimate the two-way relationship between the variables. Wages and prices are highly correlated, but it is worth checking which direction the causality runs. The results show that the wage-inflation link is weakening. Between the 1970s and the 1990s, wages (measured by the Employment Conditions Index) had an economically meaningful effect on PCE inflation. A 100bp increase in wages was found to increase the core PCE level by 75bp after one year. But from the 1990s on, the push from wages to prices has weakened. Analyzing data through 2019, the effect of a 100bp increase in wages falls to only about a 10bp increase in consumer price inflation in the first year, and the effect is negligible thereafter. Intuitively, the effect of wages on services price inflation is bigger than for goods price inflation. When we examine the goods and services prices separately, the goods pass through is close to zero, while the services pass through is approximately 23bp a year after the wage rise.
PIMCO - Fed Seems Confident in Soft Landing, But We See Risks. The Federal Reserve forecasts only a modest uptick in U.S. unemployment next year as inflation cools, but history and current labor market trends make us less certain.
… A soft landing for the U.S. economy is certainly possible, but in our view, recession risks are still elevated. Supply chain improvements after the pandemic should continue to moderate inflation, but tight labor markets and sticky wages could very well apply inflationary pressure absent a productivity boom. Other near-term trends, including the resumption of student loan payments, higher gas prices, and California income taxes coming due, could diminish the strength of the otherwise resilient U.S. consumer.
A prolonged period of tight policy has historically very rarely (if ever) ended in anything other than rising unemployment and economic contraction. Although history doesn’t always repeat, it often rhymes.
UBS - Trading away (reminds ME of one topic discussed HERE by Danielle and Lacy)
The World Trade Monitor reported an accelerated drop in July trade volumes (implying a faster drop in trade share of the world economy). Spending on fun is a service sector thing (though there may be some new clothes bought along the way). Some of this is down to the fact that the 2021 surge in goods demand has cannibalized future demand. Some of this may be a structural break in consumption patterns favoring services.
Pausing for a moment or two and letting all that highly sought after research (?) settle in and now turning TO the WWW for a couple / few other items of interest,
Hedgopia- Sell-Side Revises Small-Cap Earnings Estimates Higher For Both This Year And Next, Russell 2000 Does Not Care And Breaks Down
… Last week, the FOMC left the rates unchanged at 525 basis points to 550 basis points – raised from zero to 25 basis points in March last year. The dot plot showed that members expect one more 25-basis-point hike in the remaining two meetings this year. Futures traders, on the other hand, are betting that the fed funds rate peaked with the July hike.
In fact, until just a few weeks ago, these traders were expecting the fed funds rate to end 2024 south of four percent. They have adjusted their expectations higher in response to stronger-than-expected economic data and a hawkish message from a dogged Fed, which is laser-focused on downward-trending but still-elevated inflation. Futures traders, on the other hand, are betting that the full effect of the tightening since March 2022 is probably yet to be felt and that there is economic deceleration ahead – more than currently priced in.
Non-commercials who are neck-deep in net shorts in 10-year note futures are not in the same boat. As of last Tuesday, they cut their holdings 5.6 percent week-over-week, to a four-week low. From the record set in the week to May 30th, net shorts are now down 17.4 percent – from 850,421 contracts to 702,316 (Chart 6).
The latest reduction in non-commercials’ shorts came ahead of last Thursday’s breakout in the 10-year treasury yield, rallying past resistance at mid-2.30s, ending the week at 4.44 percent. This week’s CoT numbers hence will be revealing.
Non-commercials cannot be blamed for locking in profit, as they are sitting on tons of it. But, ideally, last week’s breakout in the 10-year yield should encourage them to add to their holdings, as they have just been vindicated. Else, if it turns out the reduction in recent weeks in their holdings is the beginning of a trend, then they will have concurred with fed funds futures traders and small-cap bears. In time, it will just be a matter of time before large-caps will join them.


A Masterpiece !!!!!
Outstanding Charts and Commentary !!!!!
I take some comfort in the Trend Line at 5.35% on the 10y....and the 4.79 -4.86 % Resistance levels.
We need some good Inflation news to move those Expectations, down and move the Real IRs, down.
Some day, that will happen......I just don't know when..
I learn more and more with every BondBeat edition.
Thank you....
In Memorial...
https://www.newsmax.com/thewire/man-from-u-n-c-l-e-david-mccallum-illya-kuryakin/2023/09/26/id/1135955/
I was a fan, as a child.....were you ???