Good morning / afternoon / evening - please choose whichever one which best describes when ever it may be that YOU are stumbling across this weekends note…
A rough week for all intents and purposes and now as we collectively kick back and enjoy a couple days off, well, the weather is somewhat less cooperative for those of us here in the NY metro area … Perhaps perfect conditions to sit back, watch 17 football games at once and pull up a PDF of sellside views which will seal the deal and most certainly put you right to sleep!
Before heading there, have a look at 5yy WEEKLY which are going to be up for sale in the week ahead …
… It would appear to ME that we’re at an interesting level (~4.50%) and with so many inputs (price of ‘Earl, striking workers, government shut down looming, breaks driving nominals, and please feel free to consider any / all other ‘bricks in the wall of worry’ you might desire) and let me know what YOU think this weeks auction results might look like. What messages from markets should be sent TO policy makers (and if they care to be listening).
… Ok I’ll move on AND right TO the reason many / most are here … some UPDATED WEEKLY NARRATIVES where I’d note a couple / few things which stood out to ME this weekend …
US 10y yield reaching target, now what? … So there are multiple upside risks. While we lack evidence today to say the move higher is complete, we can say it is getting stretched with daily, weekly and monthly RSI’s all at about 70. For now we stick with momentum, the uptrend channel drawn below and favor selling a corrective rally until peak yield signals and patterns form
Barclays rates weekly, “Feeling lucky” (out of 2yy short, booking profits, well done) BMOs rates weekly, “Forecasts are highly uncertain” (what IS certain is they were stopped OUT OF LONG 10s, waiting for another chance to reload)
… The impressive selloff over the past week stopped us out of our long in 10s and the downtrade reached 4.50% before a bid emerged on Friday to bring rates off the extremes. Particularly with real yields this high, our longer running bullishness on Treasuries is intact, although with a sparse offering of fundamentals in the coming week, we'll advocate waiting for more attractive entry points…
HSBC note on, “FOMC, US Treasuries & Credit reaction” (a bearish rates update and so, from this source, particularly worth noting)
… At a time when the Fed remains hawkish with the support of recent GDP data, there is pressure for short-dated bond yields to remain elevated, and this affects the whole curve. We raise our year-end 2023 UST 10Y yield forecast from 3.0% to 3.5% to reflect the Fed’s actions. The 10Y forecast for end-2024 is now 3.0%…
MS— staying LONG 5s, 30y TIPS and… Wells Fargo weekly has an interesting page, (you don’t say …)
… Oil Prices Complicate the Fed's Efforts to Reduce Inflation
Today marks the 265th day of the year, meaning there are just 100 days left in what still seems like a new year. Heading into the home stretch, the market certainly looks tired as stocks have erased much of the gains they posted in the late spring/early summer rally. If history is any use, though, equity performance in the final 100 days of the year tends to be positive. In the top chart below, we show the S&P 500's performance during the last 100 days of the year dating back to 1945, and for each year where the market was up over 10% heading into the last 100 days, we colored the bars dark blue. The overwhelming majority of the time, the S&P 500 traded higher during the last 100-day homestretch, but there were some big exceptions, notably 1987 (-22.7%), 2008 (-25.2%), and 2018 (-14.4%). In 1987 the S&P 500 was up 31% heading into the last 100 days, in 2008 it was down 18% heading into the last 100 days, and in 2018, it was up 9% before the plunge. In other words, a large plunge could come at any time.
Even taking the large plunges described above into account, the S&P 500's median gain in the last 100 days of the year has been a gain of 4.1% with positive returns 78% of the time, and for years when the S&P 500 was already up 10%, the rest-of-year returns are nearly identical. So as we get ready to wrap up 2023, the wind is at the market's back, although just because the winds are favorable doesn't mean the boat still can't spring a leak. Fair Winds and Following Seas!
Bloomberg (via ZH) - Quantitative Tightening Is Not Biggest Threat To Global Yields
Authored by Simon White, Bloomberg macro strategist,
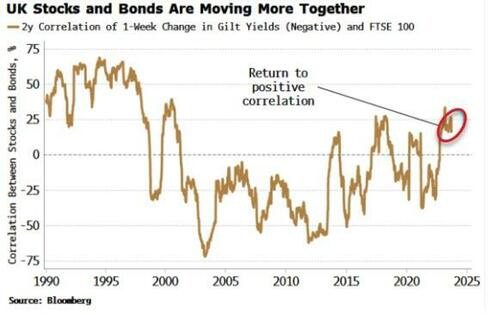
The Bank of England’s quantitative tightening program shows that unwinding central-bank bond portfolios, even with outright sales, need not be disruptive for markets. The greater risk for US and global yields comes from positive stock-bond correlations driving risk premia wider.
The BOE has been a pioneer and a thought leader in QT. While the Fed and ECB have only allowed bonds to run off naturally to help achieve their balance-sheet contraction goals, the BOE has sold gilts outright in addition to allowing bonds to mature.
So far, it has not led to any significant market disruption. This enabled the BOE Thursday to increase the pace of reduction in the Asset Purchase Facility (APF) from £80 billion last year to £100 billion over the coming 12 months from October (while holding Bank Rate steady). As colleague Ven Ram also noted, the schedule of maturing bonds next year allowed the bank to keep gilts sales unchanged from last year while increasing the total amount of the APF’s decrease.
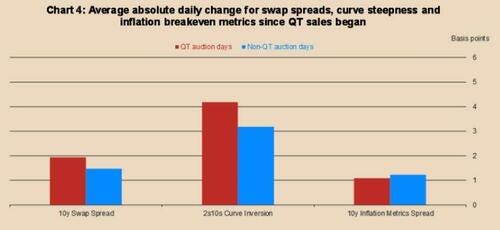
The QT watchwords from the bank are “gradual and predictable.” If gilt sales are conducted in such a way, then market disruption should be minimized. The chart below shows the BOE’s own assessment of the impact of bond sales on the market.
The BOE estimates that of the ~40 bps of term-premium increase since the MPC voted to begin QT in February 2022, about 10-15 bps comes from QT specifically – small in comparison to the overall rise in yields since that time.
QT or bond sales, though, are not the most critical risk facing bond prices in the current cycle. Rising and now positive stock-bond correlations threaten to lead to a structural rise in bond risk premium, and lower prices. The correlation is now positive in the US, Japan, and the UK
.
In a positive stock-bond correlation world, bonds lose their portfolio-hedge and recession-hedge capabilities, and thus become less sought after. The penny has not fully dropped yet, but the negative term premium for bonds is increasing, and is prone to rising much higher as they become less desirable.
Yields of developed market countries are biased structurally higher, but QT is unlikely to be the culprit. Instead, it allows central banks to reload their capacity for a future time when they may need to restart quantitative easing, in order to stabilize the market from sharply rising term premia.
Kimble-$40 Billion In Wrong Bond Fund Past 2 Years, Says Joe Friday
When treasury bond yields are rising, bond prices are falling. It’s an inverse relationship.
And so it makes sense that the 20+ Year Treasury Bond ETF (TLT) has fallen sharply during the Federal Reserve’s rate hike cycle…
During the current rate hike cycle, the 10-Year treasury bond yield has risen to over 4.4%! And this has put pressure on treasury bond prices.
As you can see, TBF (with only $198 million in assets) is up +51% over the past 2 years. In contrast, the much larger TLT (with $40 billion in assets) is down -39%.
Two Takeaways:
It would have paid to watch the trends and simply stay out of TLT over the past several months.
It also looks like the majority of the world (and $40 billion!) has been in the wrong bond fund the past 2-years!
Stocks are struggling this month against a backdrop of higher interest rates and monetary policy uncertainty. Benchmark 10-year yields have surged around 40-basis points, surpassing resistance off the October 2022 highs. The recent breakout raises the question of how high yields will go—an important question that could continue to weigh on risk sentiment.
The S&P 500 is down nearly 4% on the month, and technical damage is beginning to mount. The index has broken to the downside of a symmetrical triangle formation after taking out support at the 20- and 50-day moving averages (dma). Additional downside support below 4,330 comes into play in the 4,200 to 4,300 range, followed by the 200-dma at 4,189.
The recent selling pressure has turned most momentum indicators bearish. Breadth is deteriorating as only 45% of S&P 500 stocks remain above their 200-dma. The two-year cumulative advance-decline (A/D) line for the S&P 500 has also pulled back to an inflection point after violating an uptrend.
Despite the recent pullback in stocks, there have been no major signs of a sustainable flight to safety. The uptrend on the equal weight consumer discretionary vs. consumer staples ratio chart remains intact.
Overall, the market is down but not out. Pullbacks are entirely ordinary within the context of a bull market, and while the jump in rates is concerning, the S&P 500 remains in an uptrend and above its rising 200-dma.
… Technical Damage The S&P 500 is down nearly 4% on the month, and technical damage is beginning to mount. The index has broken to the downside of a symmetrical triangle formation after taking out support at the 20- and 50-dmas. Yesterday’s session-low close at 4,330 landed right at support from the June 2023 lows and August 2022 highs. Additional downside support comes into play at the 4,200 to 4,300 range—a likely spot for a rebound—followed by the 200-dma at 4,189 (also near a key Fibonacci retracement level).
The recent selling pressure has turned most momentum indicators bearish. The Moving Average Convergence/Divergence (MACD) indicator—a trend-following momentum indicator that shows the relationship between two exponential moving averages—recently rolled over into a sell position. Given that the S&P 500’s uptrend is still intact, and price remains above its rising 200-dma, we view the sell signal as a shorter-term signal pointing more toward a pullback than a market top.
ZeroHEDGE- Global Stagflation? US, EU PMIs Signal Slowing Growth, Rising Prices
ZeroHEDGE- With Most Central Banks Ending Their Tightening Cycle, The BOJ Remains Too Terrified To Even Start
… AND for any / all (still)interested in trying to plan your trades and trade your plans in / around FUNduhMENTALs, here are a couple economic calendars and LINKS I used when I was closer to and IN ‘the game’.
First, this from the best in the strategy biz is a LINKthru TO this calendar,
Before hitting SEND — note there will likely be NO OUTPUT Monday due to the holidays … as always, if you should require or like to request a refund, ‘have your girl call my girl’ (sorry, not sorry :) ) and we’ll get it all sorted out. You have my word.
As I’m hitting send, here’s a live look at the Jersey Shore,
HOPE weather better wherever YOU may be and wishing one / all a great weekend ahead … THAT is all for now. Enjoy whatever is left of YOUR weekend …


I have to disagree with 3.5% 10 year at 2023 YE
I believe it will be above 4%, in a range of 4.30 - 4.75 %
I don't see the US economy falling off a cliff.....
Great Read !!!!
Interesting to see how firms are Bullish on Bonds.............