Good morning / afternoon / evening (please choose which ever one which best describes when ever you are stumbling across this shorter than short note).
And welcome to all who’ve recently stumbled upon this spot on the intertubes thanks TO folks at Harkster.com and their WEEKLY HARK — HERE.
I’m grateful for the mention and humbled by it at the same time … I appreciate the opportunity to get a few things off my chest as I continue to sift through volumes, chapters and verse of various sell side narratives clogging up the buy-side inboxes.
Decision makers and those investing / trading with fiduciary duties have to weed through it all and see which narratives they agree with and those which they don’t. Keeping their ‘friends’ close and ‘enemies’ closer all in effort to ‘beat’ their respective index while the rest of us live in a nominal world.
In an effort to keep myself engaged as part of the community, well, my two cents may NOT be worth whatever they once were,
REUTERS: TREASURIES-U.S. yields fall before non-farm payrolls report
… "I'd say positions are being squared or shorts covered, which is counter to the bearish narrative," said Steve Feiss, managing director, fixed income, at broker-dealer Etico Partners.
"Inflation remains a near-term risk but so far, the word 'transitory' remains a key hope and a single 1 million jobs non-farm payrolls print is only just beginning," he added…
This was a couple years ago (May 6, 2021) when a couple / few allowed me to grace (pollute) online sites such as Reuters … That was then and this is now …
And hey now … how ‘bout that payroll … good news was GOOD (no so much for the Pivot’istas — but truth is folks still placing solid bets on cuts by September — what would YOU make of CMEs FedWatch Tool info HERE?)
Further OUT the yield curve and, well, said another way (in the land of the BIG DV01s), HERE yest on long bonds remaining IN the range but,
… Bearish momentum (stochastics crudely highlighted on bottom panel) are leaning BEARISHLY as we’ve just peaked up ABOVE 50dMA ~ 3.74% and…
Daily charts remain bearish looking as do WEEKLY,
One has to dig real deep (monthly) for a bullish look. OR one could head TO Citigroup’s techAmentalists on this weekends selllside observations (more below).
Now in as far as GOOD news being actually verified — blue check mark and all — good news,
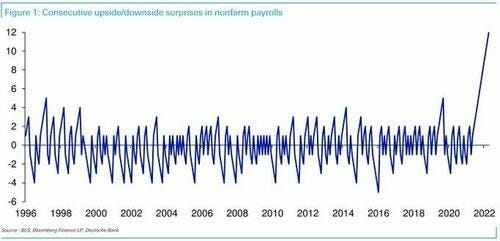
ZH: April Payrolls Smash Expectations After Huge Downward Revisions; Black Unemployment Hits Record Low …
… After all, one look at the chart below which shows the number of consecutive beats heading into today's print, confirms what a farce the "data" has become: everything in the name of a beat and a favorable press conference soundbite.
For MORE on the FARCICAL data,
ZH: Ignore The Noise: Job Market Is Cracking As Birth-Death Model "Adds" Near Record 378,000 Jobs
Despite today's laughable, 13th consecutive beat of expectations in a row, a number which is only as credible as Biden's 81 million voters...
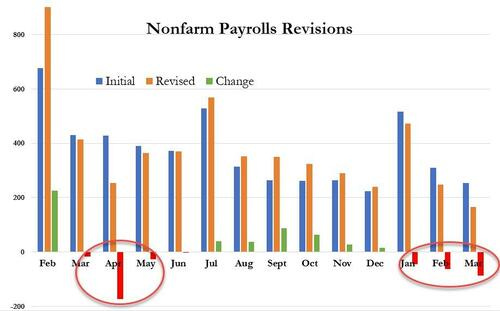
... the weakening in the US jobs market is gathering pace, and as Bloomberg's Simon White writes, a faster-than-expected deterioration in employment would lead the market to in price more cuts, sooner.
As White notes, month-to-month data points and revisions can often obscure the bigger picture. In the case of the labor market, it is that payrolls’ growth is weakening, especially after revisions (what will April be revised to next month).
SO with BLS data being the FARCE (ZH word not mine) it is as per the DB visual, where then are we to turn?
Tchir (via ZH): ADP Jobs Data Are Now Much More Accurate Than Nonfarm Payrolls
BMO: Payrolls Strong in April; UNR back to cycle-low at 3.4% Citi(techOmentalists) with some thoughts on 2yy, “… A weekly close below the 55 week MA, IF seen would suggest we could ultimately fall towards the 200 week MA which presently stands at 1.54% and rising” … they’ve got very interesting read DB on POSITIONS in USTs, “…Treasury net shorts increased to -18% of open interest, now exceeding the October 2018 high; positioning is increasingly weighted toward 2y and lightest in the 30y maturity.” (for MORE on positions, check out HedgopiaHERE) DBalso then asks IF “Problematization of unconcealment: Are minds tougher than facts?” and notes, “…Rate cuts in an environment with high inflation – a scenario embedded in most forecasts – could backfire with a long-end selloff and initial bear steepening of the curve, followed by subsequent bear flattening as the market comes to terms with emergency rate hikes to tame inflation. This is bearish for equities and could lead to substantial flattening, possibly beyond current spot. This mode is not priced in by the market – it goes against the grain of both correlations and forwards.” NWM: We now expect the first cut later this year—sooner than our earlier call for Q1(24) » note visual of how, “US 5s30s Yield Curve STEEPENS AFTER FINAL HIKE” and ALSO kindly note chart of, “Bank Failure Bubble Chart: Arbias on the European Rate team found this, a nice bubble chart on size of FDIC reported bank failures (so doesn’t include investment banks)”
Once you’ve read through all that, here are a few other comments which aren’t ‘paywalled’ but rather widely avail on the intertubes,
First Trust: Nonfarm Payrolls Increased 253,000 in April … But, given our forecast of 0.5% consumer price inflation for April, recent wage growth leaves workers barely treading water relative to prices. And wages are down relative to prices in the past year, up 4.4% versus April 2022 while consumer prices are up 5%+. Yet the Fed won’t see a wage gain of 0.5% as victory against inflation, which means the markets are underestimating the odds of another rate hike in June.
But wait, there’s more … You’ll head TO WolfStreet.com for the NFP recap and perhaps stay for the update on the sorta stuff I now only read about well AFTER the fact, rather than helping traders and portfolio managers live through it,
… On Thursday, May 4, the 28-day Treasury bill auction went haywire.
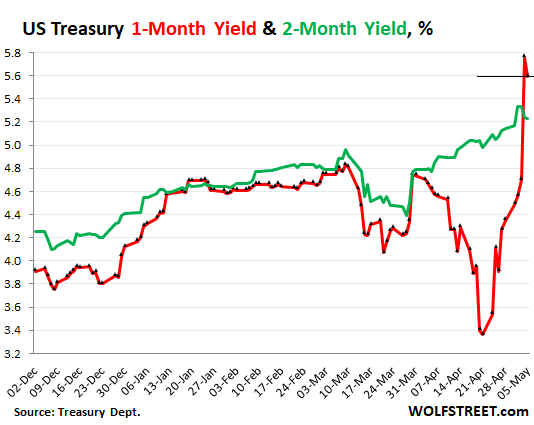
The auction had been scheduled well in advance. For sale would be $50 billion in 28-day Treasury bills. These bills will be issued on May 9 and mature, uhm, on June 6. So let me just show you this chart of the one-month yield (red) and the two-month yield (green), and we’ll dive into the chaos of what happened in a moment. In normal times, those two lines run roughly in parallel.
June 6 is of course “potentially,” as Yellen would say, right smack-dab after the US runs out of money, when the US will be “potentially” unable to pay investors their interest and principal on those bills that were sold at auction on Thursday. And that would be a bummer.
… This huge jump in auction rates didn’t make it into the Tradeweb-based charts on Thursday.
The charts of the one-month Treasury yield, based on Tradeweb data (such as the charts by CNBC, MarketWatch, etc.) did not reflect the spike in yields on Thursday. They show a closing yield on Thursday of 4.56%, and everything appeared normal, even as the auction rates had gone haywire.
But the Treasury Department’s closing yields that it reported on Thursday already showed the huge spike in yield, from 4.70% on Wednesday to 5.76% on Thursday, a 106-basis point blowout.
My Treasury yield charts are always based on the closing data from the Treasury Department, not on Tradeweb data (because I don’t have access to Tradeweb data, which is for the big boys, LOL).
And then on Friday, the Tradeweb-based charts caught up with the Treasury Dept. data and showed the huge spike in yields that my charts had already shown on Thursday.
But on Friday, the official closing yields by the Treasury Department dropped 17 basis point from the spike-close on Thursday, to 5.59%.
Meanwhile, back at the ranch…
With all this intense drama going on around the 28-day bill auction and the one-month yield in the markets, the two-month yield was doing just fine, and closed on Friday at 5.23% (green line). This is the same chart as above (both based on Treasury Dept. data), so you don’t have to scroll back up. It shows the stunning disconnect of the one-month yield from the two-month yield:
Wolfy goes on to NOTE similarities of TBILL troubles happening just before the famed LEHMAN MOMENT … More context, please … TO a BBG newsletter for a chart …
The Weekly Fix: Maybe those 2023 Fed cut bets aren't that crazy
… A good rule of thumb for handling the game of political chicken that inevitably breaks out every few years over the debt ceiling is, ignore it until it starts to show up in the markets. By that logic, it’s time to start talking about it.
Thursday’s Treasury bill auctions provide the latest example. As documented by Bloomberg’s Alex Harris, the Treasury Department sold $50 billion of four-week bills at 5.84% and $45 billion for eight-week bills at 5.4% — the highest yields ever for both benchmarks.
The investor reception was telling. Despite the lofty yields, demand for the four-week sale was remarkably weak, given that the tenor encompasses the so-called ‘X-date’ — Treasury Secretary Janet Yellen warned this week that the government could run out of cash as soon as June 1.
By comparison, appetite for the eight-week auction was off the charts. While the two-month security also falls within the summer concern period, the distance for the X-date saw the sale stop through by a whopping 25 basis points — an indication of hearty demand.
History would suggest that despite the partisan wrangling — President Joe Biden has accused Republicans of holding the economy hostage, while House Speaker Kevin McCarthy has said the GOP won’t pass an extension unless it comes with spending cuts — a deal will be inked at the last hour. But Powell offered some sobering words on the situation at Wednesday’s press conference.
“We’d be in unchartered territory and the consequences on the US economy could be highly uncertain and adverse,” Powell said. “No one should assume that the Fed can protect the economy from the potential short and long-term effects of a failure to pay our bills on time.”
Keep tellin’ ourselves it’s DIFFERENT THIS TIME … but lets not kid ourselves, those are extremely dangerous words ‘round Global Wall Street …
AND an item NOT NFP related (at least not directly so)
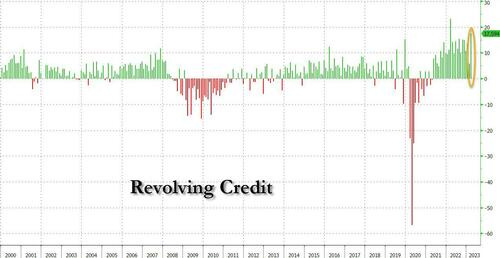
ZH: Consumer Credit Shocker: Credit Card Debt Explodes At 2nd Fastest Pace On Record Just As Rates Hit All-Time High
… What was shocking, was the monthly change in the other big category, revolving credit. As shown in the next chart, after rising at the lowest pace since August 2021, the March change in credit card debt absolutely exploded, soaring by $17.6 billion, more than triple the February total, and the second biggest monthly increase on record!
It's as if, either consumers - realizing this is their last hurrah to spend - went out and maxed out their cards at a pace (almost) never seen before, or perhaps the banks, desperate to load up peasants with some more debt, were handing out credit cards like hot cakes and the result is shown below.
Hmmm. SLOOS up Monday and expect some more light to be shed …
AND for any / all (still)interested in trying to plan your trades and trade your plans in / around FUNduhMENTALs, here are a couple economic calendars and LINKS I used when I was closer to and IN ‘the game’.
First, this from the best in the strategy biz is a LINKthru TO this calendar,
… THAT is all for now. Off to enjoy the back nine of the weekend.
But first … jobs market ahead of a recession be like the 5 stages of RTO and with the passing of legendary singer-songwriter Gordon Lightfoot, HERE was something written and offered back on April 26, 2021.
I’d BEGIN every day with a topical 2pg PDF with whatever news of the day making the rounds and I noted,
>> IN ADDITION TO that, this morning I want to unveil an updated MONTHLY MUSING, The Wreck of the FIATS (Feudal Irrational Archaic Tombs) … This one is for any/all Gordon Lightfoot fans as well as everyone else marginally attached to markets. You've got to have some sophomoric humor in these markets -- and on them, think oil DRIFTING LOWER, CRE 30-40% UNDERUTILIZED, higher global corporate taxes will INCREASE money laundering business (pay attention TO Caribbean TICS flows) and more... If you’re NOT offended by the time you reach then end of this one, well, we’re doing it wrong.
…The 1976 release by Gordo of the Wreck of the Edmund Fitzgerald pre-told and foreshadowed the disaster awaiting when the US selected a hick Georgia Governor to replace the unelected placeholder, Jerry Ford---what could possibly have gone wrong. Forty years later, history may be repeating itself.PLEASE SING ALONG ... as we traipse through the foggy, drug and storm filled 1970’s--bad cars, terrible fashion, ill prepared ruling elites and Disco. Try a ‘growler’ of Labbats Blue and cheese wiz as we ponder the ceding of control of M2 and The Wreck of The FIAT Currencies
AND … THAT is all for now. Enjoy whatever is left of YOUR weekend …


Excellent work. Thanks!!
I love Gordon Lightfoot..
I grew up in the 70s and I would probably still trade them for today.
Had a great time back then.
The 80s and Ronald Reagan, were even better.
No Mass Shootings. No Racial Division. More Sanity, Less Chaos...
The Communists were in the Soviet Union, not the WHite House.