Good morning … stock futures and bond yields RISE on heels of AAPL earnings, HOPE for banks all ahead of this mornings jobs report…
Long bonds, on the other hand, simply respecting the daily RANGE
Bearish momentum (stochastics crudely highlighted on bottom panel) are leaning BEARISHLY as we’ve just peaked up ABOVE 50dMA ~ 3.74% and all this set to change AFTER the data dust settles.
And SO the rest of this mornings note SHOULD be fairly brief … here is a snapshot OF USTs as of 705a:
… HEREis what this shop says be behind the price action overnight…
… WHILE YOU SLEPT Treasuries are slightly lower with the belly outperforming as UK and German bond markets lead a sell-off this morning. DXY is slightly lower (-0.1%) while front WTI futures are smartly higher (+2.65%). Asian stocks that were open were little changed, EU and UK share markets are higher (SX5E +0.4%, SX7E +1.9%) while ES futures are showing +0.6% here at 6:55am. Our overnight US rates flows were unavailable because of Golden Week and because my colleague in London said he was too tired to punch the keyboard keys, lol. Overnight Treasury volume was ~65% of average all across the curve.
… Treasury 2yrs, daily: Another attempt at a daily open or close below the 3.765% area yesterday; another failure. Simply, sellers still clearly dominate the buying flow in 2's below that range threshold. Meanwhile, you can see daily momentum in the lower panel and it has guided bullishly since support near 4.25% was rejected a few weeks back. It's not yet down to the kind of 'overbought' readings that we'd like to see for a local trend reversal, but it's edging closer for sure...
… and for some MORE of the news you can use » IGMs Press Picks for today (5 MAY) to help weed thru the noise (some of which can be found over here at Finviz).
From some of the news to some of THE VIEWS you might be able to use… here’s what Global Wall St is sayin’ …
On this lovely Cinco De Mayo Friday morning, there’s likely no better place to begin than this one from UBS
There is something faintly absurd about trying to sum up something like a complex labor market in a single word. “Tight” or “loose” does not really do justice to the US labor market, which simultaneously has very low unemployment and very low real wage growth. This has been an exceptional period with very high labor market churn.
There are two points for today’s US employment report. First, average hourly earnings are not wages. They are less and less useful as a proxy for wages at a time of structural change in the labor market, and when some workers are taking on multiple (lower paid) jobs. Second, the most important labor market issue is not directly measured—it is fear. If US workers become fearful of losing their jobs, precautionary savings will rise and spending will fall.
Ongoing banking volatility in the US does have real economic implications. The hierarchy of questions is: which consumers have borrowed from which banks? Are those banks tightening lending standards? Is there unused credit left on credit cards? …
I’ll pause and enter into a chart here / now from Walter Deemer which was HEREon fintwit yesterday … this one was ‘titled’
KRE aside, an email from BESPPOKE INVEST last night,
The Powell Fade; Rate Cuts Next?
… Earlier this week we sent out a report for clients looking at the typical market action seen on Powell Fed Days. Below is an intraday composite chart of the S&P 500 from the open of trading on Powell Fed Days through the 4 PM ET close. The shaded area in the chart represents the action from 2 PM to 4 PM. 2 PM is when Powell releases his decision on where the Fed Funds Rate should be, and Powell's press conference starts at 2:30 PM. As shown, Powell Fed Days have typically seen a lot of back and forth action in the final two hours of trading, but the market tends to trade sharply lower into the close.
Yesterday was Powell's 43rd Fed Day as Fed Chair, and below is the intraday action we saw in the S&P. Heading into the 2 PM Fed decision, the S&P was nicely higher on the day (red line represents the prior day's close), and it bounced around in similar Fed Day fashion from 2 PM to 3 PM. But in the final hour of trading, the Powell Fed Day pattern held true to form, with the S&P tanking into the close and going out at the lows of the day.
For somewhat MORE from BESPOKE,
BBGs Weekly FIX: Maybe those 2023 Fed cut bets aren't that crazy
… It was a toss-up between what to start the newsletter with this week. What’s more significant: likely the last rate hike of the most aggressive Federal Reserve tightening cycle since the 1980s? Or the fourth collapse of a US bank in under two months?
Let’s make the executive decision to go with the Fed meeting. Chair Jerome Powell was clear on two points: no decision has been made on a pause, and the Fed’s inflation outlook doesn’t support rate cuts.
However, market action on Thursday was clear: traders expect the central bank to take back Wednesday’s quarter-point hike almost immediately, with swap contracts penciling in a rate cut by July. At one point, the June swap rate reflected one-in-four odds of a cut at next month’s meeting.
While that may seem aggressive stacked against Powell’s performance on Wednesday, the yield curve’s track record suggests that maybe that pricing isn’t so outlandish. Looking at the past 17 hiking episodes, the two-year, 10-year Treasury yield curve bottoms out 108 trading days before the first rate cut, according to a Bespoke Investment Group report.
Using that guide, the 2s10s curve reached negative 111 basis points on March 8, and has since steepened to about negative 41 basis points. Assuming that marked the trough, 108 trading days lands in mid-August — sandwiched between the Fed’s July 26 and September 20 rate decisions.
BMO Capital Markets recently mapped out the Fed’s first rate cut from the perspective of how long the central bank tends to be on hold. Historically, the Fed tends to spend an average of seven months at terminal, BMO’s Ian Lyngen and company said on a recent Macro Horizons podcast. Assuming that the Fed just delivered the last rate hike, a rate cut in December would follow if going by that time frame.
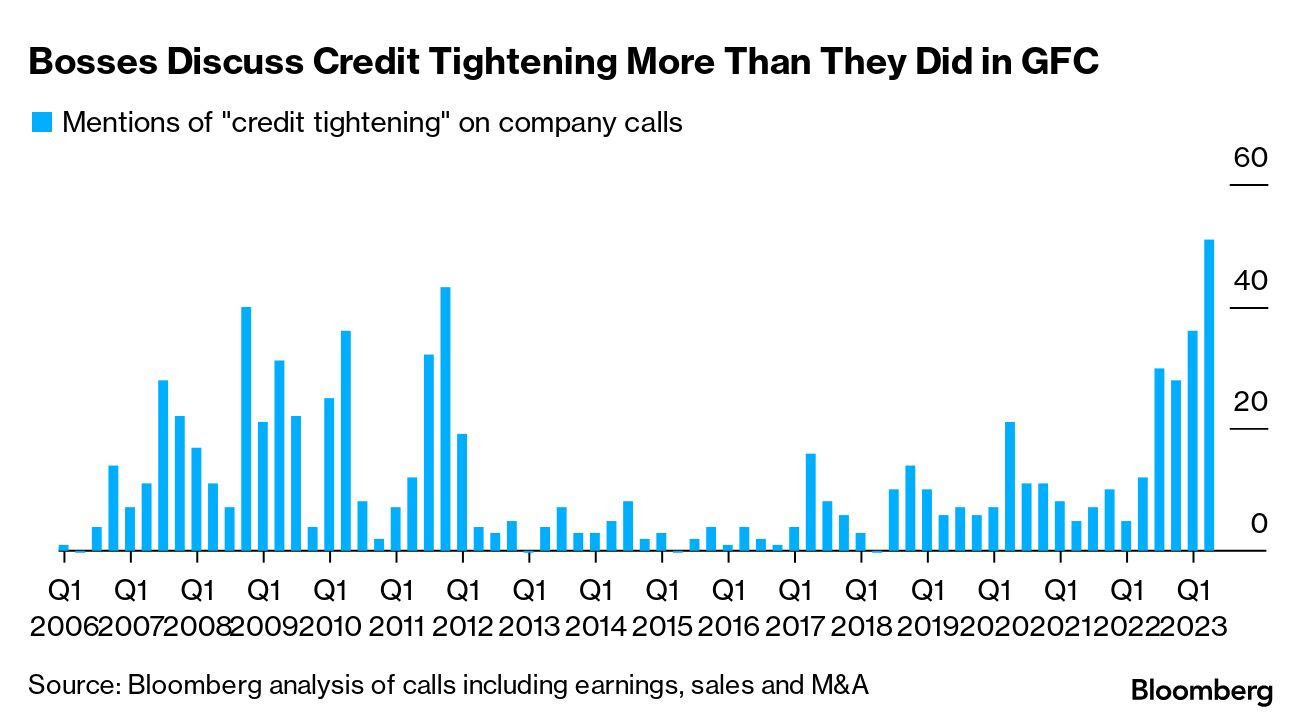
… Why does it matter? First, banks that are in trouble will tighten credit, and companies are now very worried that this is happening and could worsen. Remarkably, Bloomberg colleagues show that credit tightening has come up more often in earnings calls over the last few weeks even than during the horrors of 2008:
Second, it could force changes in both monetary and fiscal policy. Yields have fallen again this week on the belief that the bank crisis will compel the Fed to ease monetary policy. Possibly even more important, the most obvious solution could involve a big fiscal outlay. Insuring all deposits, advocated by many as the measure that could end the crisis, would be mighty costly, even on an interim basis. To do it on a permanent basis would require legislation, which in turn would require America’s polarized politicians to agree on something.
This is very different in concept from what happened in 2008. And as the problem is one of liquidity, or banks’ ability to raise money in a hurry, rather than solvency, it should be far less serious. Bank crises do happen from time to time. That doesn’t mean that this crisis can be ignored, or that it won’t be painful.
Speaking of 08 and BANKS … a chart or two of rates and banks,
… Check out the dual-pane chart of the Regional Bank ETF $KRE versus the REITs ETF $IYR ratio and the US 10-year yield $TNX:
Despite the KRE/IYR ratio peaking in March 2021, the 10-year yield continued to rise into the fall of last year. Therefore, I would expect regional banks to outperform real estate investment trusts as rates rise.
REITs tend to do well during periods of risk aversion while rising rates often speak to a risk-on environment. Plus, rising yields directly benefit many banks’ business models.
KRE’s inability to break above its prior cycle’s high relative to IYR was a poignant heads-up as many risk assets began to peak in spring 2021. Fast-forward to today, and fresh multi-year lows for this crucial intermarket ratio undoubtedly point rates lower.
But it’s not just KRE…
The broader bank sector ETF $KBE (which includes JPMorgan Chase & Co. $JPM and First Republic Bank $FRC) hints at lower rates and a potential steepening yield curve.
Notice KBE and the 2s-10s spread (inverted) follow the same path over longer time frames. The big difference: KBE peaked in January 2022, while the 2s-10s spread reached new multi-decade lows this past March (the lowest level since the early 1980s)…
Finally an OFFICIAL chart of a global supply chain, via the NY Fed,
Global supply chain pressures decreased again in April, falling to 1.32 standard deviations below the index’s historical average. The March value was revised downward from 1.06 to 1.15 standard deviations below the index’s historical average.
There were significant downward contributions from Euro Area delivery times, Euro Area stocks of purchases, and Korean delivery times. While the overall index declined, there was a notable upward contribution from Taiwan stocks of purchases.
Looking at the underlying data, the GSCPI’s recent downward trend has been consistently driven by improvements in Euro Area delivery times.
KRE:SPY vs Yellen/JPOW announcements (e.g., on deposit protection) would seem to be converging on one of those "psychological moments" I've heard periods of Fear, Anxiety, and "blood in the streets" give rise to.


KRE:SPY vs Yellen/JPOW announcements (e.g., on deposit protection) would seem to be converging on one of those "psychological moments" I've heard periods of Fear, Anxiety, and "blood in the streets" give rise to.