Good morning / afternoon / evening - please choose whichever one which best describes when ever it may be that YOU are stumbling across this weekends note…
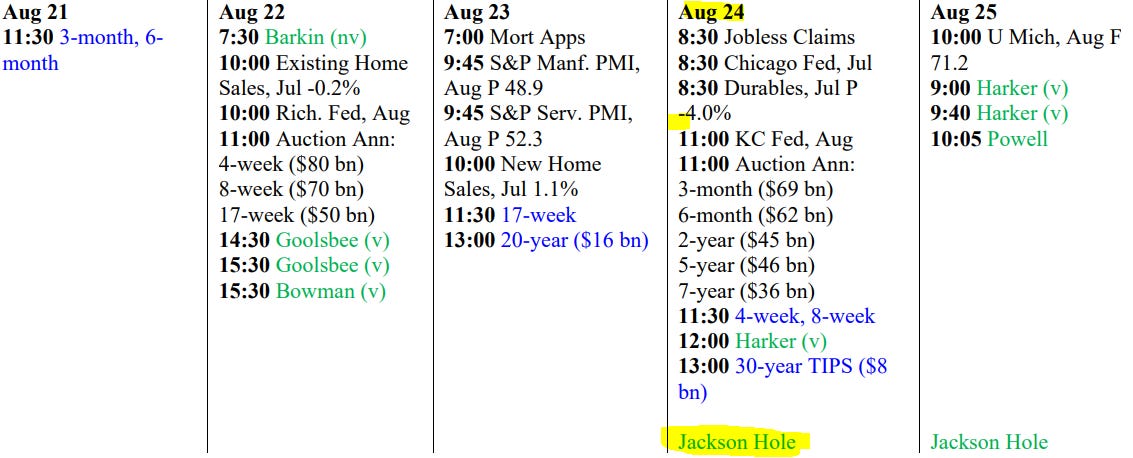
Here is a MONTHLY look at 10yy as we head into a sleeper of a week from an economic funDUHmental point of view (calendars below) where the sole highlight will be Jackson Hole …
Clearly can see downtrend has ended and we’ve closed the day and week just about 4.25% which appears to ME to be an interesting point on the (MONTHLY)charts. Far too early to comment on a (MONTHLY) chart but suffice it to say, I know we’re ALL watching.
What follows is by and large time and space FILLER with many outta pocket taking kids back to school OR simply just enjoying the end of summer.
Some fancy trying to explain recent selloff in bond market as FX and central planner related — PBoC and BoJ — couple of the largest holders becoming more activist?
I’ll spare MY uneducated GUESS but suffice it to say that as far as CHINA goes, well, they’ve been selling since …
Ok I’ll move on AND right TO the reason many / most are here … some UPDATED weekly NARRATIVES where I’d note a couple / few things which stood out to ME this weekend,
BAMLs Flow Show - No, Mr. Bond, I expect you to die
…James Bond, of course, never died; still...global yields keep rising despite massive inflows to Treasuries, Fed close to end of hiking cycle, US CPI 9% to 3%, China deflation, European recession...; catalysts for recent up-in-yields trade are May 31st US debt ceiling resolution (signaled no credit event/more fiscal stimulus), July 27th surprise BoJ tightening, Aug 1st US sovereign debt downgrade; but Big Picture, secular, more entrenched reasons why inflation higher (3-4%), cost of capital higher, volatility higher, asset returns lower in 2020s remain...
BMO weekly — Teetering Toward the Tetons — get into Nov23/Apr24 FF steepener
DBs Jackson Hole preview: (R-)star struck? (visual of various R-star estimates UP)
NWM on bond mkt TECHNICALS,… the technicals show the steepening momentum as overdone in the near term, opening up potential corrective flattening or at least sideways action. However the overall backdrop (weekly charts) remains to the steepener, and the outright charts show that 10s may have more room to run higher in yield having broken out – so the medium steepener leans to a bearish one. This aligns with our general fundamental view for the moment, that the underlying reasons for the late-July to early-August steepening has become more muddled (intervention fears, etc), so we expect more chop than anything in the near term. It also reinforces our caution in engaging to pure bull steepeners at this juncture – the technicals point to some potential further moves higher in yield for 10s, and fundamentally we continue to think it will take weakness in growth to kick off the more cyclical bull steepener. So on that front, we remain biased to steepeners, but via more neutral expressions rather than with a directional bias.
UBS rates FCAST UPDATE
We continue to forecast lower rates ahead for the US economy, but have felt it necessary to delay the timing. With the US economy showing resilience to monetary policy tightening, we have raised our 10- year US Treasury yield forecasts by 25bps.
And more … much, much more …
Moving along and away FROM highly sought after and often paywalled and Global Wall Street narratives TO a few other things widely available and maybe as useful from the WWW
AllStarCHARTS - The Bond Market Remains Stress-Free (credit. spreads….)
Credit spreads are the canaries in the financial market coal mine.
They’ll peep at the first sign markets face serious risks.
With stocks entering a corrective phase, it makes sense to seek information from the biggest exchange in the world.
The bond market.
Credit spreads remain tight despite increased selling across US equities.
That’s the opposite of what I’d expect during a severe selloff.
What does that tell us?
Check out the overlay chart of the Russell 2000 ETF $IWM with the high-yield credit spread ratio, $HYG/$IEI:
Spreads are contracting as the HYG/IEI ratio challenges new 52-week highs and the Russell 2000 retreats from a logical level of overhead supply.
A pause in the immediate trend for small-caps makes sense.
Corrective phases are a healthy part of any uptrend. Remember, price doesn’t move in a straight line.
Yes, it’s messy, but the bond market has yet to warn of a more severe pullback in stocks.
The HYG/IEI ratio will experience a steep decline if broad selling pressure picks up steam for risk assets.
But that’s not the current state of the markets.
Instead, bonds send a clear message of “all’s well” as spreads happily chirp away.
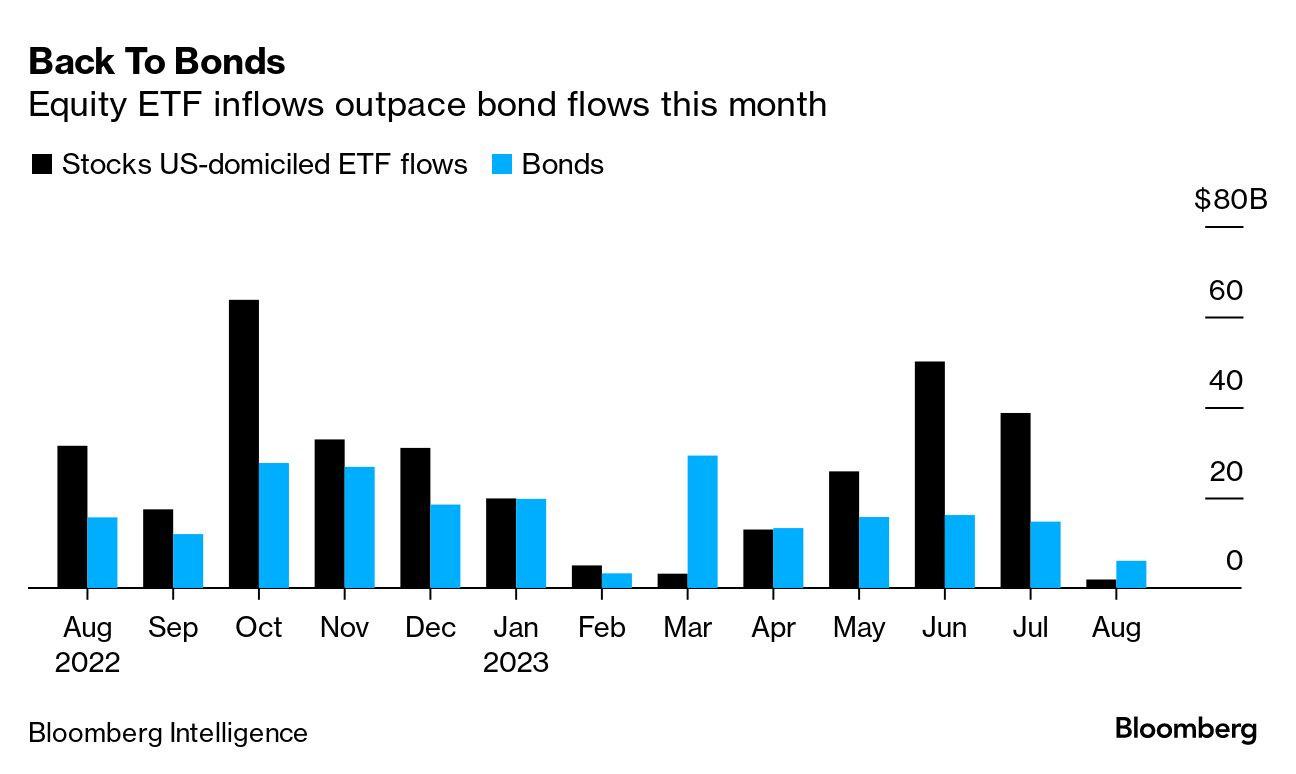
Bloomberg’s Evening Brief “Bonds over stocks” (catchy title, dontcha think?)
Volatility in the world’s biggest bond market has finally caught the attention of stock-happy Wall Street. A Treasury rout that pushed 10-year yields close to their highest point since 2007 has spurred what is now the biggest break in an $8 trillion equity rally. Major US benchmarks just slid for a third straight week. While debate rages over why the bond market has turned dangerous, the issue for equity investors is less abstract.
Rising risk-free payouts are getting too rich for many to turn down, particularly compared with expected returns in loftily priced stocks, says Ulrich Urbahn, head of multi-asset strategy at Berenberg. “Given rising real yields and ambitious valuation levels in particular for US stocks,” he says, “the risk-reward looks better for bonds.” —David E. Rovella
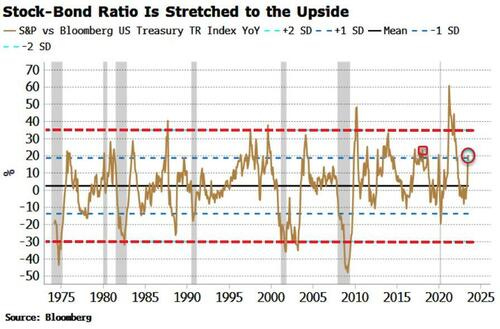
Bloomberg (via ZH) - Stocks Are Overbought Relative To Bonds (um … there’s a message in here … trying to figure…)
The stock-bond ratio is on the high side, suggesting some mean reversion is possible, i.e. for stocks to underperform bonds. This can happen either through stocks selling off more than bonds, or more likely given bonds’ oversoldness, bonds rallying by more than stocks.
Stocks have given back some ground in recent weeks, down about 4% from their July high, but bonds have sold off even more, with 10-year yields almost 60 bps higher at ~4.3%.
This has led to the stock-bond ratio’s annual growth rate hitting levels last seen in 2018 and briefly in early 2020. As the chart below shows, the stock-bond ratio is mean reverting, and we are around growth levels where it could soon revert to the mean (or overshoot to the downside).
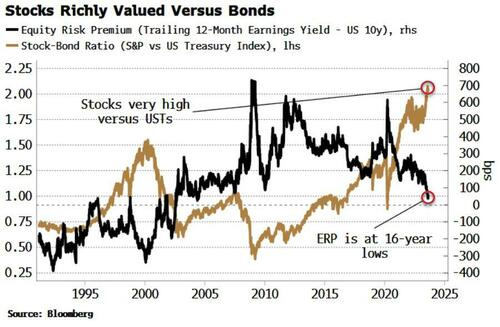
This is consistent with the depressed equity risk premium (ERP).
The ERP captures the relative valuation between stocks and bonds. It has fallen to more than 15-year lows as the earnings yield drops relative to the 10-year yield. Stocks only offer ~30 bps more yield than a 10-year Treasury bond.
The attraction of risk-free cash at high rates is a significant one.
Why take the risk of stocks when you can lock in 4.3% for ten years, or well over 5% for under a year, for effectively zero risk?
Indeed such juicy offerings are enhancing long/short equity funds’ returns.
Their shorts typically fund most of their longs, and they can invest remaining cash in high-yielding bills or MMFs to bolster returns.
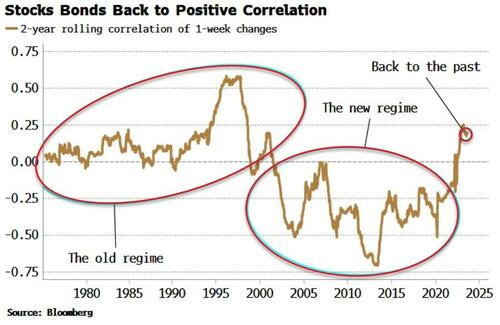
One anticipated feature of the current inflationary regime that has come to pass is the now positive correlation between stocks and bonds. In the days of low-and-stable inflation their negative correlation meant bonds were a good hedge for stocks. That is no longer the case.
Given that bonds are short-term oversold, and assuming this positive correlation persists, then it’s more likely we see stocks-bonds mean reverting through bonds rallying more than stocks, as falling yields allow equities to end their three-week losing streak.
Bloomberg’s The Weekly Fix: Bond pain trade is the soft landing sinking in (while maybe NOT as funTERtaining as BONDS over stocks h’line, the idea of the BOND PAIN TRADE certainly eye-catching and clickworthy, no?)
On The Bright Side
There’s an optimistic argument to be made for why long-dated Treasury yields are screaming higher: bond investors have gone from bracing for a recession to pricing in a soft landing.“The 10-year and the 30-year Treasury yield is telling you it’s not necessarily inflation, but growth is a lot stronger than I think most have anticipated,” Mary Ann Bartels, chief investment strategist at Sanctuary Securities, said on Bloomberg Television. “When I look at where we could potentially go on the 10-year, I think we could go to 4.8 to 5%, and I think the 30-year can go to 5%.”
Yields on 10- and 30-year Treasuries soared to within a few basis points of their 2022 highs this week, evaporating year-to-date gains in the process. There’s plenty of potential catalysts: ballooning Treasury supply, a still-hawkish Federal Reserve and a US economy that has yet to show the strain of more than 5 percentage points of rate hikes.
That economic resilience — and the expectation it will continue — help explain why long-end yields have come unmoored over the past month. A series of solid data prints have pushed Citigroup Inc.’s US economic surprise index close to the highest levels in nearly two and a half years, while economists are tripping over themselves to push back their recession calls.
Meanwhile, inflation expectations remain incredibly benign. As real yields rocket higher, 10-year breakeven rates currently stand near 2.32% — well below last year’s highs.
“It’s the underlying growth element that has driven the bond market in my estimation,” Greg Peters, PGIM Fixed Income co-chief investment officer, said on Bloomberg Television. “To me, it’s all about the strength in economic activity and sure, inflation remains above trend, but it’s really the growth story.”
… Curve Swerves
A consequence of the breathless move higher in long-end rates is a rapid re-steepening of the yield curve. The spread between 2- and 10-year yields is currently hovering near -66 basis points, after entering July below -100 basis points.That’s a titanic move in a month and a half, but what dynamic will finally restore order and drive the 2s10s curve back into positive territory?
PGIM’s Peters sees a bear-steepening in the offing — a continued re-rating of the long-end will see yields there rise above their short-dated counterparts.
“If you believe inflation is going to remain relatively high, the economy’s strong and stable, then the curve has to start to normalize and back-end rates have to move higher as a consequence,” Peters said.
That squares with a thought from Pacific Investment Management Co. co-founder Bill Gross, who posted on X earlier this month that the “curve may disinvert by 10 yr rising.”
Jim Caron of Morgan Stanley Investment Management is on the other side. The firm’s co-CIO of global balanced risk sees a bull-steepening driving the yield curve back to more-normal territory once the Fed embarks on rate cut.
“If the Fed is at 5.5%, if we have — let’s say a mild recession, which most people think we’re going to have — let’s say they cut interest rates down to 4%. Well, what slope will the yield curve have?” Caron said on Bloomberg Television. “When we have that mild recession maybe in 2024, is it going to be a positive slope? If it is, then 10-year yields may not move much from these levels.”
… Juiced UP
If the hair-raising moves in the Treasury market aren’t enough to get you going, there’s always the world of leveraged exchange-traded funds.Nearly $2.3 billion has streamed into the the Direxion Daily 20+ Year Treasury Bull 3X ETF (ticker TMF) this year, including more than $500 million in the past month, data compiled by Bloomberg show.
TMF, which uses derivatives to deliver three times the performance of long-dated Treasuries, is getting hosed. It’s down 23% on a total return basis, following an epic plunge of 73% in 2022.
Appetite for TMF has only been building among its short-term day-trading audience as losses deepen.
“Nobody is using TMF for long-term exposure,” said Dave Nadig, financial futurist at the data provider VettaFi. “Nobody’s buying and holding it for 10 years. They’re day-trading it. More volume means more assets needed.”
Amazingly, TMF’s hot streak only really kicked into gear once the Fed began its rate hiking campaign last March. The ETF is on track for a 14th straight month of inflows, lifting its total assets to $2.4 billion, from roughly $400 million a year ago.
While a 23% drop sounds bad enough, the fun thing about leverage means that losses could really accelerate if yields keep climbing.
Bloomberg’s 5 things to start your day (Asia, Friday morn — cuz you know, you gotta steer LEFT into a skid to go right),
… US 30-year yields reached the highest since 2011 on Thursday, at 4.42%, while 10-year peers came close to busting out to a level last seen in 2007. The key question for bond investors is whether yields are now at or near their peaks for this cycle? If Larry Summers and other doomsayers are right the answer is that the peaks remain some distance away. Bill Ackman at Pershing Square Capital said earlier this month the 30-year could end up at 5%.
If that sounds like a dire outcome, the historical record signals 10-year yields have scope to climb a full percentage point or more. Previous Fed hiking cycles saw the bond benchmark top out at the same level as the Fed’s target rate or even higher. The 10-year yield also usually peaked at about the same time as the Fed halted its hikes. Perhaps this time is different, given the impact of the Fed’s bloated balance sheet acts to repress yields. Investors busy betting on a recession-fueled bond bonanza will be hoping as much.
Bloomberg OpED - Meet the new bonds, same as the old bonds (John Authers notes / thoughts were interesting ESPECIALLY ON POSITIONS…)
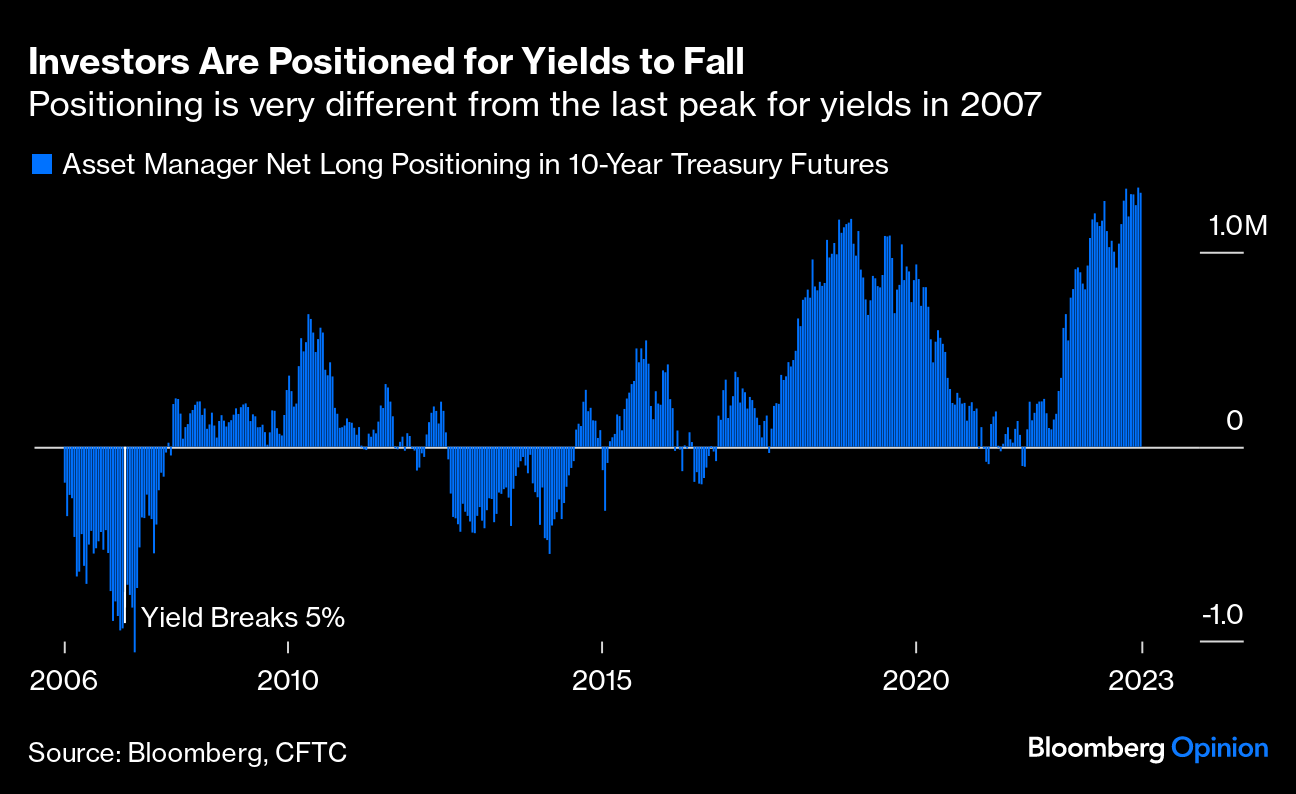
… Investors Are Positioned for Lower Yields, Not Higher
The move has not been driven by any great shifts by long-term investors, who are increasingly inclined to view Treasury bonds as a “buy” now that the Fed appears to have finished with rate hikes. In the US, the shift higher has startled investors, who entered 2023 quite confident that the peak for the yield had been reached last October. Asset managers, as tracked in commitment of traders data, are currently long 10-year Treasury futures to the greatest extent since the GFC, meaning that they are positioned for bond prices to rise and yields to fall. This is exactly the opposite of the last big bond breakout in the summer of 2007, when the crisis was taking shape and managers were strongly positioned for yields to keep rising. (They did the exact opposite.)If yields keep heading upward, it could create as much pain for investors as the big fall in 2007 and 2008…
HIMOUNT - Rising Yields Add To Pressure On Stocks (Willie D offering some realism)
The yield on the 10-year T-Note has broken out to its highest level since 2008, while the yield on the 1-year Treasury is at a level not since in over two decades. The historically wide spread between 10-year and 1-year yields is narrowing as long-term yields move toward short-term yields.
Rising yields and the continued shift away from excessive optimism keep pressure on stocks, adding to the deterioration being seen beneath the surface.
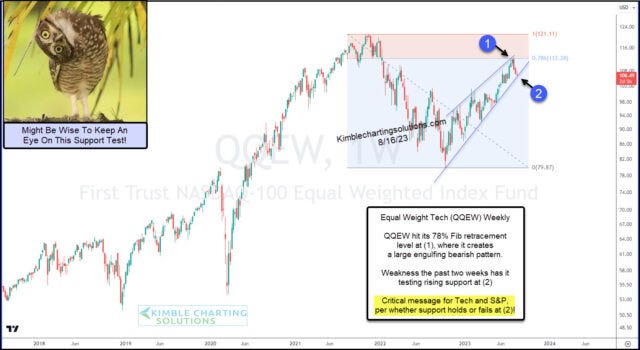
Kimble — Are Technology Stocks About To Send Risk-Off Signal? (asks and attempts to answer in his classic ‘cliff hangin’ style)
Tech stocks have been leaders once again in 2023 following its broad-based correction into 2022.
BUT, we are not out of the woods just yet!
Today’s chart looks at the Equal Weight Nasdaq 100 ETF (QQEW) and provides an insightful snapshot of the current state of large cap technology stocks.
As you can see, the rally reached all the way up to the 78% Fibonacci retracement level at (1) before pulling back this month. And the rally has taken the shape of a narrowing rising wedge.
Currently, QQEW is testing its rising support trend line at (2). This looks very important over the near-term.
In my humble opinion, what happens here will send a critical message to the broader stock market. Will support hold or fail? Stay tuned!
LPL - Yields on the Rise - Too Much Too Fast? (a look at this week's breakout in UST yields…AND what it **COULD** mean for stonks))
Key Takeaways:
Yields have moved a little too much too fast for equity markets, pushing the correlation between stocks and 10-year Treasury yields into negative territory for the first time since March.
From a technical perspective, 10-year Treasury yields remain uncomfortably high as they approach resistance from the October highs. Considering stocks bottomed nearly at the same time longer duration yields topped out last fall, a breakout to new highs on the 10-year would be a warning sign for a potentially deeper pullback in stocks.
Energy could outperform if yields continue higher. The sector is the only one positively correlated to 10-year Treasury yields.
… In the event of a breakout, the next significant areas of resistance for yields set up near 4.50% (2006 lows) and 4.70% (prior mid-2000s highs).
AND for any / all (still)interested in trying to plan your trades and trade your plans in / around FUNduhMENTALs, here are a couple economic calendars and LINKS I used when I was closer to and IN ‘the game’.
First, this from the best in the strategy biz is a LINK thru TO this calendar,
Wells FARGOs version, if you prefer …
… and lets NOT forget EconOday links (among the best available and most useful IMO), GLOBALLY HERE and as far as US domestically (only) HERE …
… and remember,
"Weekends are a bit like rainbows; they look good from a distance but disappear when you get up close to them."
- John Shirley
And remember … If you don’t LIKE what you see, feel free to reach out and help ME to improve and make this thing — whatever the heck it is — better.
Wait, no, scratch that cuz,
… Enjoy whatever is left of YOUR weekend and THAT is all for now.








Good work !!!
Can't help but think that "Confusion" might best describe the State of the Bond Market......
Lots of Smart People and still it's very unclear, which way the Economy and IRs, will go in
the next 6-12 months
Muddle Through....if I had to guess, but in this world you never know ???
Folks muddling staying short benchmark retail continues to funnel $ into mm mutual funds so I’m trying to assess risks from both retail AND institutional investors having same duration call … not 💯 sure as to institutional bias (sees some interpretation of futures positions but without my Terminal only speculation…) .. have a great Jackson Hole week ahead!