Good morning / afternoon / evening - please choose whichever one which best describes when ever it may be that YOU are stumbling across this weekends note…
First, for all those money managers out there, well, this PPI was for you?
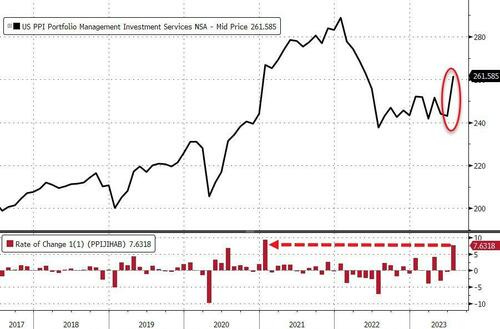
ZH: Producer Prices Rose More Than Expected In July; Money Management Fees Soar
… Product detail: Forty percent of the July advance in the index for final demand services can be traced to a 7.6-percent rise in prices for portfolio management.
Hmmm … I’m sure it’s nothing … nothing at all BUT ZH mkt wrap DID catch my eye, cuz
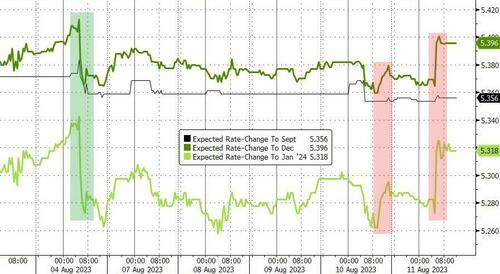
… But the big theme of the week was 'inflation' appearing to be stickier than many 'soft landing' narratives had accounted for which pushed Fed rate expectations higher on the week (erasing the dovish response to last week's payrolls)
AND on TO some weekly NARRATIVES where I’d note only a couple / few things this weekend,
BAML (rates weekly — technically long THEN get short)
Breaking up is hard to do…Long US 10y to 3.85-3.9%, then debate flipping short … tactical setup is long to 3.85-3.90% (trend line). This is the first line to consider covering longs and/or flipping short assuming the higher yield channel continues. The next point is the prior low and 200d SMA at 3.71-3.72% …”
BMO weekly — consumer squeeze comin’, booked profit from short 2s and lookin to enter (2s10s)flattener MS weekly - NO sleep ‘til Jackson Hole — stay LONG 5s, in front-end flatteners and long 30y TIPS MS separately moving IN credit spread target
Moving along and away FROM highly sought after and often paywalled and Global Wall Street narratives TO a few other things widely available and maybe as useful from the WWW … NOTE — MY commentary (highlighted this way) as I am still trying to figure out how best to relay some of these resources along with a reaction / opinion.
Almanac Trader: Looking for a Mid-August Bounce After a Weak Start - Almanac Trader (looking for a bit of a bid in very short-term)
Despite modest gains yesterday by DJIA, S&P 500 and NASDAQ, all the major indexes we track were down over the first eight trading days of August. As of yesterday’s close, August 10, NASDAQ was the weakest, off 4.24% this month. Russell 2000 was the second weakest, down 4.02%. S&P 500 slipped 2.62% while DJIA was down 1.08%. Compared to past pre-election year August performance since 1950, this August has tracked closely. Should the market continue to track the historical pre-election year August pattern, a mid-month bounce could begin soon. This historical mid-month move is shaded in yellow in the following chart.
Federal Reserve Chair Jay Powell talks a lot about consumer inflation expectations as a leading indicator for actual inflation. One of the main reads on inflation expectations comes from the University of Michigan's (U. Mich) Consumer Confidence survey. The most recent U. Mich release came out this morning and showed that consumers' one-year forward inflation expectations are now at +3.3% (YoY), which was below the consensus economist estimate for a reading of 3.5%.
What's notable about the 3.3% number is that it's below the 45-year average reading of 3.6%, meaning consumers have gotten more sanguine about inflation compared to last year when readings were routinely coming in above 5%.
Bloomberg- The Weekly Fix: Bonds still haven't found their recession (yields GLOBALLY inching higher — not JUST ‘Merica)
… Stuck in the Middle Bond investors keep on discovering that the recession they've been betting on remains palpably distant. That’s set off a bewildering array of recommendations from strategists and money managers, as the consensus call of a severe economic downturn loses credibility.
Goldman Sachs Group Inc. and JPMorgan Chase & Co. were telling clients to buy Treasuries after last week’s rout. Rob Waldner of Invesco talked of the “great buying opportunity” represented by 10-year US yields above 3.5%.
That contrasts with the numerous strategists who were busy plotting out the potential path to even higher yields. Hedge funds were piling in to shorts on Treasuries as bonds sold off, with asset managers taking the other side of the trade in long positions.
Guggenheim Partners Investment Management, which manages more than $225 billion, is no fan of the soft-landing thesis, so it is hiding out in high quality bonds while bracing for lower quality parts of the credit market to get hit.
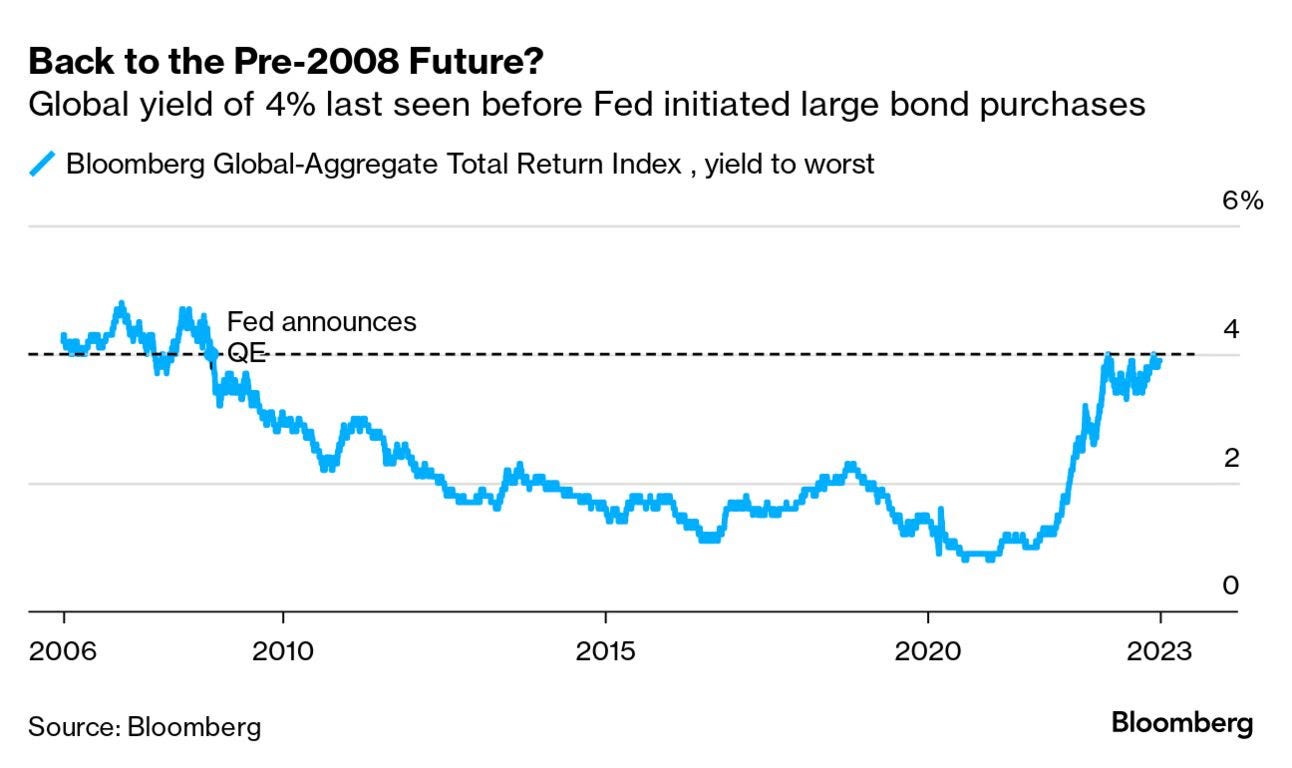
The week began with German 30-year rates pushing to the highest since 2014. It ended with the yield on the benchmark global bond index edging closer to the 4% level last seen in November 2008 before the Fed announced massive bond purchases, known as quantitative easing.
… There is another round of inflation reports as well as another look at the health of the labor market before the Fed’s meetings in September, and with energy prices likely to push inflation readings higher between now and then, we wouldn’t count out the chances of the Fed considering another rate hike. The economy is in the grip of a battle between the ongoing impacts from the tsunami of money that hit the system in 2020-2021 and is still being absorbed, while at the same time starting to show signs of the riptide from the Fed and Treasury Department pulling money out of the system in the past year. Economic growth remains positive, but we still believe a recession is on the horizon. How the Fed will respond if/when a recession appears is very much an open question. The Fed’s failures in the 1970s should be a stark reminder of the painful results of easing before the battle against inflation is fully won…
LPL- What a Pullback Could Look Like (whatever you do, DON’T PANIC…)
Key Takeaways:
While there is strong support for stocks being in a bull market, overbought conditions, weak seasonality, rising interest rate volatility, and ongoing uncertainty over monetary policy suggest a shorter-term pullback in this rally could be underway.
In terms of downside, support for the S&P 500 sets up at 4,450 (June highs), 4,432 (50-day moving average), and near the 4,200-4,300 range (uptrend/prior highs). We believe the latter support range is the most likely spot for a bounce given the confluence of support in this area, the degree of record-high cash sitting in money market assets, and the fact many investors missed the first half rally.
Don’t panic—pullbacks are normal, even during years with above-average returns. History suggests a 5-10% drawdown between now and year-end is not uncommon, even during years with strong rallies into August. However, even with a drawdown, the S&P 500 has still historically generated positive average returns into year-end.
… As shown below, the S&P 500 began its pullback at 4,600 with a bearish engulfing candlestick on Thursday, July 27. (For reference, bearish engulfing candlesticks are often found after upward price moves and suggest a shift to supply overwhelming demand.) At that time, the index was trading at around a 12% premium to its 200-day moving average (dma), marking over two standard deviations above average, while nearly 20% of index constituents were also overbought based on their Relative Strength Index (RSI). While overbought does not mean over, we suspect this could be a logical spot for a pause or a pullback in this rally, especially as the market enters a weak seasonal period.
In terms of downside, support for the S&P 500 sets up at 4,450 (June highs), 4,432 (50-dma), and near the 4,200-4,300 range (uptrend/prior highs). We suspect the latter support range to be the most likely spot for a bounce given the confluence of support in this area, the degree of record-high cash sitting in money market assets, and the fact many investors missed the first half rally. We view the 200-dma as a worst-case scenario for a drawdown….
… Benign disinflation. Over the summer, inflation has surprised to the downside, with core inflation running at an annualised rate of 2% in both June and July, respectively. The disinflationary wave comes from falling car prices, moderating shelter inflation, and slower non-shelter service inflation.
Looking ahead, forward-looking indicators point to continued disinflation in the coming months.In thinking about inflation, it is useful to break it down into three components: Core goods, shelter, and non-shelter services. In the core goods sector, private measures for wholesale prices on used vehicles have continued to slide over the last couple of months, which point towards more deflation in the CPI used car category…
… Stronger-than-expected growth. Throughout the year, the US economic cycle has continued to play out more slowly than most expected. Starting the year most investors and economists thought a recession was imminent. This was clearly not the case, and analysts have continued to revise their growth expectations upwards. If anything, recent months show economic momentum strengthening. The US homebuilder confidence has risen for seven straight months and that means residential fixed investments are likely to boost growth in the coming quarters. The strong labour market has been the driving force behind the stronger than expected economic activity. With falling inflation real income will start to rise and that is likely to boost consumer confidence and consumption in the coming quarters.
Chart 5: Green shoots for housing market
Transitory goldilocks. The next couple of months look perfect. Inflation is set to slow and growth is likely to stay strong. The big question is what happens after that? If the labour market stays strong and wage growth does not come down, then there is a growing risk that benign disinflation can quickly turn into malign inflation…
Consumer sentiment did not move materially in August. Consumers see prices broadly heading lower even as they expect interest rates to continue to rise. One factor that could disrupt the expectations around prices would be if the recent surge in gas prices does not reverse course.
AND from an ‘official’ source which seems to have a very important message or at least one which is near and dear to me even though I’m now far removed FROM the Treasury markets …
FRBNY: Dealer Capacity and U.S. Treasury Market Functionality
We show a significant loss in U.S. Treasury market functionality when intensive use of dealer balance sheets is needed to intermediate bond markets, as in March 2020. Although yield volatility explains most of the variation in Treasury market liquidity over time, when dealer balance sheet utilization reaches sufficiently high levels, liquidity is much worse than predicted by yield volatility alone. This is consistent with the existence of occasionally binding constraints on the intermediation capacity of bond markets.
… Figure 1. US Treasury market illiquidity measures. Average z-scores across the 2-, 5-, and 10-year maturity sectors of price impact, bid-ask spread, and depth from the interdealer market and on-the-run premium, price dispersion, and yield curve root-mean-squared-error (RMSE) from the dealer-to-customer market. The first principal component of the 18 z-scores is plotted in bold. All variables are shown, for clarity, in the form of five-day moving averages. The sample period is July 10, 2017 to December 31, 2022 excluding holidays and early closes (T=1,336 trading days).
… CONCLUSION
… The status of US Treasury securities as the world’s premier safe haven rests in part on the depth and liquidity of the market in which they are traded. Our results shed new light on the dependence of market liquidity on asset volatility and dealer intermediation capacity, and add focus to ongoing policy efforts to improve the resilience of the US Treasury market, an anchor of global capital markets.
WATCHING … AND finally, for any / all (still)interested in trying to plan your trades and trade your plans in / around FUNduhMENTALs, here are a couple economic calendars and LINKS I used when I was closer to and IN ‘the game’.
First, this from the best in the strategy biz is a LINKthru TO this calendar,
Sorry for the ‘rushed’ job this weekend … shot clock on summer winding down and last thing YOU want / need is to spend it listening to / reading through my (or other) views. Will try to do something better next time but … THAT is all for now. Enjoy whatever is left of YOUR weekend …
I like the new insertion of Snide-side comments! Is 7.6% the new 6%, as in management fees? It's interesting, the Pro's are Stock-Pickers, but retail investor (i.e. Sucker/BAGHOLDER) is encouraged or Herded into ETF's. The used car lots were quite empty yesterday out in Sacramento. Why is it that used car dealerships have a shady, fly-by-night operation feel to them? And why do I feel quite at home in that element now....?


I like the new insertion of Snide-side comments! Is 7.6% the new 6%, as in management fees? It's interesting, the Pro's are Stock-Pickers, but retail investor (i.e. Sucker/BAGHOLDER) is encouraged or Herded into ETF's. The used car lots were quite empty yesterday out in Sacramento. Why is it that used car dealerships have a shady, fly-by-night operation feel to them? And why do I feel quite at home in that element now....?