Good morning / afternoon / evening - please choose whichever one which best describes when ever it may be that YOU are stumbling across this weekends note…
Not sure how to read Friday’s data — Fed’s favored inflation gauge? Allow the internet (ZH and…) to help
ZH: Fed's Favorite Inflation Indicator Tumbled In June, But Wage Growth Reaccelerated
WolfSt: Fed Favored “Core” PCE Price Index Rises 4.1%, Least since Sept 2021, on Drop in Durable Goods. But Monthly Services Inflation Accelerates
There’s always a big ‘ole BUT so as we can see whatever it is we want in support of one’s PnL, duration call and / or overall positioning and view.
With THAT in mind and inflation top of mind everywhere — for those in the moderating (dare I say, TRANSITORY again?) camp,
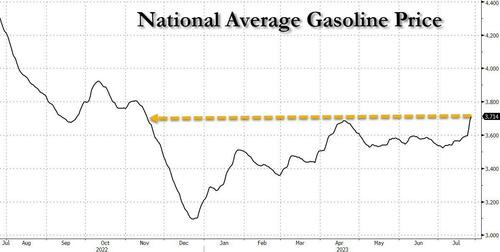
ZH: US Gasoline Prices Reach 8-Month High
Um … This cannot bode well for Team Transitory IF these high / RISING prices at pump persist. I would imagine those responsible for SPINNING Bidenomics are working feverishly in the background to try and come up with a new and different / distracting NARRATIVE.
AND with NARRATIVES in mind and without further delay, on TO some UPDATED weekly NARRATIVES where I’d note only a couple / few things this weekend,
BAML on PENSION FLOWS,
… we see c.-$14bn of rebalancing flows out of equities and into fixed income (the standard deviation of monthly equity rebalancing flows over the last three years is c.$22bn). In the FI space, the flows break down between c.$5.5bn into Treasuries, c.$6.5bn into Corporates, c.$1.5bn into Agency & GSE-backed securities, and c.$0.5bn into Mortgages …
Barcap rates weekly - Leaving the door open
TREASURIES: Trading strategies around Treasury auctions … Outright duration trades are likely to be affected by macroeconomic factors to a greater extent. The hit (success) ratios of such trades have been mostly above 50%, with some having good information ratios. Those heading into auctions have generally performed better than those coming out of auctions. Curve trades in general have been less profitable than butterfly trades…
BMO rates weekly - Ref Back in Refunding (covered short 2s, fwd entry long 10s)
SocGEN a seller of 10s vs 3s20s
TD a buyer of 5yy REALZ
AND more … Moving along and away FROM highly sought after and often paywalled and Global Wall Street narratives TO a few other things widely available and maybe as useful from the WWW …
First up and in concert with what was noted last weekend — HIMCOs latest quarterly HERE, and thanks to those (Anthony) who’ve pointed out Lacy Hunt on WEALTHION (wealthion.com/lacy) and catch BOTH PARTS of the interview …
Once you’ve consumed all that — BOTH parts of the interview AND HIMCOs NOTE HERE, a few more random musings and links from the intertubes which I feel important into the week ahead … especially as we contemplate ramp UP in ISSUANCE (quarterly reFUNding announced after ADP Wednesday),
"This is a colossal liquidity drain that should only continue. It is likely to trigger the next, bigger down-leg in overvalued mega-cap tech and other mispriced financial assets." @ Tavi Costa
For us VISUAL learners trying to play along here at home, a couple items caught MY attention
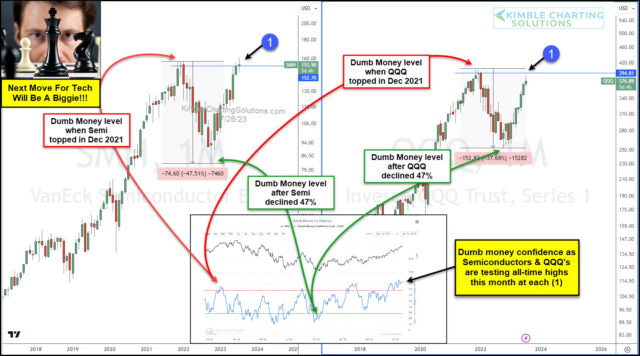
Kimble: Dumb Money Indicators Hits Extreme Level, Frothy Signs For Tech?
… Looking at today’s “monthly” chart, it is clear to see that the all-time highs mark important resistance. But we can also see another indicator further below – the “dumb money” confidence indicator.
And that is off-the-charts high! You can see that it is well above the red line (caution).
The next move for tech looks to be an important one. Will extreme dumb money confidence, from Sentimentrader.com, mark a bubbly trading top or will the good times carry on?
(as goes tech so goes bonds?)
McClellan: Further Inversion of Yield Curve Pushes Out End Date for Bear Market
… It is worth noting a glaring exception to this 22-month lag principle. We saw a very minor yield curve inversion in August to September 2019, which should have meant a bottom for the stock market ideally in June to July 2021. But we saw the bottom come much earlier, in March 2020, thanks to the arrival of Covid and the decisions by our governmental leaders to first shut down the economy (2 weeks to stop the spread), and then to shove a firehose full of money into the economy's mouth. Those actions pulled forward the stock market bottom that ideally should have come in 2021.
While the stock market reacts to the yield curve with a lag, there is another very important relationship regarding the yield curve, which acts on a coincident basis:
The yield curve and the unemployment rate are very tightly correlated. But when thinking about cause and effect, the yield curve is not the causative agent. The yield curve gets changed mostly by Fed action, and the policy makers react to what unemployment is doing. When unemployment is rising, the Fed will cut short term rates, steepening the yield curve. And they do the opposite when unemployment is low, based on their belief that this will somehow help to remediate inflation. My longtime readers know that the Fed is not really in charge of inflation, as discussed here.
The key point to notice, though, in this comparison of the 10y-1y spread to the unemployment rate is that EVERY TIME we see an inverted yield curve, it produces a dramatic rise in the unemployment rate in the months that follow. This time, the unemployment rate is taking a while to respond, which is great for those who still get to have jobs. The Fed seems to think that perhaps this time is different, and they can bring about a "soft landing" or "no landing" scenario regarding unemployment. History says that is a pretty foolish belief. Unemployment going up has always signaled that the end of the inverted yield curve is upon us.
Moving along TO a few words / visual from Scott Grannis (former WAMCO econ) stealing a page outta Lacy Hunts playbook,
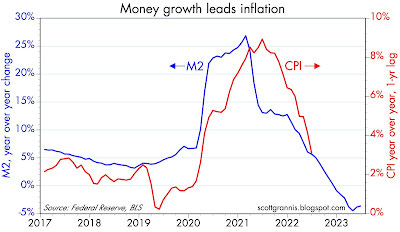
Calafia Beach Pundit M2 update: inflation still headed to zero
… Chart #2 compares the year over year growth of M2 with the rate of consumer price inflation, with the latter shifted to the left by one year to illustrate the fact that there is approximately a one-year lag between changes in M2 growth and changes in inflation. The chart strongly suggests that the CPI is on its way to zero over the next 6-9 months. As such, it's reasonable to conclude that the Fed has acted appropriately, if belatedly, and no further tightening is therefore necessary; lower inflation is "baked in the cake" at this point.
AND for any / all (still)interested in trying to plan your trades and trade your plans in / around FUNduhMENTALs, here are a couple economic calendars and LINKS I used when I was closer to and IN ‘the game’.
First, this from the best in the strategy biz is a LINK thru TO this calendar,
Wells FARGOs version, if you prefer …
… and lets NOT forget EconOday links (among the best available and most useful IMO), GLOBALLY HERE and as far as US domestically (only) HERE …
THAT is all for now. Enjoy whatever is left of YOUR weekend …


Article earlier about Real vs Nominal YC inversions was reverberating while listening to Lacy discuss todays YC inversion. "High inflations lead to nasty recessions". The late 70's/early 80's inversion is on my mind, as that preluded a rather nasty recession. Thanks....for everything Steve!