weekly observations (11/06); NFP recaps and victory laps (multiple job holders); positions and narratives changing (again) as profits booked and new HOPES / trades put on
Good morning / afternoon / evening - please choose whichever one which best describes when ever it may be that YOU are stumbling across this weekends note….
AND … the winner IS … Dept of Treasury with somewhat lower issuance (HOPES ALIVE) straight ahead, the Fed (pause), the economic data (NFP putting PAID on the Fed pause)? Wait, I know … BAD = good? Or less good = GREAT? LESS = more?
Please choose one?
First UP lets deal with
BEFORE jumping in to a couple / few things NFP related items — which are sure to be as informative as they are funTERtaining victory laps and I TOLD YA SOs — we need to pause and recall what it is we THINK we know about DRUCKS POSITION which was noted a couple days ago … Druck says he’s got a ‘MASSIVE’ bullish bet on 2s (citing BBG story HERE).
Leads me to FIRST question of the weekend …
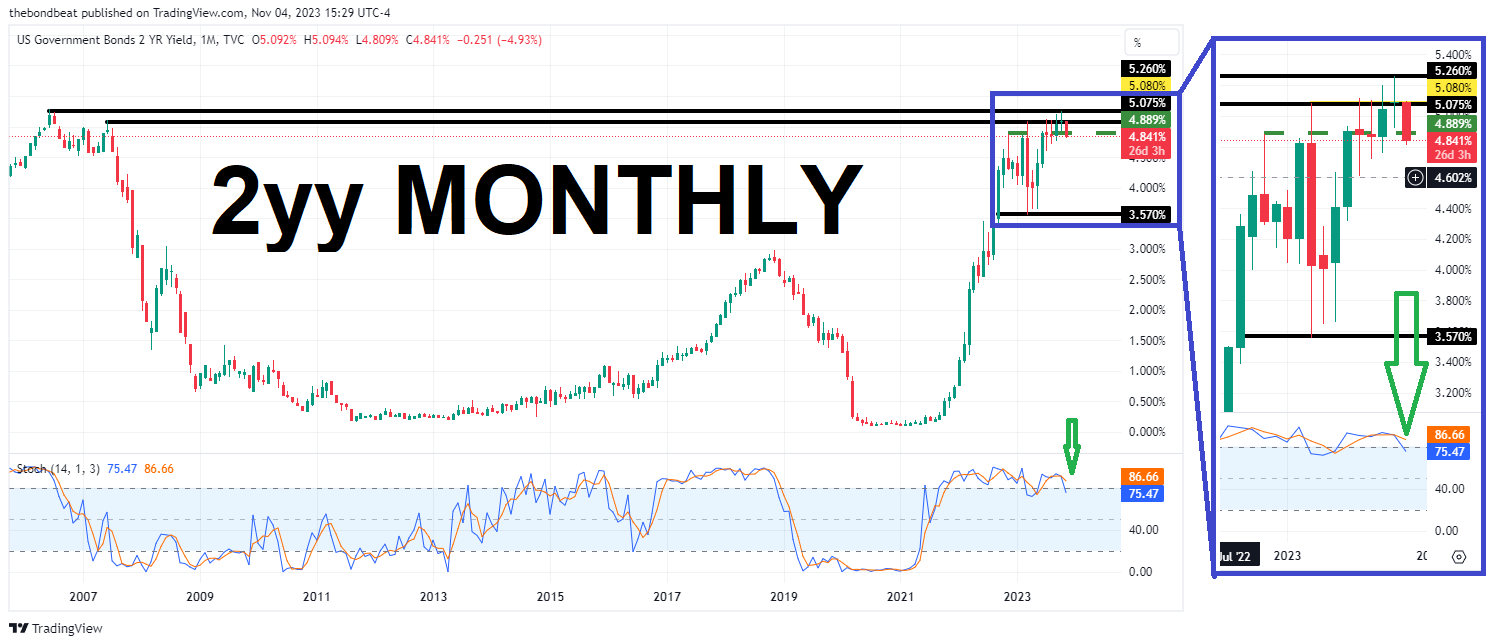
2yy DAILY — YES the chart looks OK BUT … we’ve moved about 40bps lower since 19 OCT and have now become overBOUGHT …
AND so, zooming out and looking at bigger picture, a monthly — you can see that momentum only recently crossed bullishly and 40bps lower may just be tip of the iceberg …
See what ever you’d like and i’d only ask IF you … #Got2s ?
Ok and I’d be remiss NOT to pass along updated BBG story on DRUCK
Bloomberg- Druckenmiller Digs In on Criticism of Yellen, Disputes Her Math
… It began with a critique of Yellen that her department had made “the biggest blunder in history” by not taking advantage of near-zero interest rates to sell more longer-term bonds. Then, Yellen pushed back at the criticism Thursday, saying the Treasury was pushing out maturities to the longest in decades. And on Friday, Druckenmiller weighed in again, saying the Treasury’s computations omitted critical borrowing on the Federal Reserve’s balance sheet.
“The only debt that is relevant to the US taxpayer is consolidated US government debt,” Druckenmiller said in an interview. “I am surprised that the Treasury secretary has chosen to exclude $8 trillion on the Fed balance sheet that is paying overnight rates in the repo market. In determining policy, it makes no sense for Treasury to exclude it from their calculations.”
The dispute pits two of the highest-profile names in US financial circles: Druckenmiller, 70, is a former investor for George Soros who now runs his Duquesne family office, while Yellen, 77, is an economist and former Federal Reserve chair and a pillar of the Biden administration’s relationship with Wall Street.
Ironically, the backdrop for their exchanges has been a period of huge moves down in interest rates, with yields on 10-year Treasuries headed for their biggest weekly decline since March. On Wednesday, the Treasury’s quarterly refunding plan showed a smaller increase than investors expected, spurring hope that a glut of government debt would soon abate.
The Druckenmiller-Yellen tit-for-tat began last week with a video clip in which Druckenmiller, speaking in an interview with hedge fund manager Paul Tudor Jones at a conference, leveled his accusation about a missed opportunity to lower debt costs. Yellen’s riposte came in a CNN interview.
“I disagree with that assessment,” she told the network. The agency has been pushing out the average maturity of its bond portfolio and “in fact, at present, the duration of the portfolio is about the longest it has been in decades.” …
Which ever side YOU agree with I believe we can all agree that Drucks TRADE — and so, putting his money where his mouth is — means HEs winning.
Now … in as far as NFP goes …
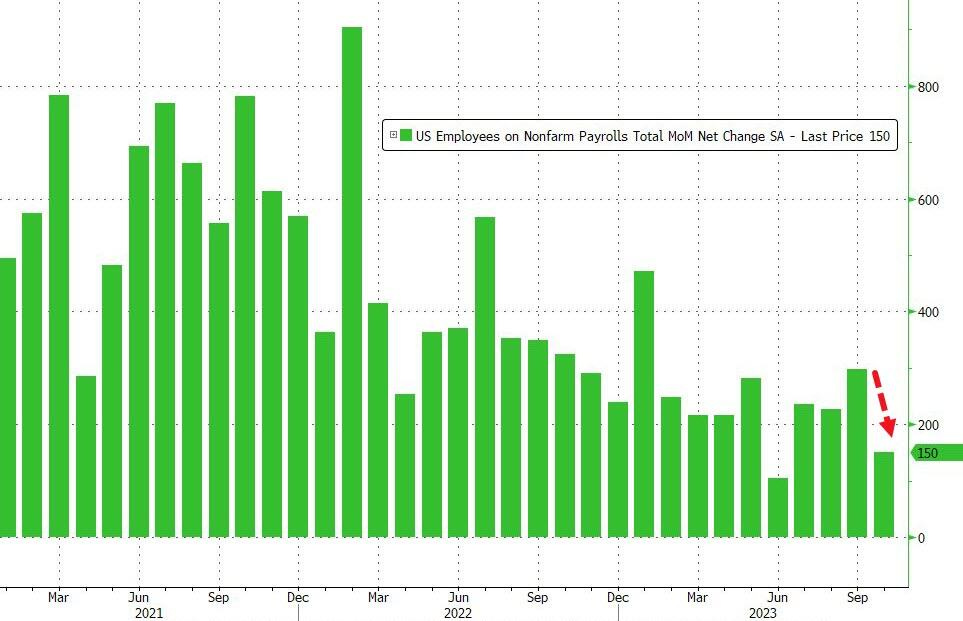
Bonddad Blog - October jobs report: more deceleration, in the weakest report (except for June’s) since March 2021
ZH: Jobs Come Crashing Down: October Payrolls Up Only 150K, Missing Estimates And Follow More Downward Revisions
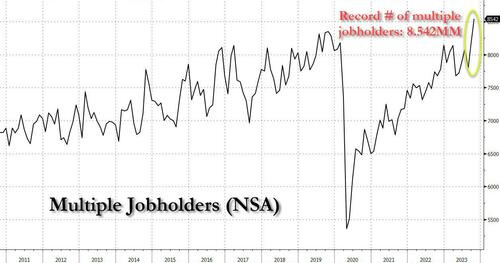
ZH: Record Number Of Multiple Jobholders: A Closer Looks Inside The Horrific October Jobs Report
… 7. Record number of multiple jobholders. While the is still adding jobs at a brisk clip, that doesn't mean that the number of people finding jobs is similar. Quite the opposite: as the next chart shows, under the Biden administration increasingly more people have been forced to take on two or more jobs to make ends meet. In fact, in October, the (not seasonally adjusted) number of multiple jobholders was a record high 8.5 million, a surge of 396K in one month.
MORE BELOW and I’ll move on AND right TO the reason many / most are here … some WEEKLY NARRATIVES … some of THE VIEWS you might be able to use … THIS WEEKEND I’d note a couple / few things which stood out to ME this weekend … The sellside is all over the place with some booking profit 10s30s steepeners others taking the money and running OUT of 5yy LONGS while still OTHERS gettin' short 2s and long 10s … read on …
BMO- Employment Disappoints; 4.50% 10s on Radar BMO weekly, “Dear 5%, Thanks for the Memories” (booked profit 10s/30s steepener and get short 2s into further bid DB- Commitment of Traders: Weekly Update (fuel for the bond bid / fire?)
JPM- UST Market Daily (11/02): Take profits on 5-year Treasury longs
… We take profits in our tactical 5-year Treasury longs: the market is now pricing in a more dovish path for the Fed and Treasuries no longer appear significantly cheap relative to their drivers.
30-year bond bulls gain traction with the break through 4.925-4.95% tactical pattern resistance. The next area to watch is at the 4.75% Sep-Oct trend line, then key confluence of levels at 4.60-4.665%. That includes the Sep-Oct yield lows and 50-day moving average. In our view, a move through that area would confirm a medium-term bullish trend reversal and likely bring in more rally momentum …
Rosenberg Research - Bonds About to (Finally) Have More Fun!(CHARTS, charts and more charts — many in cartoon form !! — from one of the legends of Global Wall St…note Rosie passing along sage words of wisdom in form of Bob Farrell’s 10 Market Rules to Remember … )
… INFLATION HAS ONLY FALLEN THIS FAR, THIS FAST, FIVE TIMES IN THE PAST 70 YEARS!
… RECORD HIGH RATIO OF STOCK -TO -BOND RETURNS
THE MIRROR IMAGE OF MARCH 2009 …
StateStreet- Are bonds really back? What the data says
Moving along and away FROM highly sought after and often paywalled and Global Wall Street narratives TO a few other things widely available and maybe as useful from the WWW
A soft payrolls report, across the board - October payrolls came in weaker than expected at 150k vs 180k consensus, net revisions subtracted 101k from previous months, while unemployment rose one tenth to 3.9%. While part of the weakness in the October report was due to temporary effects of the United Auto Workers union strikes (this subtracted around 30k jobs), the most important for us was the significant downward revisions which suggests the September blowout jobs report was an aberration (as we had suspected at the time, and as discussed in our October Monthly). Today’s data is more consistent with the longer term cooling trend in the labour market, as well as other labour market indicators such as continuing jobless claims, which resumed their rising trend over the past month or so.
Apollo - Households More Worried About Their Retirement (NOT a 60/40 portfolio visual like the ones I used to use / pass around from The Terminal but you get the point…)
The 60/40 portfolio continues to underperform, and households are getting more worried about their retirement, see chart below.
Bloomberg (via ZH) - Stock-Bond Ratio's Fall Shouldn't Last As US Skirts Recession (ZH had just ahead of NFP but not sure WHEN it hit Terminal and don’t really care … as it speaks complimentary TO the note from Apollo just above…)
Authored by Simon White, Bloomberg macro strategist,
It’s been a bit of a bonanza for financial assets in recent days, with both stocks and bonds putting in a good performance.
Treasury’s decision to skew issuance away from longer maturities relative to expectations triggered a rally in bonds. Stocks joined in, buoyed by lower yields, and we saw the side of positive stock-bond correlation that multi-asset investors like.
Bonds, though, had the upper hand, and the stock-bond ratio fell.
That’s normally reflective of a weakening economy. But there are good reasons to think it won’t last.
While the economy is likely to show some signs of weakening in the near term, leading data shows a recession should be narrowly avoided. The stock-bond ratio should then soon resume its rise.
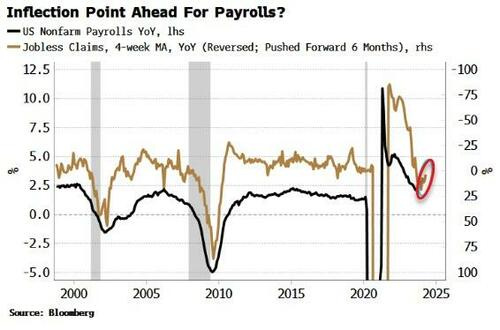
Take payrolls today. Month-to-month data is very noisy (expectations are for 180k change in October versus 336k last month), but its annual growth-rate has been steadily falling all cycle.
Jobless claims, however, give a three-to-six month lead on payrolls and their recent stabilization points to payrolls also stabilizing early next year. Other leading data, such as the Conference Board’s Leading Index, confirm this anticipated trend.
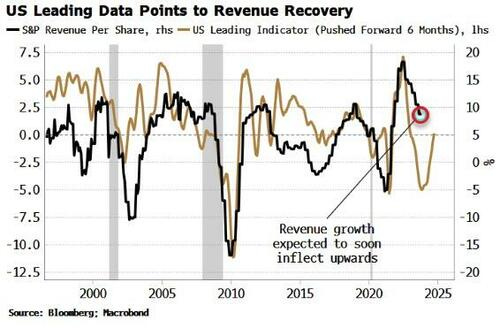
Apple’s results late Thursday showed a fall in sales for the fourth quarter in a row, the longest slowdown since 2001. S&P revenue growth overall has been dropping, and this will form a building headwind for stocks – returns are currently being driven by sales and multiple expansion.
But here again the future looks more positive than the present indicates, and leading data shows that revenue growth should soon inflect and start turning back up.
The stock-bond ratio generally tracks the inverse of the unemployment rate – i.e. when unemployment rises, the ratio falls. It’s therefore likely to face some more resistance in the near term, but if a recession is avoided as leading data anticipate, it will resume its upwards trend.
Commonwealth - What Mattered This Week? Economy Slows, Markets Cheer (yer very much standard fare run of the mill — bad is good — here)
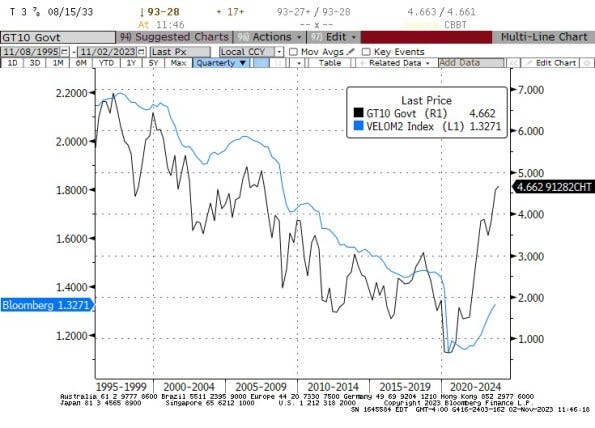
… And here is the problem. If interest rates are back at 2007 levels, then naïvely we would expect velocity to be back in the vicinity of 2007 levels also. But that is massively higher than the current level. In 2007, money velocity was around 1.98 or so: about 49% higher than the current level!
Needless to say, there’s no way the money supply is contracting that much. If velocity rose even, say, 30% then we would have a serious and long-lasting inflation problem. Fortunately, because of the economic policy uncertainty and other non-interest rate effects (I did say that “naïvely” we would be looking for 1.98, right?), the eventual rise in velocity beyond the snap-back level is much less than that.
FirstTrust- Nonfarm Payrolls Increased 150,000 in October (never missing opportunity to throw in M2 reference…)
…As inflation has declined, so have increases in pay. For October, average hourly earnings were up 4.1% from a year ago, versus the year-overyear gain of 4.9% last year, in October 2022. Lurking in the background of recent trends in the labor market is that the M2 measure of the money supply is down versus a year ago, the yield curve is inverted and likely to remain so, and short-term interest rates are relatively attractive. This is a recipe for risk aversion among businesses in the year ahead and a reduction in business investment will likely lead the rest of the economy into recession. The labor market is often a lagging indicator and we expect the economy (real output) to noticeably weaken before employers stop hiring, on net. Expect continued job growth for the next few months, but a weakening and recessionary labor market is heading our way.
Hedgopia- CoT: Peek Into Future Through Futures, How Hedge Funds Are Positioned (MORE SHORTS in week ending this PAST TUES and so fuel for the bond buying fire / frenzy?)
ING- Soft US jobs report reinforces the message that the Fed’s work is done
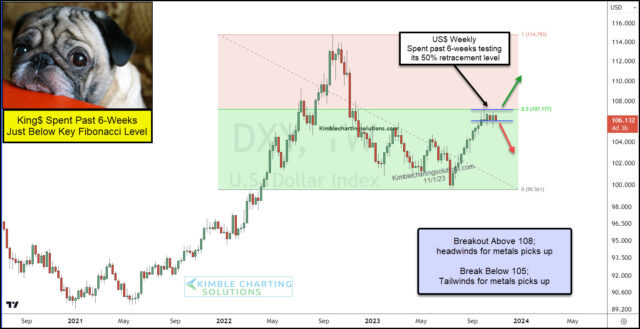
Kimble- US Dollar Ready For Next Move; Commodities and Equities Watching! (i’d only add that RATES are watching too OR perhaps it is the USD watching RATES … but then again, this is HIS — Chris’s narrative not mine …)
LPL- Call it a Comeback (me like technicals and so…)
Key Takeaways:
Oversold conditions and tumbling interest rates have brought buyers back into equity markets this week. The S&P 500 has recaptured its closely watched 200-day moving average (dma).
Historically, index returns following a move back above the 200-dma have yielded positive but underwhelming returns, suggesting crossovers should be used more as a confirmation of trend than a binary trading signal.
Seasonal tailwinds could keep this recovery moving forward. The S&P 500 has generated an average return of 7.0% from November through April, marking the best six-month return period for the market since 1950.
While the comeback in stocks this week has been constructive, there is more technical work to do before considering that the correction is complete. Specifically, we are watching for the S&P 500 to clear resistance at 4,400, for market breadth to expand, and for 10-year yields to reverse their current uptrend.
… S&P 500 Recaptures its 200-dma
RBC - Tight U.S. labour markets continued to ease in October
StockCharts.com - An Incredible Stock Market Rally Closes the Week on a Strong Note: The Best Week This Year, So Far
WolfST- Manufacturing Jobs Hit by Strikes. Job Growth Still Decent. We Look at Part-Time Jobs (Plunged), Self-Employment, and Multiple Jobholders
… Multiple job holders as percent of all workers, at 5.2% in October, was where they had been in October 2019, both of them historically relatively low: In the 1990s it was over 6%. The chart shows the three-month-moving average:
WolfST- Which Industries Lost Jobs, Which Gained Jobs? Longer-Term Employment Trends in Charts by Segment
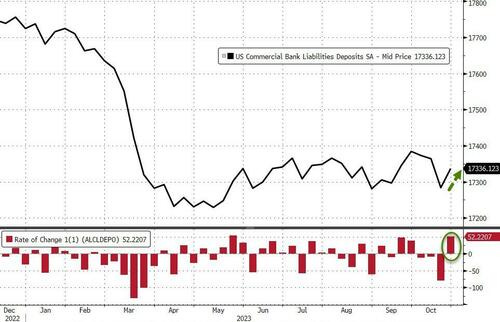
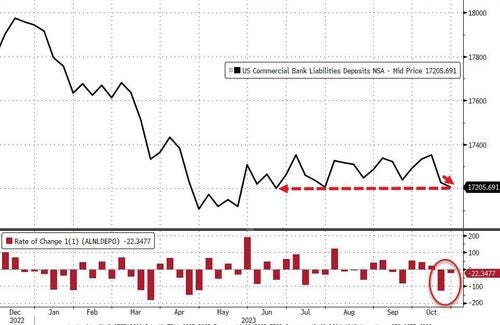
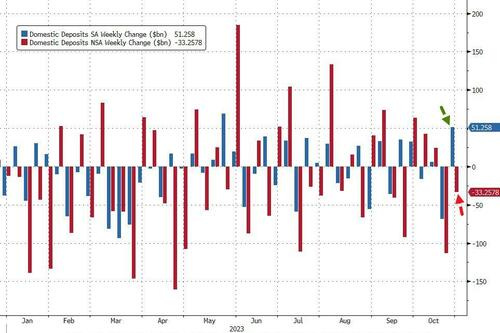
ZH: Fed F**kery Turns Massive $33BN Bank Deposit Outflow Into $51BN Inflow
… So, what fun and games will The Fed do this week to 'adjust' the data so we don't panic about a sudden bank run?
On a seasonally-adjusted basis, total bank deposits rose by $52.2BN...
Source: Bloomberg
However, total bank deposits - unadjusted - fell by $22.3BN to its lowest since June...
Source: Bloomberg
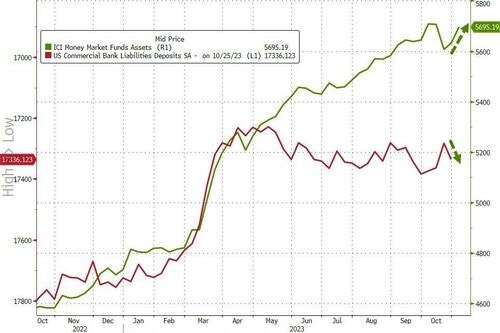
And just when we thought some sens of reality was kicking in, bank deposits and money-market fund assets diverge once again...
Source: Bloomberg
Adjusting for foreign bank deposit flows, The Fed's magical 'adjustment stick' managed to turn $$33BN of outflows (NSA) into $51BN (SA) inflows...
… AND for any / all (still)interested in trying to plan your trades and trade your plans in / around FUNduhMENTALs, here are a couple economic calendars and LINKS I used when I was closer to and IN ‘the game’.
First, this from the best in the strategy biz is a LINKthru TO this calendar,


Outstanding article !!!
My vote is with Druck.....Yellen's dumb as $uck...(poetic) LOL !!!!
"one month doesn't make a trend", but Jumping on the Bandwagon sure is fun,
for the "Investment" Firms....
I do hope it is a trend, but Job Losses have their own downsides.
Incredible, the # of Multiple Job holders.....I thought so...
Gotta believe people still pulling funds from Banks and depositing in MM accounts..
One-way Flow....No Brainer....
Quotes: "Treasuries fun, again"......"5%, Thanks for the Memories"......PRICELESS !!!!!!