(USTs modestly higher w/belly leading and on strong volumes)while WE Slept; GVLQUSD (liquidity via Citi); Druckenmiller Says He Has ‘Massive’ Bullish Bets on 2-Year Notes (BBG)
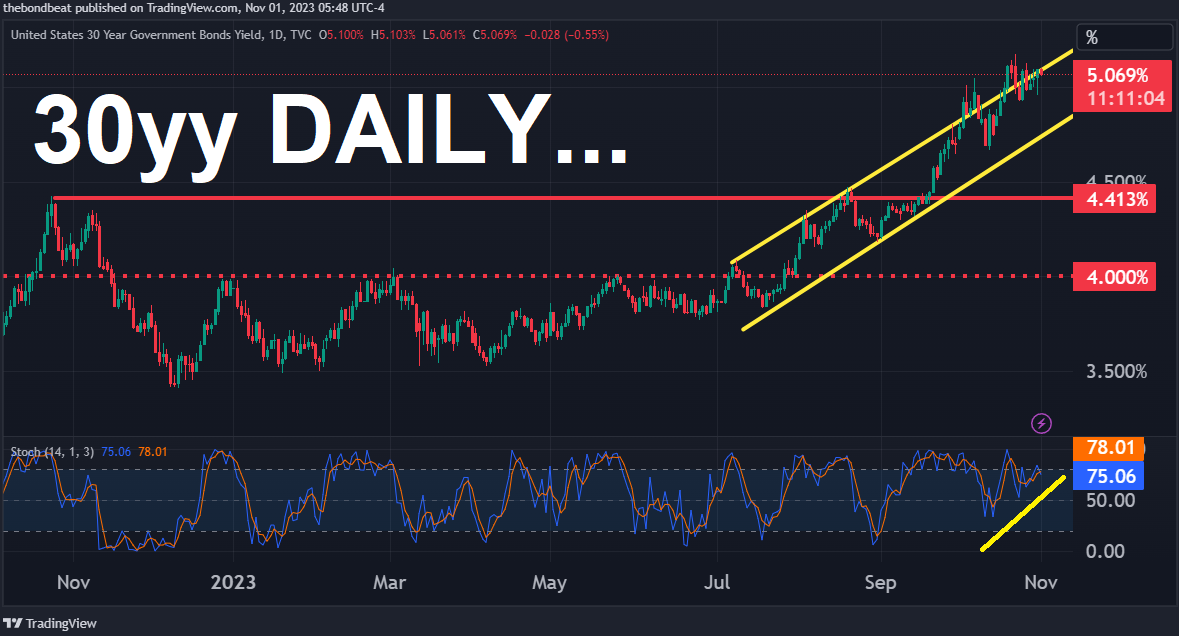
… and thankfully SHOCKOctober is at an end. You can see long bonds continue to hug trend in place which kicked off very nearly the last time (Aug) Yellen and Treasury had some sage words of oncoming supply. I’m certain, though, it’s only a coincidence and I’m connecting dots which aren’t really on the same page …
Moving along and speaking of ENDS, how ‘bout live look in at end of YCC over in Japan
Reuters: BOJ intervenes as JGB yields hit fresh decade highs after YCC tweak
October now fully in the rear view mirror and some of the data points yesterday MIGHT be worth noting …
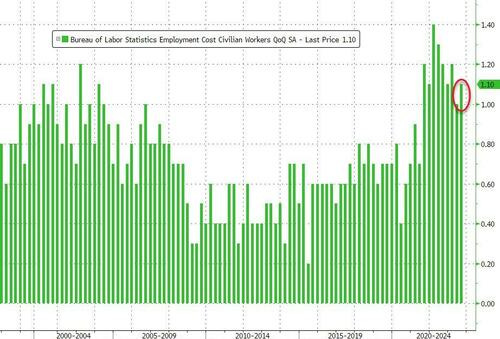
ZH: Yields Spike After Employment Costs Unexpectedly Re-Accelerate
… some other data points (confidence, Case Shiller) are fleshed out below BY the ever changing narrative machine on Global Wall Street … All this as another down month comes to a close …
the S&P 500 has fallen for three straight months that’s the longest monthly losing streak since March 2020 [May 2022 was a very slight gain]
… I like visuals but such short-termism attempt to CREATE the news by what I thought was a news person, well … this one falls flat on ME … apparently, though 3mo in a row has attention and so …
ZH: Stocks Spooked For 3rd Straight Month As WW3 Fears Spark Surge In USD, Gold, & Crypto (Not Oil)
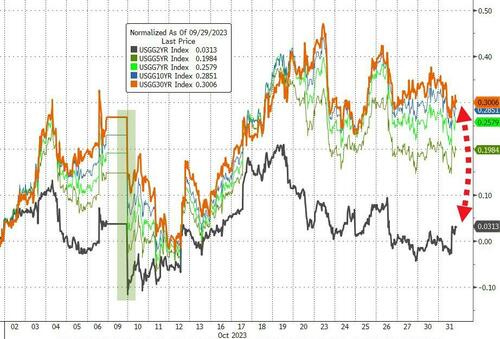
… The Long Bond rose over 30bps on the month - its 7th straight month of yield increases - but the short-end (2Y) was basically unchanged...
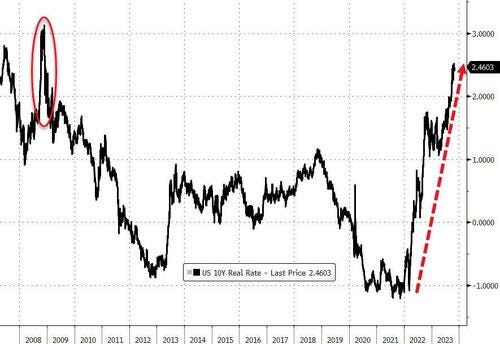
… Real yields (10Y) rose for the 6th month of the last 7 to their highest 'since Lehman' (Oct 2008)...
… with another down month in the books — see below for DBs monthly performance review excerpt (“…For the first time in the 21st century so far, US Treasuries lost ground for a 6th month running, with a -1.3% decline. That included a further rise in the 10yr yield of +36.0bps, and a rise in the 30yr yield of +39.4bps.”) just below — and all that jazz in mind, data holding up (for now anyways) what SOME of what the legends of Global Wall Street are saying / thinking here and now,
Bloomberg- Druckenmiller Says He Has ‘Massive’ Bullish Bets on 2-Year Notes
‘I started to get really nervous’ about the economy recently
He says he’s confident the yield curve will keep steepening
Billionaire investor Stan Druckenmiller said he’s bought “massive” bullish positions in two-year notes, as he’s become more worried about the economy.
In recent weeks, “I started to get really nervous,” Druckenmiller, founder of Duquesne Family Office, said in an interview with hedge fund manager Paul Tudor Jones at a conference last week. “So I bought massive leveraged positions” in the short-term notes, he said.
Druckenmiller has joined a number of prominent investors, including Bill Ackman and Bill Gross, in sounding the alarm about the economy lately. Ackman, founder of Pershing Square Capital Management, said this month that he’s unwound bearish bets on 30-year Treasuries, because “there is too much risk in the world.”
Unlike Ackman, Druckenmiller said he’s keeping bearish wagers on longer-term bonds because he’s concerned about swelling government-debt issuance. But with the new bullish bets on two-year notes, overall he is long fixed income for the first time since 2020, he said at a Robin Hood Foundation event in New York. A video of the interview surfaced on social media this week.
Druckenmiller, who managed money for George Soros for more than a decade, has been predicting a hard landing for the US economy for some time. He has said that corporate profits could fall by 20% to 30%, and that the value of commercial real estate will tumble.
In the interview with Tudor Jones, Druckenmiller said he’s observed anecdotal evidence that “on the margin, things are getting softer” as pandemic stimulus is “running down rapidly.” Historically, the simultaneous increases in interest rates, oil and the dollar have been negative for the economy, he added.
Steepener Bet
His paired long-short bond bets means that he’s expecting the yield curve to steepen, a move that typically happens when the Federal Reserve cuts interest rates. Yields on two-year Treasuries jumped to almost 5.3% this month, the highest in more than a decade, as investors absorbed Fed Chair Jerome Powell’s pledge to keep rates high for an extended period.
“Powell talks a good game, but let’s see what kind of game he’s talked about if the unemployment rate is 4.5% and going north,” he said. The rate was 3.8% in September.
If he’s right about the economy, Druckenmiller said two-year yields could fall to 3%, while 10-and 30-year yields remain at the current levels of roughly 5%.
“I am confident the yield curve will normalize,” he said. “That’s a trade I expect to have for some time.”
Druckenmiller said his call for recession hasn’t panned out because a lot of corporates and households are shielded from higher rates as they locked in lower borrowing costs in previous years. But as they move to refinance in the next two years, “you have to be open-minded about something breaking,” he said.
Treasury Critique
In the interview, Druckenmiller blasted Treasury Secretary Janet Yellen for not taking advantage of near-zero interest rates during the pandemic by selling more longer-term bonds, calling it “the biggest blunder in the history” of the department.
“When rates were practically zero, every Tom, Dick, Harry, and Mary in the United States refinanced their mortgage,” Druckenmiller said. “Unfortunately, we had one entity that did not, and that was the US Treasury.”
Druckenmiller reiterated his concern about the growing government-debt burden. If rates stay where they are, the government’s interest expense will amount to 7% of GDP by 2043 — equivalent to 144% of annual discretionary spending today, he said.
“The politicians that are telling you and think they’re not going to cut entitlements, it’s just an outright lie,” he said. “Honestly, I think the math has gone crazy.”
Druckenmiller has a net worth of $9.9 billion, according to the Bloomberg Billionaires Index.
He alone is worth nearly 10bb and NOT cuz he invented anything other than proof he’s got kehones to be in some popular and at other times, quite unpopular trades.
When you take the road less traveled and / or stick with said road levering up when appropriate and cutting and running at times needed, well …
$10b
And so, with HIS words in mind, perhaps another visual helping prove WHY he’s worth 10bb and I’m not.
Bloomberg Five Things You Need to Know to Start Your Day (ASIA)
… The US dollar’s climbing fresh heights, and that’s only partly due to its surge against Japan’s currency after the central bank on Tuesday disappointed yen bulls and Tokyo bond bears. The Federal Reserve remains the outstanding hawk in the field. It has the highest cash rate across developed economies outside New Zealand, it has sounded more determined than most to keep borrowing costs elevated, and it’s busy trimming its balance sheet.
That’s widened the gap between US two-year yields and the average for the rest of the Group of Seven major nations to 178 basis points — a surge of 65 basis points since it touched a nadir in May. The dollar has tracked very closely with that spread during the current tightening cycle, and there’s little reason to expect that dynamic to fade any time soon. Even if the Fed doesn’t raise its cash rate target again it has signaled a determination to keep it elevated for a lengthy spell. The US economy is showing more resilience than its peers, and economists forecast it will outpace them over 2023 and 2024.
… Maybe there’s more than just a love affair with 2s BUT perhaps he’s taking a myriad of other factors into consideration? Maybe? Nah, he’s worth 10bb just cuz, you know … luck. Timing of being born at the right place in history?
Anyways, he’s on CNBC NOW and my guess is THEY will keep this from public view and only for the pro subs … IF its avail, I’ll post here tomorrow and in meanwhile … here is a snapshot OF USTs as of 706a:
… HEREis what this shop says be behind the price action overnight…
… WHILE YOU SLEPT Treasuries are modestly higher with the belly outperforming on the back of headlines like those just above. DXY is higher (+0.15%) while front WTI futures are too (+1.6%, see attachments). Asian stocks were mixed to higher (NKY +2.4%), Eu and UK share markets are mixed while ES futures are showing -0.35% here at 6:55am. Our overnight US rates flows were unavailable at publishing time with overnight Treasury volume ~110% of average overall with some elevated turnover seen again in 30yrs (144%) and in 5yrs (132%)…
… our first attachment this morning shows that, by at least one measure, Treasury market illiquidity is roughly as poor today as it was at its worst in 2020. Bloomberg's US government securities liquidity index (GVLQUSD) measures the average yield error based off an intraday RV curve fit. The idea being that today's average yield error is as high as it was a year ago (some seasonality maybe?) or back in 2020 near its peak error... What's strange to this observer is that I don't hear the same complaints about liquidity from the desk today as I heard back in 2020. Moreover, many of the recent Treasury trading sessions have seen well below average volumes (investor disengagement hardly surprising ahead of this week's events/uncertainties) so investor de-risking ahead of this Big Week may be playing a role here. But one thing is very clear and it's that Bloomberg's Treasury liquidity measure has shot higher (worse liquidity) since ~October 13th so maybe something to keep an eye on as it relates to QT and all that?
… and for some MORE of the news you can use » The Morning Hark - 1 Nov 2023 and IGMs Press Picks (who CONTINUES to be sportin’ that new, fresh look) in effort to to help weed thru the noise (some of which can be found over here at Finviz).
Moving from some of the news to some of THE VIEWS you might be able to use… here’s SOME of what Global Wall St is sayin’ …
ABNAmro- Eurozone disinflation well on its way (ECBs #WINNING)
Two key economic reports published in the eurozone today, are indicating that disinflation is well on its way. To begin with, HICP inflation fell to 2.9% in October, down from 4.3% in September and next, GDP contracted by 0.1% qoq in Q3.
Barclays - September ECI shows firmer wage trajectory (trying to figure how this works with rate cut bets … anyone?)
ECI estimates place overall labor compensation growth at 1.1% over the three-month period ended in September, and at 1.0% for the private sector. The latter is a fair bit firmer than the 0.8% increase in hourly earnings over the same period, confirming that recent payroll survey estimates are overstating wage deceleration.
Barclays - House prices show no signs of cooling in August (great if an owner of said asset class, bummer if yer trying to be an owner … )
Both the FHFA and S&P CoreLogic CS 20-City measures of house prices posted gains in August, rising 0.6% m/m and 1.01% m/m, respectively. Both indexes have now surpassed their July 2022 peaks and are showing no sign of slowing.
Barclays - October consumer confidence shows three months of declines (think maybe housing and rates anything to do with it?)
The Conference Board's index of consumer confidence decreased in October, due to increased pessimism about the present situation and future expectations. Confidence has now fallen in the past three months, highlighted by declines across categories in October.
BloombergBNP - US October jobs preview: Hot streak extension will not sway Fed
KEY MESSAGES
Robust Q3 growth likely promoted a healthy pace of hiring in October. However, we view strong economic performance over the summer as a temporary spike in a decelerating trend, and in turn see hiring slowing from a strong 336k in September to (a still solid) 190k in October.
The United Auto Workers (UAW) strike will likely shave around 25k off of job growth, though the impact may be slightly larger accounting for ancillary layoffs. Lost jobs should be regained in November as the strike has ended.
Job growth has been resilient, but gains in labor income have decelerated. An extension of this trend would push y/y growth in aggregate income below the pre-Covid run rate of 5% in coming months, after stripping out weak base effects from a year ago. We expect the unemployment rate to remain unchanged at 3.8%.
BNP- Eurozone: Mild contraction, slowing inflation (can we celebrate their / ECB victories as well as any we have today and on into the future?)
Key Messages
Recent GDP and inflation data make us more confident that the ECB has reached the terminal rate of its hiking cycle.
While GDP slightly contracted against our expectation of a flat print, the data beneath the surface appear more resilient. We still characterise the current environment as stagnation.
Headline inflation showed more improvement than expected. While core pressures eased in line with our forecast, they remain too high, suggesting that the ECB is still a long way from cutting rates.
DB- October 2023 Performance Review (um…USTs could have done worse?)
… That ongoing data resilience meant that US Treasuries continued to lose ground in October. For instance, the 10yr yield rose for a 6th consecutive month to close at 4.93%, and it even briefly surpassed the 5% mark at one point for the first time since 2007. Furthermore, there are several signs that this rise in longer-term borrowing costs has been filtering through to the real economy, with data from the Mortgage Bankers Association showing that the average rate on a 30yr fixed mortgage is now up to 7.9% in the week ending October 20, which is the highest since 2000.
With rates continuing to rise, we also saw fresh losses for equities in October, and the S&P 500 was down -2.1% in total return terms. That’s the 3rd consecutive monthly decline for the S&P 500, which is the first time we’ve seen 3 consecutive declines since March 2020. For reference, the only time since the GFC we’ve seen a run of more than 3 monthly declines for the S&P was in mid-2011, when the index lost ground for 5 consecutive months amidst the Euro Crisis and the US debt ceiling crisis…
… Which assets saw the biggest losses in October? US Treasuries: For the first time in the 21st century so far, US Treasuries lost ground for a 6th month running, with a -1.3% decline. That included a further rise in the 10yr yield of +36.0bps, and a rise in the 30yr yield of +39.4bps.
DB - 10y yield: cycle, neutral, and premium ( seems to ME to offer a defense of higher (nominal)yields ahead ... thoughts?)
A key question on the rates sell-off over recent months is the extent to which it reflects reassessment of the Fed policy cycle, a shift up in views of the long-run neutral rate, or higher term premia. Today’s COTD uses the Kim-Wright (KW) term structure model to shed light on this, focusing on the 10y point.
… A few notable things emerge from this breakdown. First, it indicates that around 60% of the increase in the 10y yield since the start of Q3 is in term premium (grey), with the remainder in neutral rate expectations (light blue). (The ACM model attributes the full rise to term premium.) Second, it suggests long-run nominal neutral is currently around 4.5%, and so, assuming the Fed is seen as credible in returning inflation to target, the yield curve already reflects an expected r-star of 2.5%. (ACM puts expected neutral in a similar range.) Third, Fed cycle expectations are close to zero; that is, the expected average short-term rate over the next 10 years is very close to neutral. And fourth, despite having moved up over recent months, the 10y term premium is still low by historical standards (also true of ACM). In our view, elevated inflation uncertainty, unfavorable bond-equity correlations, and high and rising UST supply all argue for further increases in premia.
Model decomposition puts expectations for long-run nominal neutral at 4.5%, with the 10y term premium still near historically low levels
DB- Re: sentiments (interesting look at BOTH sides of a single coin as with trading, for every buyer there has to be a seller — check me but I think that is even pre Gartman rules of trading :) )
A year ago we noted an historically unprecedented gap between consumer and business confidence across advanced economies (Figure 1). In our view this was largely driven by a sharp decline in real wages, shifting much of the inflationary burden onto consumers (Figure 2). Indeed, when real wages bottomed out in rich economies around the turn of the year, we immediately observed some convergence in consumer and business confidence…
… with real wages now growing again, the historical relationship would suggest that households will be more chipper than businesses by the end of the year. While rebounding consumer confidence would be good for aggregate demand, it may still come at the expense of deteriorating animal spirits in the corporate sector, where high (re)financing costs for the foreseeable future now need to be juggled with growing real labour costs.
MS- Figuring Out Fiscal Policy (hmmm so takeaway here is to be BULLISH bonds cuz FISCAL authorities bearish / supply related (?) impulse will fade at least until 2024 elections? with this bullish 3-6mo view I’m guessing we’ll see an addition of a LONG BIAS in some way / shape / form this coming weekend **IF** FOMC and data as well as this mornings supply announcement cooperate?)
Fiscal expansion is often cited as a reason for positive US growth surprises & government bond yield increases in 2023. Yet, we assess that expansion has peaked, at least until after the 2024 election. Hence, investors focused on upside catalysts for growth & yields should look elsewhere.
… Key takeaway: If you're seeking upside risks to growth & yields, focus your attention elsewhere. More plausible ways that US growth could continue cut against our expectations and show strength include a higher r* in the short run driven by more momentum in consumption and business investment. Given our assessment that the rates market continues to price in a more hawkish Fed reaction function, such developments would also cut against our expectations for Treasury yields to decline from here. Conversely, the absence of these conditions, in concert with this evidence that fiscal support is peaking, underscores our view that yields should decline over the next 3-6 months.
UBS - ECI decelerates further in Q3 (Fed #WINNING … so we’re all winning, but less? you know, in a decelerating fashion?)
UBS- Case Shiller gains speed, but consumer confidence dims (2-handed economism 101 … see the good or the bad — whatever you’d like)
… Conference Board Consumer Confidence drops moderately to five-month low The Conference Board consumer confidence index declined to 102.6 in October from an upwardly revised 104.3 in September. However, it was a slightly brighter reading than called for by consensus estimates (100.5). The index is at its second-lowest level in 2023, landing just above May's print of 102.5. The survey's gauge of expected inflation picked up, and respondents' fears of a recession occurring in the next 12 months remained elevated.
UBS(Donovan) - Fictional prices, Floridian prices, and the Fed (?)
The Federal Reserve meets, with no plausible justification for a rate increase. Slowing price and wage inflation mean that real interest rates continue to rise. A growing economy normally requires liquidity growth, but quantitative tightening is withdrawing liquidity.
US inflation is only above target because of fictional and Floridian prices. Transitory durable goods inflation is clearly over—the last positive durable goods inflation rate was in November 2022. Energy is not adding to inflation the way it was before. Profit-led inflation is under pressure from cost-conscious consumers. Fears of a fourth wave—of wage inflation—are not supported by the data. Only public sector wages are trending positively, and public sector wages do not generate cost-push inflation.
The US ISM manufacturing sentiment poll is due. This has failed to get manufacturing activity right all this year. Part of the problem with unofficial survey evidence is that there is rarely any detail as to survey reliability (e.g., response rates).
A day after the Bank of Japan suggested 10-year yields should be “about” 1%, it has intervened to keep 10-year yields below 1%. The country’s Ministry of Finance showed that there was no foreign exchange intervention last month, but said it was on “standby” to intervene.
UBS- UBS BoJ call updated: still expect end of NIRP in April 2024 (another call marked to market…)
… What do we expect from here? After today's policy decision and Ueda's message, we basically maintain our BoJ call; we continue to expect April 2024 for the end of NIRP and April 2025 for the end of YCC (the current policy framework of QQE with YCC). More specifically, we expect the BoJ to raise the short-term policy rate (overnight rate for interest rate for the Policy-Rate Balances in current accounts held by financial institutions at the Bank) from the current -0.1% to 0.0% in April 2024, followed by a 25bp hike in July.
… We thus believe the BoJ will need to see hard data on Spring wage negotiation outcomes. And the first hard data of the outcome will be available from Rengo, the federation of labour unions, in mid-March. Also, board members will present FY2026 CPI projections in the April Outlook report for the first time and we think many of them are likely to project 2%. We think the government is likely to officially declare the end of deflation when the BoJ ends NIRP …
… After that, with the UBS house view on the US recession and the Fed's rate cuts in middle of 2024, we think the BoJ is likely to pause until the end of FY2024 (March 2025). The BoJ's rate hike is likely to resume in April 2025 and reach 1.0% at end of 2025 with three 25bp hikes in April, July, and October.
On the YCC, we expect two hikes of the long term policy rate in April 2024 from the current roughly 0% to 0.5% and in July to 0.75%, while the 10yr effective upper end (currently around 1% and likely to be raised to 1.5% in April 2024) will likely be maintained for a smooth exit from the extraordinary policy at the beginning of the process. Further tweaks of YCC cannot be ruled out, but that probably depends on the US yield …
Wells Fargo - Q3 ECI: Labor Cost Growth Slowing Gradually (which should we emphasize .. GROWTH or slowing … askin’ for a friend)
Summary
The 1.1% rise in the Employment Cost Index in Q3 was a touch stronger than expected but showed labor cost pressures continue to slowly ease on trend. With the ECI still running north of 4%, labor cost growth remains too high to be consistent with the Fed's 2% inflation target. However, with demand and supply for labor gradually coming back into balance, we expect growth in compensation costs to slow further ahead, with the recent moderation enough to keep the Fed from additional rate increases.
Wells Fargo - Rebound in Confidence May be Witch-ful Thinking
Summary
Consumers remain downbeat on the economy and its prospects. Confidence slipped for the third straight month and recent events suggest a rebound isn't in the offing.
Yardeni- Will Powell Sound More Dovish On Wednesday? (with answer disclosed in first bit of the sentence, fact that bulk of the note behind paywall is, well, what it is)
The short answer is: We doubt it. It's unlikely that his views on the economy and monetary policy have changed much since his hawkish interview on October 19 at the Economic Club of New York. So he is likely to maintain the same tone at his presser on Wednesday following the latest FOMC meeting. The message should remain the same. Monetary policy will have to remain restrictive until inflation falls closer to the Fed's 2.0% target.
Powell and his colleagues have been expecting that their tightening would cool the labor market. Today's data suggest it remains hot. Consider the following:
(1) Employment Cost Index. Q3's Employment Cost Index continued to moderate during the quarter but at a slower pace than during the previous few quarters. It was down to 4.3% y/y with wages & salaries and benefits up 4.5% and 3.9% (chart). Powell has said that he would like to see wage inflation measures closer to 3.0%. He figures that would be consistent with 2.0% price inflation if productivity is growing about 1.0%. We think that productivity is growing faster than that.
… And from Global Wall Street inbox TO the WWW,
Bloomberg- Ball For Higher US Yields Is Back In Treasury's Court (sounds like Simon read the DRUCK story?)
By Simon White, Bloomberg Markets Live reporter and strategist
Yields and risk assets face rising risks from the Treasury Department’s borrowing report Wednesday.
The BOJ’s underwhelming move today has taken some of the pressure off global rates, with US 10-year yields lower on the session. That puts the ball back in Treasury’s court on whether yields resume their upwards trend this week, with the remainder of its quarterly refunding announcement on Wednesday.
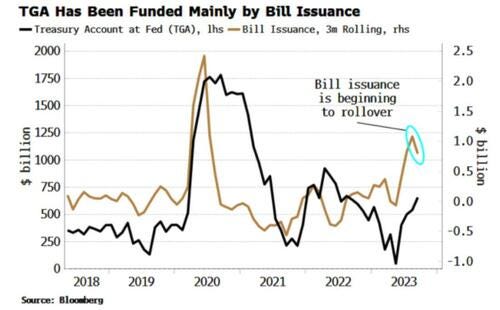
We got their borrowing estimates on Monday. The total was lower than expected, but it is still the largest amount borrowed in the fourth quarter. However, it’s the split between bills and bonds (by bonds here I mean all debt more than one-year maturity) that has the most significant near-term implications for liquidity and longer-term yields.
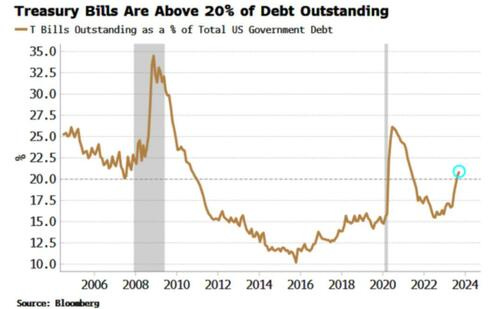
Issuance has been skewed towards bills this year, which has limited the liquidity impact on risk assets as money market funds (MMFs) have been able to absorb them by using inert liquidity already parked in the reverse repo (RRP) facility at the Fed. But bills are now over 20% of total debt outstanding, normally towards the higher end of where the Treasury prefers it.
The Treasury has stated it will remain above 20% for now, but it will gradually skew issuance away from bills. MMFs cannot directly buy longer-term debt, so the buying will shift to higher-velocity holders of reserves, e.g. households. This will extract liquidity from of the system, leaving stocks and other risk assets more vulnerable.
The Treasury’s account at the Fed (the TGA) will be increasingly pivotal here. Treasury aims for this to be $750 billion at the end of 4Q and 1Q (it’s ~$850 billion at the moment). Currently it is de facto backed by bill issuance.
But if its size is maintained as the Treasury expects and issuance moves away from bills, or the RRP becomes too low, then it will be increasingly backed by longer-term debt that will deplete higher-velocity reserves and pose a serious headwind for risk assets.
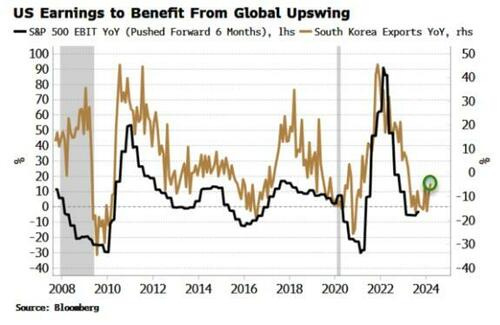
Bloomberg- Year-End Stock Rally Rests On Liquidity & Earnings
Authored by Simon White, Bloomberg macro strategist,
A recovery in US stocks into year-end hinges on whether an expected strong upswing in earnings growth will be enough to counteract a weakening technical and liquidity backdrop.
Information is surprise. This was a concept formulated by Claude Shannon in his groundbreaking Information Theory, the foundation of digital computing. The true content of information comes not from what is expected, but from what is unexpected. Nowhere is this more valid than in markets, which have their most outsized moves when there are surprises.
They can be endogenous and exogenous, and naturally a rapid escalation in the conflict in the Middle East would represent a negative surprise of the latter type for the market. But if we focus on endogenous surprises, then there is potentially a sizable positive one in the pipeline in the shape of US earnings.
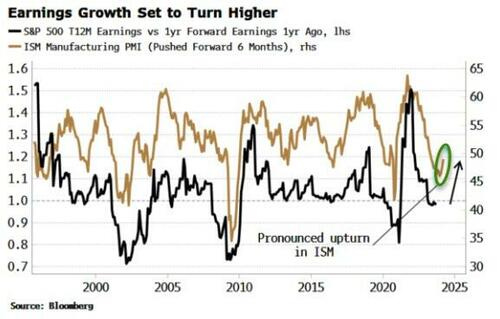
That’s signaled by multiple leading indicators, which are pointing to an increasingly pronounced and protracted recovery in large-cap earnings growth, which fell to flat from an annual rate of more than 50% last year.
First, there is the manufacturing ISM, which has been persistently rising all summer. This points to earnings surprising to the upside in the coming months, with trailing earnings beginning to outperform forward ones.
The manufacturing ISM crops up all over the place in macro analysis because it’s one of the best standalone leading indicators for global stock markets and the economy.
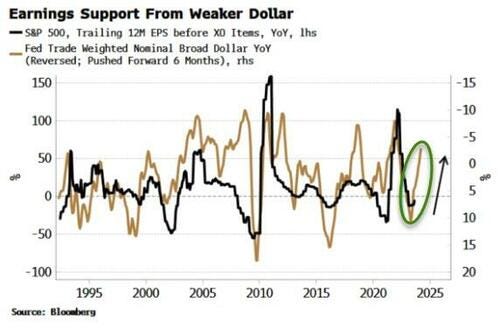
Tailwinds for earnings are also in the pipeline from a weaker dollar. It has strengthened in recent months, but economy-market relationships operate with lags. The lagged impact from the weaker dollar since last year is unlikely to have had its full positive impact on US earnings yet.
There should be more where this came from as the dollar is likely to re-establish its weakening trend based on leading indicators for the currency.
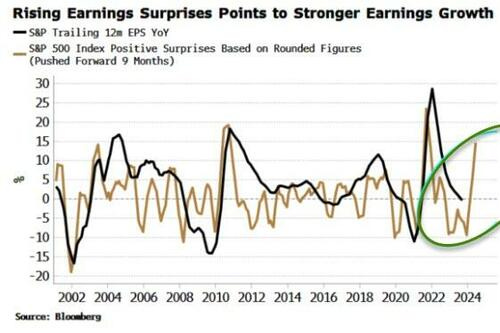
More companies have already been positively surprising on their earnings, which also points to stronger profit growth. We’ll get more color on this as another raft of US companies announce their 3Q earnings this week.
Additionally, there are increasing signs that the US may avoid a recession and global growth will experience an upturn. The exports of small, open economies are reliable leading indicators for the world economy. South Korean exports look to have bottomed and started turning up, which typically leads to a rise in the earnings growth of large-cap US companies.
A rise in earnings, though, is not a shoo-in for higher prices. The P/E ratio at least needs to remain steady. Leading indicators are pointing in that direction just now, but a re-acceleration in inflation, which I expect at some point next year, will eventually be a negative for P/E ratios.
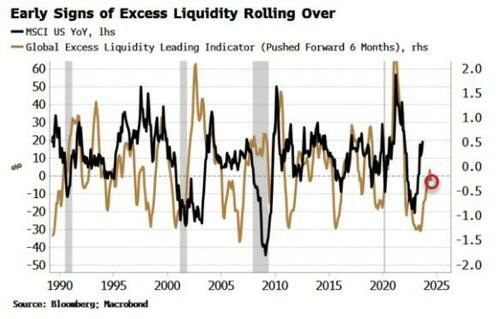
But before that, liquidity is a burgeoning risk for stocks. First, there is excess liquidity, the difference between real-money growth and economic growth. Rising excess liquidity has been a key tailwind for risk assets this year, but it’s showing the first signs of rolling over. If that gathers momentum, then what has been a positive for stocks will morph into a headwind, counteracting in whole or in part the tailwind from an upswing in earnings.
Liquidity will also be affected by the decisions of the Treasury, as the size of the fiscal deficit increasingly shifts the US toward fiscal dominance, where government borrowing and spending decisions overwhelm monetary policy.
As important as the amount Treasury borrows is how much its issuance is skewed toward bills. That’s been the case this year, which has meant money market funds (MMFs) have been able to absorb most of the new borrowing. MMFs have bought bills by drawing down on the RRP (reverse repo) facility, cushioning what would otherwise have been a large hit to liquidity.
Bills are now more than 20% of total UST debt outstanding, a level around where the Treasury has aimed to cap issuance in the past. A skew back toward bond issuance and away from bills is likely soon (confirmed by the Treasury) and is a non-trivial risk for the market as borrowing necessarily moves away from MMFs – holders of low-velocity reserves – to holders of high-velocity reserves such as US households.
The Marketable Borrowing Estimates released on Monday indicated a bond-bearish skew to expected issuance, but it’s on Wednesday with the recommending financing schedules we’ll get more information on the breakdown between bond and bill issuance.
To add to risks, the technical backdrop for the S&P is deteriorating. Along with several measures of breadth, one of the best – and simplest – guides to the medium-term trend of the market is on the threshold of turning negative.
The 13-26 week moving-average crossover for the S&P turned positive in February, about a month before the index bottomed and then began its rally. The crossover is very close to going back to negative-trend territory, when the market tends to struggle or sell off.
Earnings are poised to surprise strongly to the upside in the coming months. But it’s hard to be sure whether that will be enough to catalyze a strong year-end rally given the conflicting messages from technicals and liquidity.
All in, it’s difficult to disagree with Stanley Druckenmiller’s comments to Paul Tudor Jones at last week’s JP Morgan/Robin Hood conference: “It’s not exactly an environment that excites me about paying 20%-30% above the multiple for equity prices … I don’t find the equity market as a whole that interesting.”
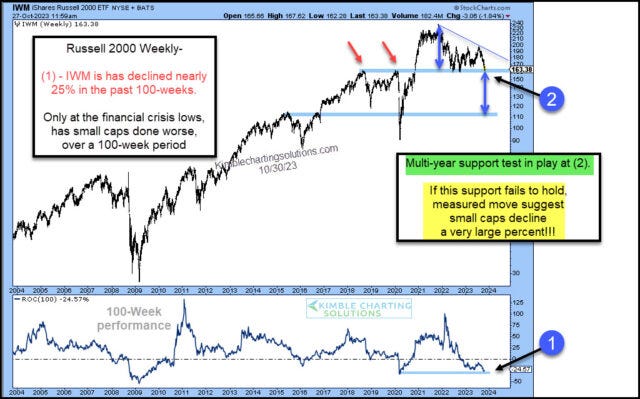
Kimble - Russell 2000 Testing Critical Price Support After Rare 100-Week Decline!
For first time since June 2022, large speculators’ net positioning in S&P 500 futures has edged up into positive territory
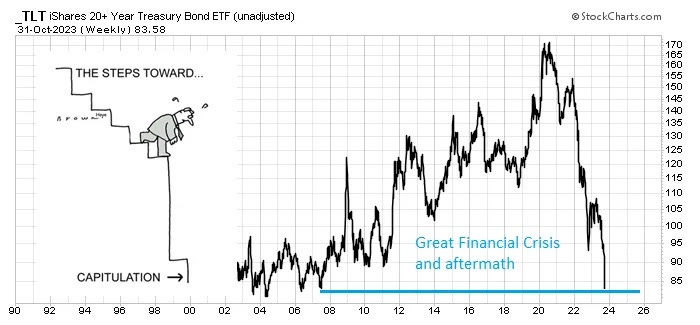
… AND if yer STILL with me after all this, a couple final graphics for those visual learners. FIRST, as a non professional who used to watch actual long bonds and futures for a living TO being relegated TO thinking about … TLT (so, 20s),
… AND in light of last nights big take
SICKOS indeed!! AND … THAT is all for now. Off to the day job…
I'm ALL about the Yellen Beat Down, but in all fairness have heard the same argument regarding the Trump admin-that they too should've issued longer duration debt. And the argument against was/is that the 10 yr would absolutely Blow Out Upwards.
PS-IF I was dumb & wealthy enough for Raiders season tix, they too would suffer the same fate as those Giants tix. But you'll always have The Big Tuna. At least we Raiders have the legacy of Madden, and Plunket. I mean, it could be worse, we could be Cardinals Fans Steve. LOL!


Wow...what a Fire Hose of Information !!!!
I guess the Treasury News could have been worse....
Billions of Bills....Crazy!!!!! What a way to fund a Gov't..
Saw Stan D. and Jeff G. today...Post Fed decision....Smart Guys...
Their consensus is that Rates must drop for several reasons...Slowing Economy and
that at current levels...it is unsustainable for funding our Gov't, etc....
Now waiting on the NFP report.....some day it will come in UNDER......
Outstanding work !!!!!!!!
I'm ALL about the Yellen Beat Down, but in all fairness have heard the same argument regarding the Trump admin-that they too should've issued longer duration debt. And the argument against was/is that the 10 yr would absolutely Blow Out Upwards.
PS-IF I was dumb & wealthy enough for Raiders season tix, they too would suffer the same fate as those Giants tix. But you'll always have The Big Tuna. At least we Raiders have the legacy of Madden, and Plunket. I mean, it could be worse, we could be Cardinals Fans Steve. LOL!