weekly observations (09.09.24): "Equipoise"? POSITIONS matter as specs net short FV, TY and equity flows "Choppy"; stay with steepeners. NFP recaps, victory laps...
Good morning / afternoon / evening - please choose whichever one which best describes when ever it may be that YOU are stumbling across this weekends note…
First, I’ll apologize for what follows is likely to be a bit longer than normal. This is in light of the week that just was including a completely decisive NFP report (?) and the ensuing commentary by a couple of FOMC VIPs (Williams and Wall-E comments in just a moment).
SO, as we look TO the week ahead, I would like to begin with a check in on a chart or two and see what, if any signals are to be gleaned ahead of this weeks UPCOMING (3y, 10y and long bond) AUCTIONS totaling 119bb
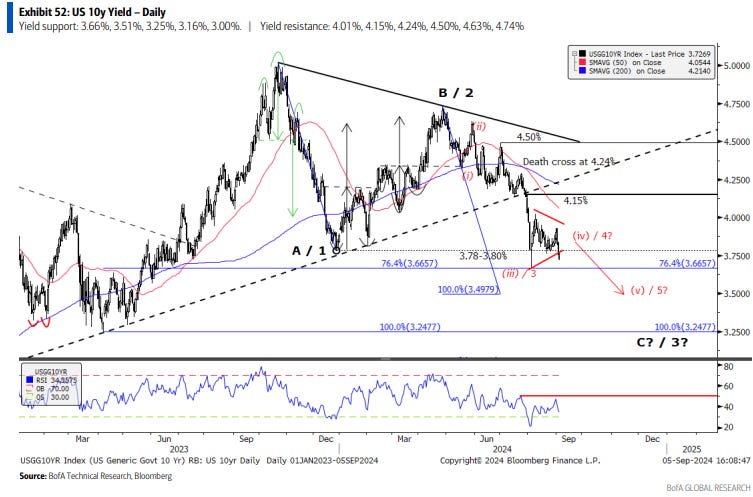
10yy WEEKLY: momentum overBOUGHT head of supply, watching 3.70
10yy DAILY: momentum overBOUGHT ahead of supply, watching 3.70
… and these are in concert with 10yy and 30yy MONTHLY CHARTS noted HERE earlier last week.
NOW, will supply continue to create its own demand? This remains to be seen BUT …
IF, as we all now know, thanks to the decisive NFP report (more below), the Fed can begin its rate cutting cycle, taking rates from restrictive down closer TO some estimate of R*, declaring soft landing victory along the way … well this remains to be seen.
IF they have to go above (or below) and beyond R*, you’ll know they’ve failed and have been forced to abort the easy does it mission and cut early and OFTEN because, well, things have in fact gone from bad to worse.…
Any idea which scenario will play out?
Asking for a friend…
NOW lets deal with a couple / few things items from the week just passed (in other words, a couple snarky ZH links which contain visuals and info graphics helping tell the tale of markets — INCLUDING rates — which you may / may not have already stumbled upon) … But FIRST, before we head TO the ZH …
… AND first, for somewhat more directly FROM Williams
FRBNY: Williams: ‘E’ Is for Equipoise
… The accumulated evidence has increased my confidence that inflation is moving sustainably toward 2 percent. The current restrictive stance of monetary policy has been effective in restoring balance to the economy and bringing inflation down. With the economy now in equipoise and inflation on a path to 2 percent, it is now appropriate to dial down the degree of restrictiveness in the stance of policy by reducing the target range for the federal funds rate. This is the natural next step in executing our strategy to achieve our dual mandate goals. Looking ahead, with inflation moving toward the target and the economy in balance, the stance of monetary policy can be moved to a more a neutral setting over time depending on the evolution of the data, the outlook, and the risks to achieving our objectives…
… For the whatever it’s worth, even AFTER GOOGLING the word, “Equipoise”, I’m no further along in my journey to be smart enough to use this one in a sentence … for the record, and in HIS OWN WORDS …
FRBNY … Since it’s back-to-school season, I’ll throw out another “e” word that you may find on a middle school vocabulary list. This word is a little less commonly used—at least in my own conversations. And that word is “equipoise.”
The definition, according to Merriam-Webster, is “a state of equilibrium.” If I were asked to use it in a sentence, spelling bee-style, I’d say: “The significant progress we have seen toward our objectives of price stability and maximum employment means that the risks to the two sides of our dual mandate have moved into equipoise.” …
… got it? okie dokie … Moving along then, there was this other guy looking up presumably TO determine where R* is now and to the heavens for help determining where rates are going …
Speech by Governor Waller on the economic outlook
… I believe our patience over the past 18 months has served us well. But the current batch of data no longer requires patience, it requires action…
… Determining the pace of rate cuts and ultimately the total reduction in the policy rate are decisions that lie in the future. As of today, I believe it is important to start the rate cutting process at our next meeting. If subsequent data show a significant deterioration in the labor market, the FOMC can act quickly and forcefully to adjust monetary policy. I am open-minded about the size and pace of cuts, which will be based on what the data tell us about the evolution of the economy, and not on any preconceived notion of how and when the Committee should act …
… And in the aftermath of the Waller speech …
ZH: Stocks Pump And Dump After Waller Advocates For "Front-Loading" Rate Cuts, But Timiraos Intervenes To Hawk Things Up
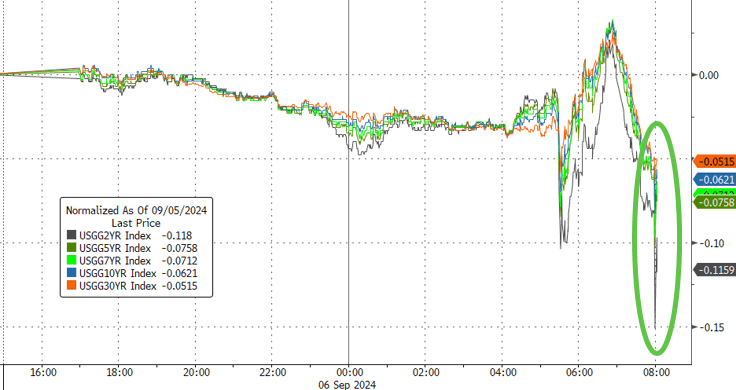
… The sharp, violent reversals in rate cut expectations this morning are shown below:
The result of this sequence was just as bizarre as the market reaction to the jobs report: while stocks initially jumped, they then immediately reversed all gains and have since sunk, dropping not just to session lows, but rapidly approaching the lowest level since the early August freakout...
… In any case, thanks to the surging negative dealer gamma, this morning the selling algos are clearly in control with the dollar plunging, yields sliding to fresh session lows...
… and from that we turn back TO the data which preceded these ‘official’ remarks …
ZH: June Payrolls Miss But Unemployment Rate Declines, Pulling Back From "Sahm Recession" Trigger As Wages Unexpectedly Rise
… So bottom line: the number could be better, but it is certainly not bad enough to trigger a 50bps rate cut in two weeks…
…And since the number of unemployed workers declined modestly, from 7.163MM to 7.115MM, the all important unemployment rate also dropped from 4.3% - which as we noted last month was that critical Sahm Rule recession trigger level - to 4.2%, matching estimates, and a level which according to most means the Fed will only cut 25bps in two weeks (as opposed to 50bps). Among the major worker groups, Black unemployment rate dropped to 6.1% in August from 6.3%, while the White jobless rate held at 3.8%. The Asian and Hispanic rates each climbed, to 4.1% and 5.5% respectively.
Among the unemployed, the number of people on temporary layoff declined by 190,000 to 872,000 in August, mostly offsetting an increase in the prior month. The number of permanent job losers was essentially unchanged at 1.7 million in August.
The number of long-term unemployed (those jobless for 27 weeks or more) was virtually unchanged at 1.5 million in August. The long-term unemployed accounted for 21.3 percent of all unemployed people.
The labor force participation rate remained at 62.7% in August and is little changed over the year. The employment-population ratio also was unchanged in August, at 60.0%, but is down by 0.4 percentage point over the year.
The number of people not in the labor force who currently want a job, at 5.6 million, changed little in August. These individuals were not counted as unemployed because they were not actively looking for work during the 4 weeks preceding the survey or were unavailable to take a job…
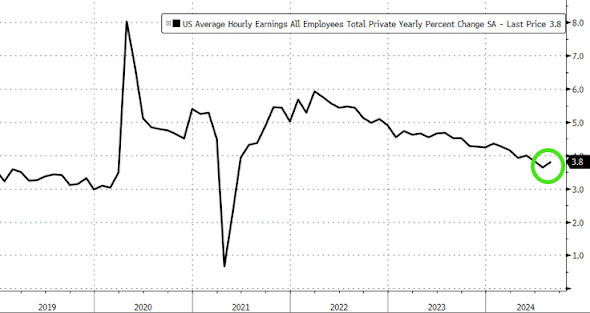
… As for wages, which a few months ago is all anyone cared about, these actually printed hotter than expected, rising 0.4% MoM, double the 0.2% increase last month. Average hourly earnings also rose to 3.8% YoY, up from 3.6% and beating the estimate of 3.7%. Was that it for the decline in earnings?
Indeed, for those focused on the ugly side of the jobs report - if only to justify a 50 bps rate cut - Bloomberg's Chris Anstey notes that "while many are focusing on the lower-than-expected payrolls figure, I’d note the direction of travel here for August isn’t down, it’s up"
Payroll growth accelerated in August.
Employment gains in the household survey also quickened.
The unemployment rate fell.
Wage gains accelerated.
Apollo’s Chief Economist Torsten Slok agreed, sasying that the data broadly show improvements over July figures: “This report is better than in July,” Slok says.“This economy is not slowing down in the way that markets are anticipating. We will not get eight cuts over the next 12 months.”
… In short, safe to say it will be 25bps (absent some upside shock in next week's CPI print which would crush the Fed's easing plans).
That about covers it for the key aspects of the jobs report. However, there is much more: looking below the surface reveals some truly catastrophic data: a surge in part-time jobs, a plunge in full-time jobs, and a record surge in foreign-born (most illegal immigrant) jobs offset by a collapse in native-born workers. Post coming up shortly...
ZH: Great Replacement Job Shock: 1.3 Million Native-Born Americans Just Lost Their Jobs, Replaced By 635,000 Immigrants
Bonddad: August jobs report: for the first time, including revisions, more consistent with a hard landing
CalculatedRISK: August Employment Report: 142 thousand Jobs, 4.2% Unemployment Rate
… Ok I’ll move on AND right TO the reason many / most are here … some WEEKLY NARRATIVES — SOME of THE VIEWS you might be able to use — and which Global Wall Street (and, on occasion, other 3rd party sources) are selling HOPING for street cred and / or FLOW … THIS WEEKEND, a few things stood out to ME from the inbox as Global Wall offered cursory NFP recaps and victory laps …
BAML Global Rates Weekly
NFPop QuizThe View: Buy the dip, don’t chase the rip
Ahead of today’s labor market print we are concerned that stretched positioning could drive a sell-off even if numbers are not quite as strong as our economists expect. Medium term we remain dip buyers in the US, are long EUR rates and bearish UK.Rates: NFPop Quiz
US: Short term we are tactically underweight into NFP data; cuts are well priced. Beyond Friday we favor buying dips; history suggests duration outperforms in cut cycles.…History lesson: trading the cutting cycle
…This month’s cut has been to some extent priced by the market since FF was at 3% (Exhibit 4).We have argued in the past that investors want to buy duration around the last rate hike of the cycle (see: Liquid Insight). This guidance has proven true historically, but timing has been very important. Since the Fed’s last hike in July ‘23, the 10y rate has rallied merely 10bps. Since the subsequent peak in 10y rates in October ’23, rates have rallied 120bps. The change from peak puts this cycle’s rally amongst some of the largest observed but buying three months before vs three months after the last hike made a large difference in this case.
While we continue to believe timing is important, history also tells us that there is more room for the rally to go (see: Trades for cutting cycle: a historical comparison). On average 10y rates have rallied 230bps from the timing of the first cut to the last cut of the cycle. We also historically see that most of the curve steepening is still ahead of us and occurs as cuts are delivered…
… Bottom line: Friday’s employment data will set the tone for Fed cuts & the rates outlook; Waller will make Fed intentions clear. Short term, we favor tactical underweights & flatteners into payrolls. Beyond Friday, we recommend clients buy rate dips. History says duration can outperform as the Fed launches cuts.
… Technicals: A make or break Friday. Still bullish/buy dip
Ahead of NFP, US10Y yield’s August consolidation is breaking to the downside. A miss pushes it lower now vs later; a beat creates an opportunity to buy in September.BARCAP August employment: Moderation, not deterioration
Nonfarm payroll growth increased to 142k alongside a moderation in the unemployment rate and a recovery in the workweek. Although employment growth continues to cool, we see little indication that a significant deterioration is underway. We maintain our call for three 25bp Fed rate cuts this year.
BARCAP Global Economics Weekly: Easing time has come
While the US jobs report did not bring final clarity on the size and pace of Fed cuts, it did, together with Fed speakers, cement the easing to start this month. We remain firmly in the 25bp camp. The ECB is also likely to cut 25bp next week, when the focus will also be on US CPI, China data, and the Trump-Harris debate.
…US Outlook
Following the path of totality
Labor market data provided mixed evidence of cooling, with the unemployment rate ticking down and payroll employment seemingly on a softer trajectory. FOMC communications point to a 25bp cut in September, and that the subsequent pace will depend on the "totality of the data", not just the unemployment rate.BARCAP Energy Sigma: This is it (or maybe not)
The oil sell-off has accelerated recently, growing the disconnect with spot fundamentals. Indeed, speculative positioning hit a new low this week, and while fundamentals could certainly deteriorate sharply, there is little hard evidence that this is the case so far.
… this one from just BEFORE NFP …
BCA: Cuts Are Coming, But At What Pace?
…Our bet is that without a recession the Fed will deliver less easing than what’s already priced, putting a floor under Treasury yields in the “soft landing” scenario. A bullish bond bet from today’s levels is a bet on US recession…
… and back to the aftermath …
BMO: NFP 142k, UNR 4.2%, 25/50 Debate Continues
… there is nothing within this report that strongly suggests the Fed needs to go 50 bp on the 18th -- leaving next week's core-CPI figure as the final input…
BMO US Rates Weekly: Counterpoint to Conviction
… The market’s response to Waller was a solid bid to the 2-year sector that brought the front-end benchmark <3.60%. However, the details of his prepared remarks were far less dovish than the headlines. He noted being “open-minded about the size and pace of rate cuts,” and the labor market is “continuing to soften but not deteriorate, and this judgement is important to our upcoming decision on monetary policy.” Yields retraced from the extremes initially triggered by Waller and as we consider the looming inflation data, it strikes us the verdict is still out regarding the size of the September move. It’s with this backdrop that we'll be focused on two key events in the coming sessions. First, the core-CPI update on Wednesday and second, the WSJ/Timiraos comments that are certain to follow. The former given it represents the final data point of relevance for the Committee’s rate decision….
… pausing to soak in a few things from best in the biz … 2s10s steepener tgt reached, profits booked ‘on a portion’ ahead of NFP, now tgt ~5bps AND given kneejerk reaction to NFP, entered short 2s at 3.65, tgt 3.75 w/stop below 3.55 … and so, without further adieu, back TO IT …
BNP US August jobs report: Labor market weakening still orderly
KEY MESSAGES
A rebound in August payrolls and a reversal from the prior month’s increase in the unemployment rate continue to speak against an unorderly deterioration in the labor market, supporting our view for a measured pace of Fed rate cuts over the remainder of 2024.
The details of the report, including sizable downward revisions to prior data, a pickup in layoffs and an increase in the number of people working part-time for economic reasons, echo the totality of recent releases showing continued softening in the labor market.
Following the August payrolls data and the latest comments from New York Fed President Williams and Fed Governor Waller, we are keeping our projection for a 25bp cut in September and a cumulative reduction of 75bp this year. But the bar has been set low for the Fed to deliver more cuts.
DB: Labor market: Not enough chill to heat up cuts in September
…Most importantly for the Fed, a reversal of July's spike in temporary layoffs confirmed that the rising unemployment rate is more a function of increasing labor supply, a signal consistent with this week's decline in jobless claims and historically low layoff rate in JOLTS. After the report, both New York Fed President Williams and Fed Governor Waller emphasized the importance of supply in contributing to labor market cooling. In short, while the payroll data were somewhat disappointing, the data did not rise to the "significant deterioration" Waller noted was needed for larger (50bp) rate cuts. We therefore continue to expect the Fed to cut by 25bps at the September 18 meeting, followed by two more 25bps cuts in November and December (see “Keeping the expansion alive with 75(bps) before '25”)…
DB: US Fixed Income Weekly
…Why banks are losing the fight on deposits
If banks' sole purpose is to grow deposits and make loans, they are finding it challenging in the current interest-rate environment. In Q2, U.S. banks lost $198bn in domestic deposits, according to an FDIC report this week. This deposit decline marks the seventh out of the last nine quarters since the Fed began raising rates in early 2022, reversing the temporary gains of the previous two quarters, when deposit growth briefly rebounded.Depositors continue to flock to money market funds where yields are substantially higher. We estimate that banks paid an average 3.10% on interest-bearing deposits in Q2, while most large money market funds offered yields north of 5%. Today's charts show that throughout the rate-hike cycle, the increase in bank deposit rates has significantly lagged behind the rise in the Fed funds rate, leading to a substantial gap between deposit rates and money market yields today. Bank deposit betas have always been low, but a major factor in this cycle has been the deeply inverted yield curve, with lower yields on loans and other assets putting persistent pressure on net interest margin.
Stagnant deposit growth means lower bank demand for Treasuries, particularly in the 1-5 year maturities, where banks hold an estimated 15% of the outstanding market. Indeed, banks were net sellers of Treasuries in Q2, with $7 billion in net selling, bringing their total reduction of Treasuries since Q2 2022 to $99 billion. Meanwhile, money market funds, the primary beneficiaries of the deposit migration, continue to see assets under management balloon. Some of the cash moving into money market funds has been reinvested at the Fed's ON RRP, keeping the facility's balance elevated. The debate over the steady-state RRP balances potentially clouds the outlook for Fed QT and its endpoint.
One silver lining is that with Fed rate cuts looking imminent, the yield curve has begun to steepen again. Fed rate cuts also reduce the attractiveness of money market funds as an alternative to bank deposits. Both of these should put banks in a better position to grow their deposits later this year. Higher-frequency data from the Fed's H.8 report suggests that bank deposits have likely stabilized since the end of Q2, and banks made small purchases of Treasuries in August…
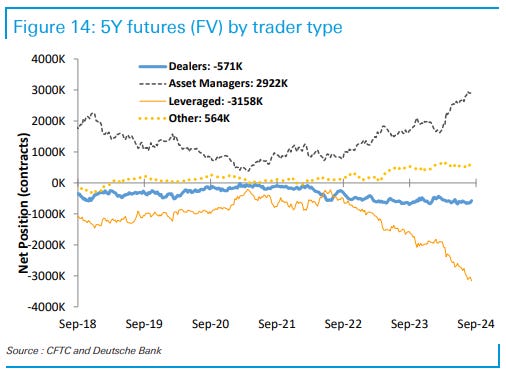
… THIS NEXT NOTE highlighting positions in 5s as it may / may not be of interest in as far as ‘BETTING MARKETS’ goes with regards to rate cuts coming…
DB: Commitment of Traders
… Speculators sold contracts in TY and FV, with their net short positions currently at second-highest level in both contracts…
DB: Investor Positioning and Flows
Choppy
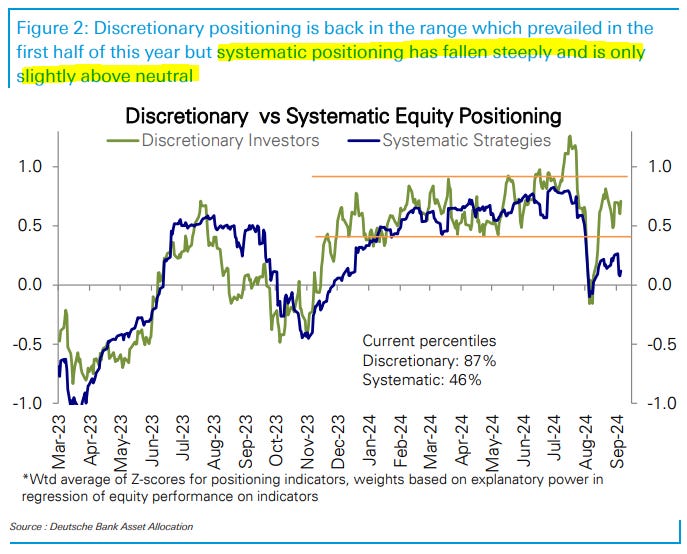
Our measure of aggregate equity positioning was choppy through the week but remained modestly above average (z score 0.37, 65th percentile). Under the surface, a small rise in discretionary investor positioning (z score 0.71, 87th percentile) was offset by a decline for systematic strategies (z score 0.12, 46th percentile). After the massive gyrations in August, discretionary positioning is back in the middle of the range that prevailed for the first half of this year. The resulting elevated volatility however has seen systematic strategies positioning falling to only slightly above neutral. Across sectors, positioning is now tilted towards the bond-like defensives with 3 of the 4 sectors above average being Utilities, Consumer Staples and Real Estate. Mega-cap growth and Tech positioning is still above average but continues to ease as it catches down to slowing earnings growth. The equity-bond yield correlation is now firmly back into positive territory as the market focus shifts away from inflation and towards growth concerns. Inflows to equity funds ($3.0bn) slowed sharply this week, those to bond funds ($9.5bn) moderated while inflows to money market funds ($60.8bn) ramped higher.ING: US payrolls fails to resolve the 25 or 50bp rate cut call
The US added fewer jobs than expected in August, but there was enough in the report to keep markets guessing on whether the Fed will cut by 25bp or 50bp on 18 September. Lead indicators suggest further weakness lies ahead, and we believe the Fed will go for a 50bp move, but it's a close call
…Are we losing the "good jobs"?
Moreover, the chart below does not look good. Full-time versus part-time employment is showing a big divergence, which tallies with the idea that the US is adding largely lower-paid, part-time jobs and is losing full-time, well-paid jobs, primarily through attrition - not replacing retiring or quitting workers. Every recession starts this way, unfortunately. The easiest way to cut costs is not to replace workers, but if everyone is doing that, then the economy slows, and companies start making actual cuts down the line.Full time versus part time employment YoY%
MS: Super Size Me | Global Macro Strategist
August payroll weakness increased investor desire to see a 50bp rate cut in September without equally increasing investor confidence that the Fed would deliver it. This combination – wanting more central bank accommodation than you're likely to get – rings negative for risk-taking sentiment…
…Interest Rate Strategy
In the US, we maintain UST 2s20s steepeners, and pay September FOMC OIS vs. receive November FOMC OIS……United States
We continue to suggest investors embrace yield curve steepeners, look for lower yields, and hedge against the possibility of a 50bp rate cut in November. Waller's comments place increased focus on data subsequent to the August employment report.We interpret these comments to mean the two employment reports between the September and November FOMC meetings – a unique feature of the 2024 data calendar. Usually, only one labor market report prints between these meetings.
… our economists started flagging downside risks, as did Fed Governor Waller who said, "I believe that the balance of risks is now weighted more toward downside risks to the FOMC's maximum-employment mandate" (see It's Friday … and you still have a job).
Exhibit 7 shows the private nonfarm payroll diffusion index, which looks at employment growth diffusion across 250 private sector industries over a 3-month span. At sub-50, the index aligns with the beginning of the 2001 and 2008 recessions.
If one or both of the next employment reports surprise to the downside dramatically, we expect investors to entertain the possibility of an inter-meeting cut, i.e., a rate cut delivered between the September and November meetings, in addition to a subsequent rate cut at the November meeting.
As such, we think the OIS rate spread between the September and November FOMC meetings could move more deeply negative than -50bp. This would also help the market-implied trough rate fall further – steepening the yield curve even more.
RBC: No signs of stopping in a gradually softening U.S. jobs market
…Bottom line: Although today’s much anticipated employment report doesn’t point to a sharp contraction in labour market, it also gave no indications that the broader cooling trend – which is not welcomed by the Federal Reserve – has in any way run its course. That's also against a jobs market that’s already looser than pre-pandemic. Growth in payroll employment has slowed, the number of permanent job losers is still edging higher slowly, and leading indicators, such as job openings, are still declining into July. Overall, we think that the Fed will start cutting interest rates in September, with risks tilting to more cuts after that than our current assumption for just one follow-up this year in December.
Wells Fargo: August Employment: Size of September Rate Cut Remains Unsettled
Summary
The August employment report indicated that while the jobs market is not unraveling, it continues to clearly weaken. Employers added 142K jobs in August, which was a bit less than expected, but came on the heels of another significant downward revision to prior months' hiring. Over the past three months, employers have added 116K jobs, a notable deceleration from the 207K average pace in the first half of the year. The breadth of hiring improved slightly over the month but continues to be concentrated in less-cyclically sensitive industries.The unemployment rate ticked down to 4.2% in August from 4.3%, offering some comfort that labor market conditions are not deteriorating in a non-linear way. However, joblessness has continued to rise on trend, with the Sahm Rule indicator, at 0.57, still above the threshold historically associated with recession. The rise in the broader U-6 measure of unemployment, which also captures under-employment, to a new cycle high demonstrates further signs of softening beyond the Employment Situation report's marquee nonfarm payroll numbers.
An especially strong or weak employment report could have crystallized the 25 or 50 bps rate cut debate for the FOMC's upcoming meeting. Instead, today's data have offered something for both the hawks and the doves on the Committee.
We have been projecting a 50 bps rate cut at the September FOMC meeting for the past month, and for now we are leaving that forecast unchanged. That said, neither outcome would surprise us at this point, and we will be listening to the remaining remarks from Fed officials before the black out period and waiting for Wednesday's CPI report for final clues. Regardless of what shakes out in September, we are confident that a series of rate cuts are coming in the months ahead. Any additional labor market cooling would be unwelcome for the FOMC, and as a result shifting the stance of monetary policy from restrictive to neutral over the next year or so remains our base case.
Wells Fargo: Weekly Economic & Financial Commentary
…Interest Rate Watch: Rate Cut at Sept. 18 FOMC Meeting: 25 bps or 50 bps?
… Regardless of the size of the rate cut at the upcoming meeting, we look for the FOMC to ease significantly in the coming months. The stance of monetary policy, which we measure by the real fed funds rate, is quite restrictive at present (chart). The “neutral” real rate is unobservable, but many analysts estimate it to be in the vicinity of 1% to 1-1/2%. With the real rate currently standing at 2-3/4%, the FOMC needs to cut the nominal fed funds rate considerably in coming months to get back to neutral. Otherwise, Federal Reserve policymakers risk driving the economy into recession with an overly tight stance of monetary policy. We currently look for the Committee to cut rates by 200 bps by mid-2025 (chart). We will update our forecast for the federal funds rate next week and plan to publish it in our U.S. Economic Outlook next Thursday …
… Moving along and away FROM highly sought after and often paywalled and Global Wall Street narratives TO a few other things widely available and maybe as useful from the WWW
AllStarCharts: Bonds Hit New Year-to-date Highs (created before NFP…)
…All the attention has been on the yield curve and how we're now officially getting back above the zero line.
This yield curve inversion has lasted longer than ever.
The "recession" was supposed to start when the yield curve originally inverted.
The "recession" was going to come any minute because the yield curve was inverted for so long.
The "recession" is now going to come because the yield curve is uninverting.
Imagine spending your time worrying about other people's recessions instead of your own personal gain in the market?
Recessions are a choice for many investors, especially the people who own almost all of the assets in the stock market.
And even if the recession wasn't a choice, and something we all have to live with, we know from history that price leads first, and then the economy follows.
So if your goal as a trader or investor is to profit from the market, then why would you spend any time at all thinking about the economy?
Apollo: This Is a Soft Landing
Looking at the incoming data, the facts are the following:
1. The unemployment rate declined in August, and looking at the establishment survey and the household survey, it is difficult to see strong signs of a slowdown in job creation, see chart 1.
2. Wage growth accelerated to 3.8% in August and wage growth remains sticky well above pre-pandemic levels, see chart 2.
3. Daily data for debit card transactions shows that consumer spending has been accelerating in recent weeks, driven by spending on clothing, food services and drinking places, sporting goods, and motor vehicle and parts dealers, see the following five charts.
4. Weekly data for retail sales went up last week and remains solid, see chart 8.
5. Jobless claims have declined for several weeks, see chart 9.
6. Continuing claims have declined for several weeks, see chart 10.
7. Default rates and weekly bankruptcy filings are trending down, see chart 11.
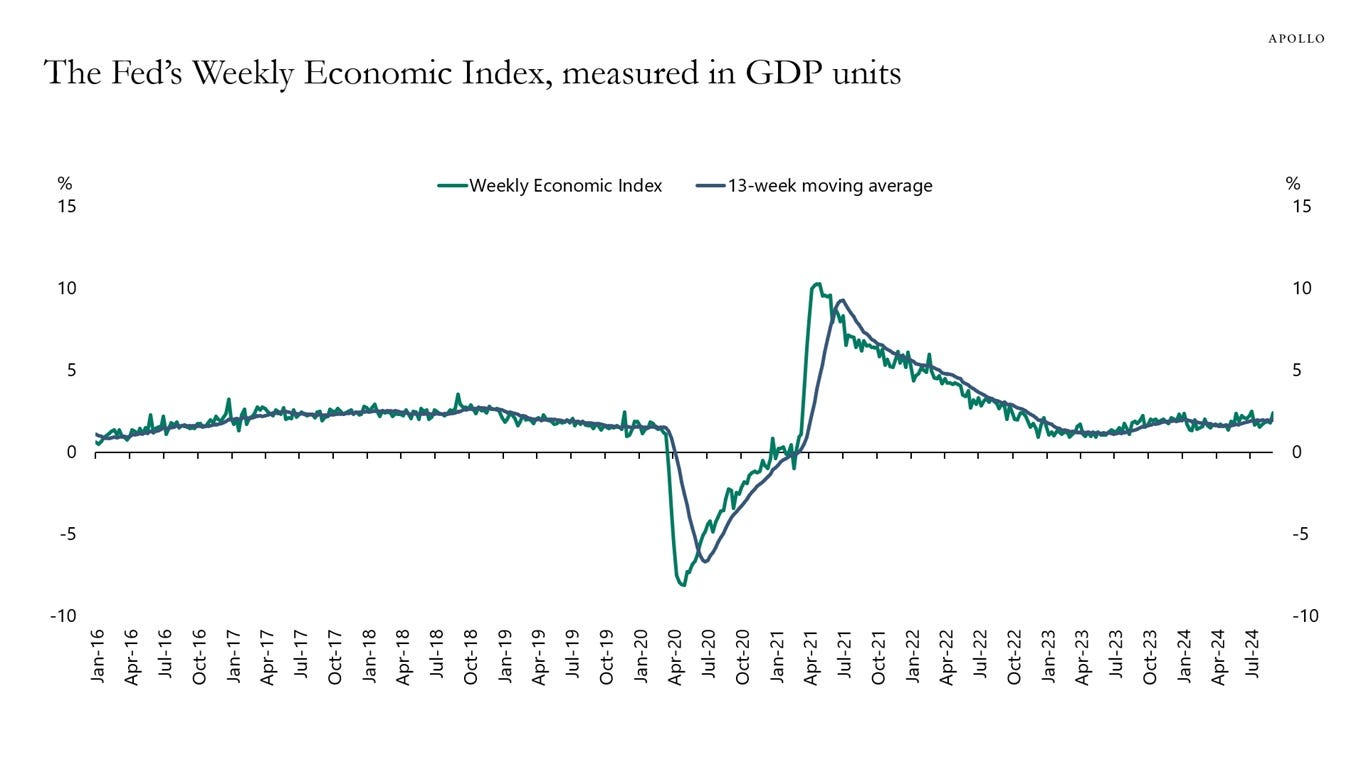
8. The Fed’s weekly GDP model suggests GDP is 2.4% and the Atlanta Fed GDP Now says GDP this quarter will be 2.1%, see charts 12 and 13.
9. Weekly data for S&P 500 forward profit margins shows that profit margins are near all-time high levels, see chart 14.
10. The stock price of staffing firms is rebounding, which suggests that we could get a rebound in job openings, see chart 15.
The bottom line is that the US economy is not in a recession, and there are no signs of a recession on the horizon. Our chart book with daily and weekly data is available here…
BESPOKE: Look on the bright side. September will eventually end.
BLOOMBERG:Fed Must Decide If Quarter-Point Cut Will Be Enough for Workers
Jobs report leaves investors uncertain about Fed’s next move
Officials set for a heated debate at upcoming policy meeting
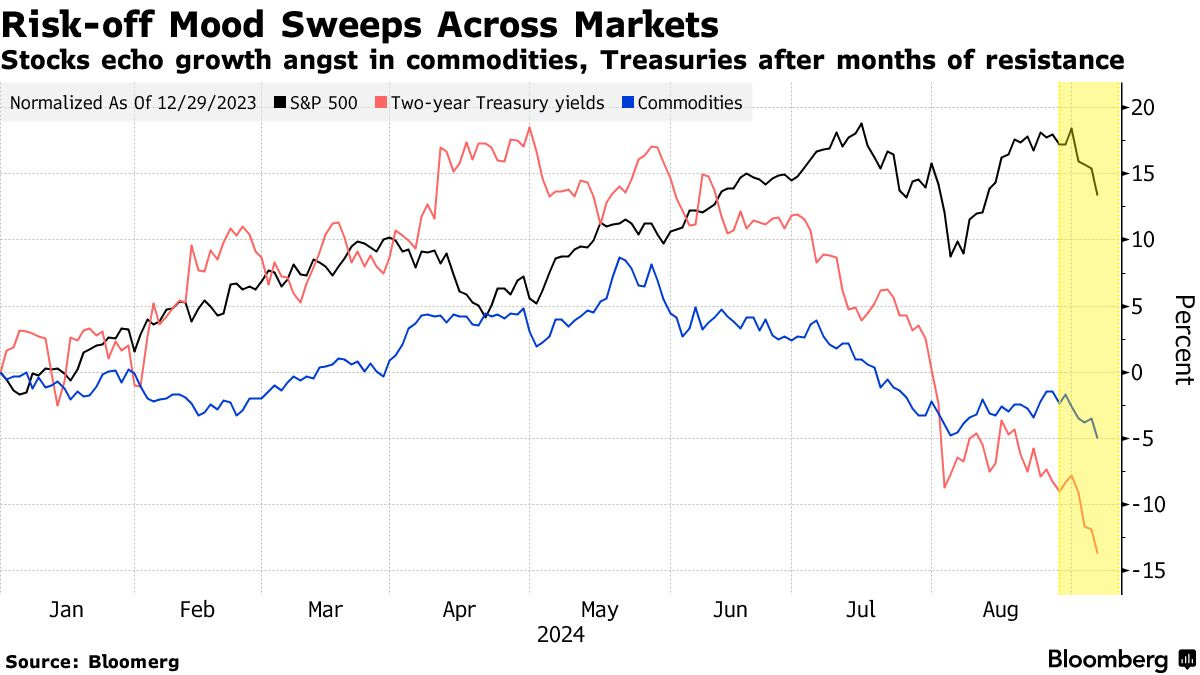
BLOOMBERG: Wall Street Traders Suddenly Converge on Economic Hazards Ahead
Stocks resume selling after decoupling from bonds, commodities
JPMorgan model shows a wide range of recession odds in assets
…“Investors may be waking up to the recession risk right now, but only after hitting the snooze button ten times,” said Michael O’Rourke, chief market strategist at JonesTrading. “The environment has only deteriorated when you consider both the economic data and the subsequent earnings reports.”
Crescat (via LinkedIN)
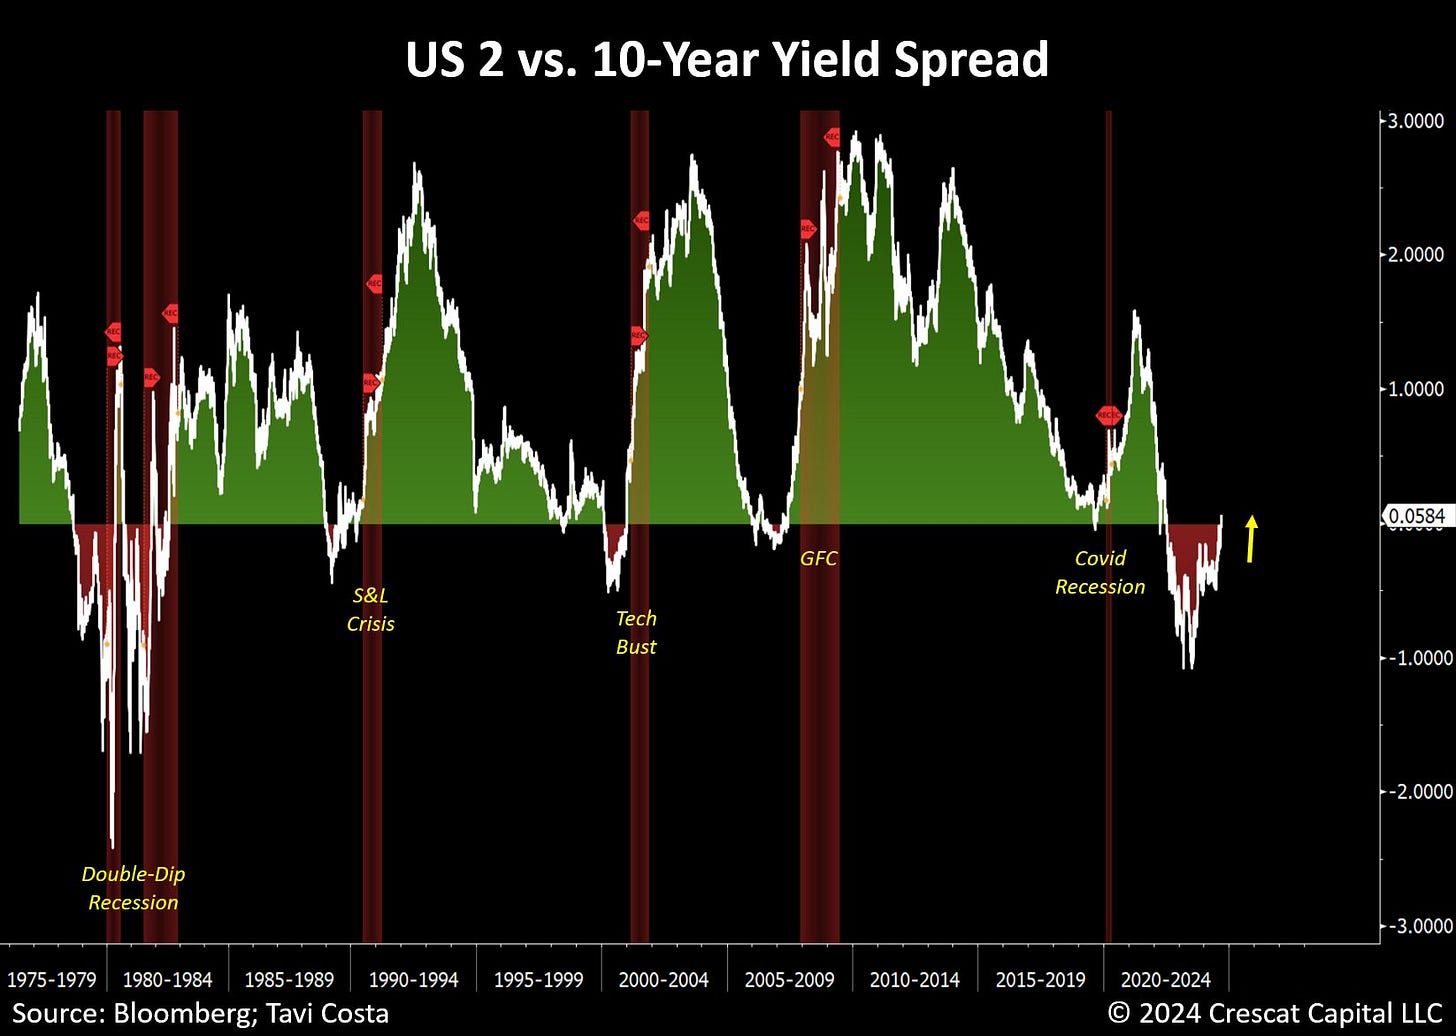
The 2 vs. 10-year yield spread turning positive this week is likely one of the most critical macro events we are experiencing.
Historically, these "un-inversions" tend to happen abruptly, and the current situation has been no different.
These types of macro setups occur only occasionally, and I believe the steepening of the US yield curve still has a long way to unfold.EPB Research: The True Pace of Job Creation (Chart of the Week)
… If we use the same method, averaging the revised nonfarm payroll data with the household employment data but using a 12-month average rather than a three-month average, we can see a very clear trend in the pace of job creation, down to 76,000 as of August.
Further, there was a sharp drop-off in job creation at the start of 2024.
The economy needs roughly 125,000 jobs per month to maintain a flat unemployment rate, and it’s becoming increasingly clear that the pace of job creation is insufficient.
This method shows average job creation of 321,000 in 2022, 179,000 in 2023, and 95,000 so far in 2024.
The problem for the Federal Reserve, which is now clearly behind the curve, is that this labor market softening will not magically stop, particularly because the Leading Employment Indicators have continued to slide, reaching a new low in August…
FRBNY: Failing Banks
Why do banks fail? We create a panel covering most commercial banks from 1865 through 2023 to study the history of failing banks in the United States. Failing banks are characterized by rising asset losses, deteriorating solvency, and an increasing reliance on expensive non-core funding. Commonalities across failing banks imply that failures are highly predictable using simple accounting metrics from publicly available financial statements. Predictability is high even in the absence of deposit insurance, when depositor runs were common. Bank-level fundamentals also forecast aggregate waves of bank failures during systemic banking crises. Altogether, our evidence suggests that the ultimate cause of bank failures and banking crises is almost always and everywhere a deterioration of bank fundamentals. Bank runs can be rejected as a plausible cause of failure for most failures in the history of the U.S. and are most commonly a consequence of imminent failure. Depositors tend to be slow to react to an increased risk of bank failure, even in the absence of deposit insurance.
Hedgopia CoT: Peek Into Future Through Futures, How Hedge Funds Are Positioned (because … SHORT positions matter and … here we go again??)
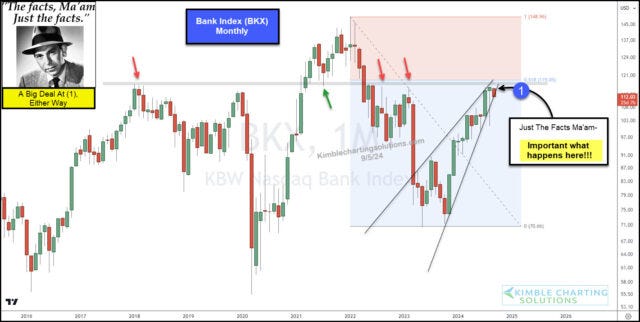
KIMBLE: Bank Stocks Will Be In Big Trouble If Support Breaks, Says Joe Friday!
NORDEA: Macro & Markets: Time to normalize, not panic
Yahoo: The jobs report answered one key question — but left us guessing on another
… The definitive update came Friday morning with the much-anticipated August jobs report, the gold standard for measuring the labor market. And it was anything but definitive.
As our Chart of the Week shows, it only answered one of the two key questions markets have been asking.
The first is whether the labor market, which was coming in for a landing a little too hot in July, is crashing. It’s not. After July's Sahm rule-triggering unemployment rate of 4.3%, August's data shows the plane coming out of its turbulent mini-dive and flattening back out with a 4.2% print.
To keep with the standard aviation metaphor, economist reactions note that hope for a soft landing is very much still alive.
WolfST: The Fed Has Room to Cut, Rates Are High Relative to Inflation, and Job Growth Could Use some Juicing Up
Job growth bounces back some, hourly earnings jump, unemployment dips, but job growth is too slow to absorb the massive influx of immigrants.
ZH: Payrolls - Treasuries 'Torched' Or 'Goldilocks' Crushing The 'Pre-Emptive Recession' Crowd?
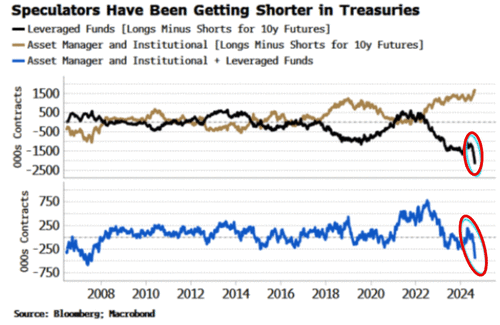
…But, and it's a big but, as Bloomberg Simon White notes, a covering in the short Treasury position of leveraged funds that has built up could push already-low-yields yet lower.
There’s already a lower bias to today’s jobs data. The consensus number for payrolls is 165k, but the whisper number is 150k. Job anecdotes through the month skew negatively. There’s also a bias to lower yields. Ian Lyngen of BMO’s client survey for payrolls shows that if USTs sell off after the data, 65% would buy the dip versus an average of 53%, a five-year high.
It comes at the same time as the COT data shows what is likely to be a bona fide big short position in Treasuries has built up. The COT data for USTs can’t be taken at face value as it is skewed by basis trading. But if we assume that much of this is conducted by leveraged funds trading with asset managers, we can take the difference of positioning between these two to get a better idea of “true” speculator positioning.
As the chart below shows, leveraged funds have been getting more net short than asset managers have been getting net long, indicating a building net short in USTs. Indeed, assuming something hasn’t gone awry with the data (and it doesn’t look like it has), the net short on this measure is the largest since 2008. (The chart shows 10y futures, but a duration-weighted average of 2,5,10 and 30y futures is also as net short as it has been since 2008.)
So although the bar is high for the data being weaker than expected today, positioning may have tilted the risks to yields dropping further…
… AND for any / all (still)interested in trying to plan your trades and trade your plans in / around FUNduhMENTALs, here are a couple economic calendars and LINKS I used when I was closer to and IN ‘the game’.
First, this from the best in the strategy biz is a LINK thru TO this calendar,
Wells FARGOs version, if you prefer …
… and lets NOT forget EconOday links (among the best available and most useful IMO), GLOBALLY HERE and as far as US domestically (only) HERE …
… Finally, before signing off for the weekend and spotted on Twitter where everything has some sorta value …
Sorry, not sorry … THAT is all for now. Enjoy whatever is left of YOUR weekend …


