weekly observations (07.20.26): rangebound, seasonally bullish, steepeners in favor and WarshGPT ...
Good morning / afternoon / evening - please choose whichever one which best describes when ever it may be that YOU are stumbling across this weekends note …
ZH: Two American Troops Killed In Attacks On Jordan Base As Iran Declares MoU Deal Is Over
This clearly a terrible development …
First UP a scheduling note for the week ahead. I’ll be travelling Tuesday and so I will NOT be spamming the intertubes and your inbox … On top of that, I am scheduled for (minor?)knee surgery Friday and unsure at this point WHEN. More to follow, sorry for inconvenience (OR yer welcome). Enjoy the break from ME and this pointless drivel.
Now, lets jump in to a very short summer weekend note …
Here we go again? Friday night and … this is fine … AGAIN? Small Business Bank, Lenexa KS ain’t just small, it’s outta biz …
I, too, can look at long bonds and see them a little bit more bearishly if I wanted …
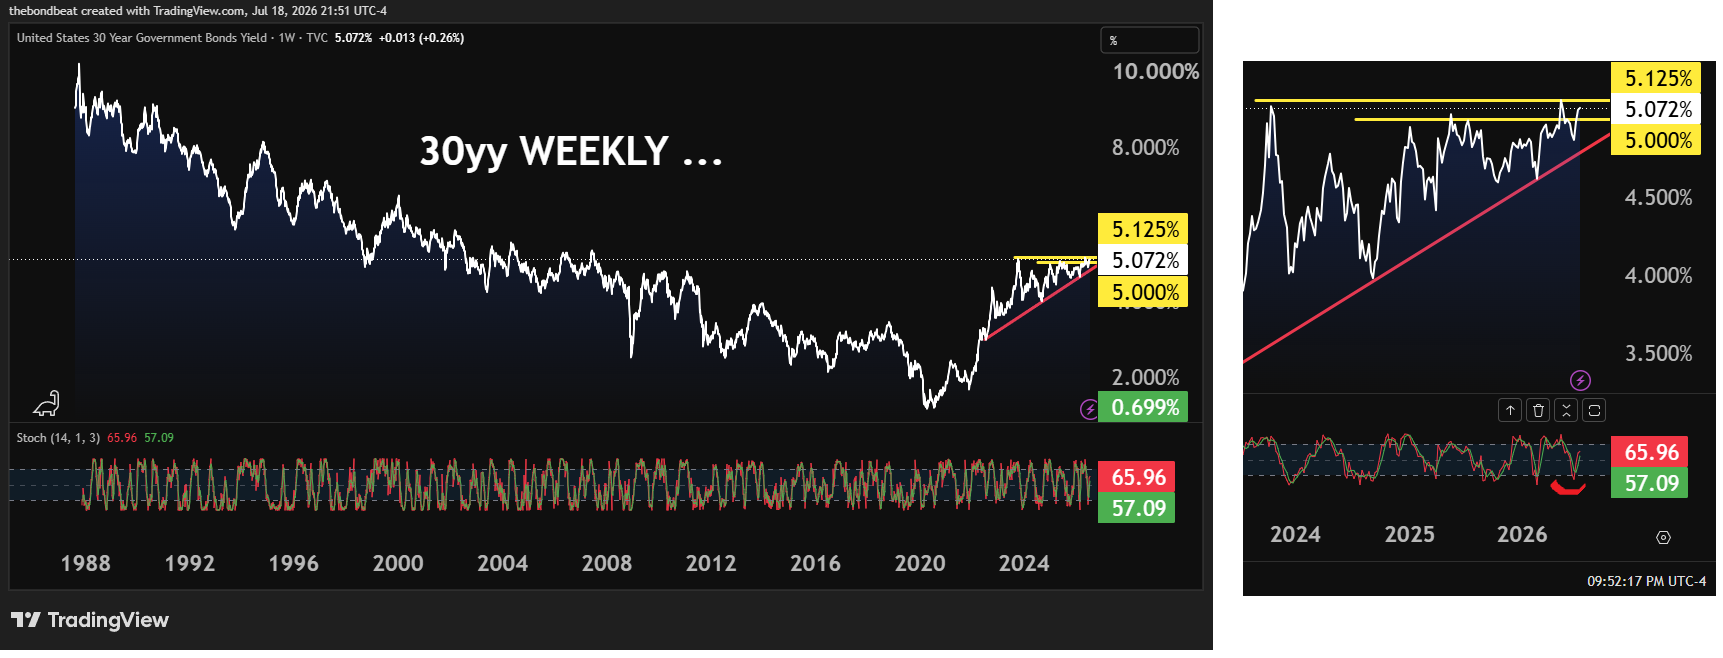
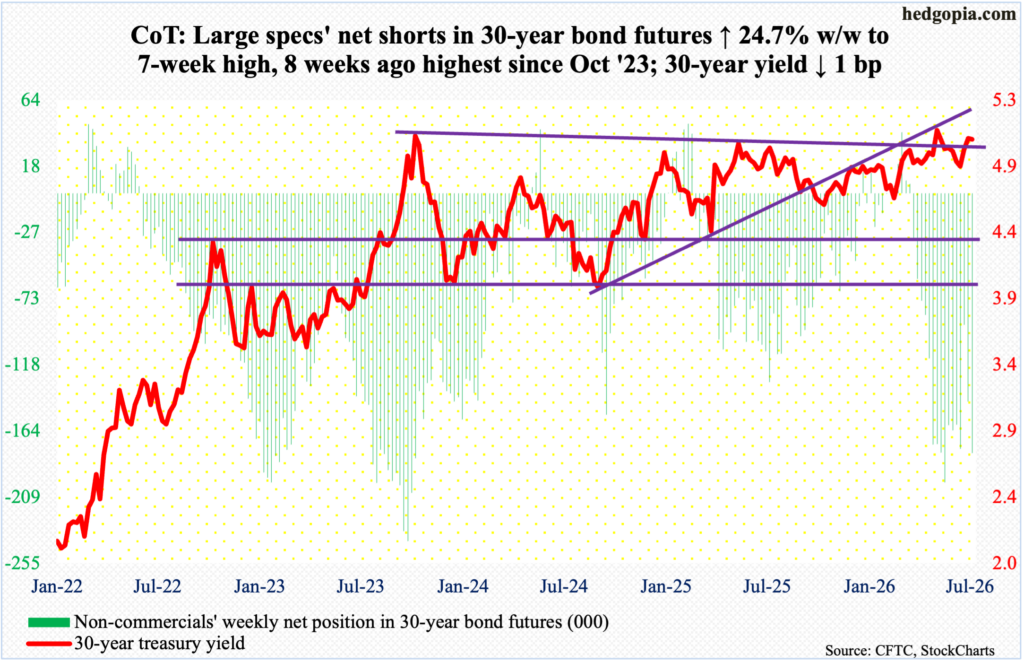
30yy WEEKLY (line): 5.125% support and 5.00 resistance …
… BUT … frankly, I’m not convinced. I’m neither bullish OR bearish and joining a growing chorus of those thinking we’re mired IN a range … It IS summertime and perfect time to say less and read more …
Once again, in case you missed it, HERE’S LATEST from Dr. Lacy Hunt with bearishness, in his own words …
…As a result, the post-globalization interest-rate environment is likely to be less stable than the one that prevailed from 1990 to 2020. Recessions, financial crises, technological breakthroughs, or successful balance sheet restraint could still produce periods of lower inflation and declining interest rates. However, absent a sustained recession, a favorable supply-side shock, or a prolonged period of monetary restraint, the broader structural backdrop—larger fiscal deficits, higher capital demands, fragmented supply chains, reduced globalization efficiencies, and greater sensitivity to Treasury supply—suggests that both inflation and long-term Treasury yields will trend upward.
… I’ll move along and briefly touch on / link to Friday DATA recaps …
ZH: Renter Nation Returns? Massive Jump In Multi-Family Unit Starts Despite Builder Sentiment Slump
ZH: US Industrial Production Disappoints (Again) In June
ZH: UMich Sentiment Extends Bounce From Record 46-Year-Lows As Gas Prices Ease
… and offer a few words from the BondBot Intern …
The Open: Markets Keep Buying the Dip... Until Reality Stops Offering Discounts
The week's scoreboard looked schizophrenic: bonds sold first on Iran headlines, then rallied as softer inflation soothed Fed fears, while the S&P 500 shrugged off geopolitics like a tourist ignoring hurricane flags. Treasuries remain the adult in the room—every oil spike steepens inflation anxiety before growth worries pull yields back down, leaving the curve trapped in a macro tug-of-war. Meanwhile, reports of additional troop casualties tied to the Iran conflict remind investors that real wars don't obey algorithmic buy-the-dip scripts, even if equities pretend they do. Add a second consecutive weekend bank failure to the mix and it's fair to ask whether the financial plumbing is quietly springing leaks beneath record stock prices. Scottie Scheffler is calmly stalking another Claret Jug while traders chase every headline like seagulls after a french fry. The market keeps pricing perfection; the bond market keeps pricing consequences—and history usually lets only one of them be right.
… Not terrible but certainly ain’t no WarshGPT …
CNBC: ‘WarshGPT’: How Wall Street is adapting to the Fed’s new era of communication
…This week, Morris’ firm, which manages exchange-traded funds tied to inflation and U.S. Treasurys, released “WarshGPT.” It’s an artificial intelligence-powered tool that parses nearly 1,800 documents and transcripts from Warsh, with the goal of helping users understand how he may analyze issues related to the economy or monetary policy…
… Interesting. Lets mess ‘round with it a bit and see what we see …
… I’ll move on TO some of Global Walls narratives I’m still blessed to stumble upon one way or another. These are SOME of THE VIEWS you might be able to use … A lighter than normal (summer-time) list for the beach …
INTO THE VOID (of data driven price action) we go and doing so having recently been stopped outta (2s10s)flattener for a loss …
In the week ahead, the data calendar is very limited and Fed speak is nonexistent as it’s the pre-meeting external communications blackout period. The technical landscape in US rates is near-term constructive as oversold conditions are worked off, and investors continue to digest the implications from June’s inflation data…
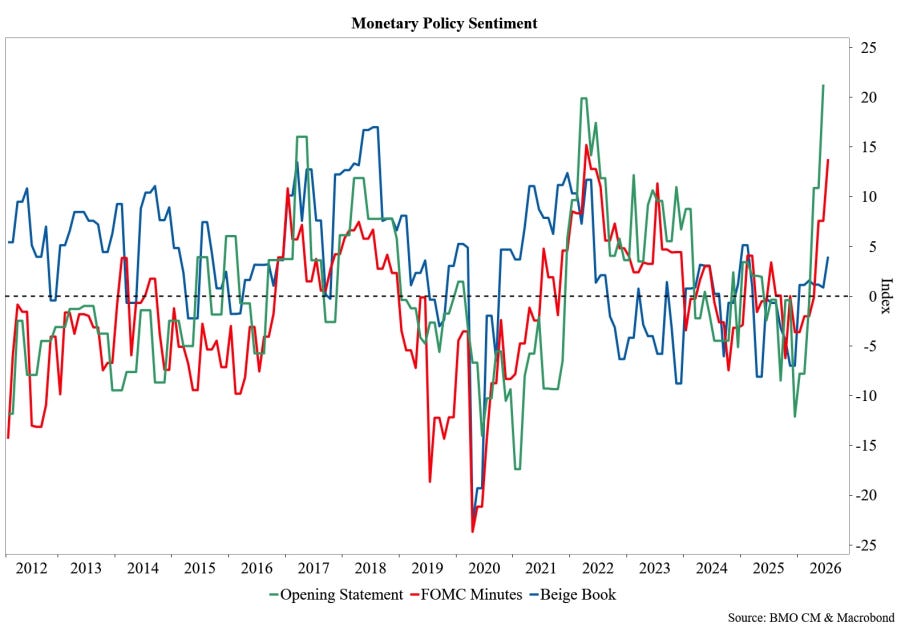
…Our second chart shows the trajectory of Bloomberg’s Monetary Policy Sentiment indexes, which track the hawkishness (more positive score) or dovishness (more negative score) of the Chair’s Opening Statement, FOMC Minutes, and Beige Book. In a testament to Warsh’s commitment to delivering on the Fed’s price stability mandate since taking the helm as Chair of the FOMC, all three sentiment indices have recently climbed to the most hawkish levels in years. For context, the Chair’s Opening Statement sentiment index surged to 21 at June’s FOMC meeting – the most hawkish score for an opening statement on-record, with data since 2011. Similarly, Beige Book sentiment rose to a 12-month high 4 in July, and the FOMC Meeting Minutes sentiment for June jumped to 14, the most hawkish since April 2022. It follows intuitively that breakevens have been remarkably well contained even as oil prices have begun to rebound. Whether five-year, five-year forward BEI or 10-year breakevens, the takeaway from market-based measures of inflation expectations has been one of confidence in the Fed's willingness and ability to curb inflation over time…
Weather delayed tonights NYY / Dodgers game and so, I’ll read this next one all ‘bout steepeners (and then some) …
We don't see a genie granting a wish for a hike or three by March 2027. With the AI-led equity rally rolling over and IG supply possibly slowing in response, we see focus shifting to downside risks to elevated growth, inflation, and supply expectations. Stay in UST 7s30s and SFRM7M8 steepeners.
Key takeaways
Markets price nearly 50bp of hikes by March 2027—over 75bp above the path seen as most likely by our economists and near a perma-3% real growth scenario.
That hawkish pricing tracked an AI-led equity rally. Both have since reversed, the Nasdaq 100 down 7% and semis down 20% from June highs, yet Fed pricing held.
Treasury underperformance owed as much to record first-half investment-grade supply and higher energy as to firmer data, not a durable growth reassessment.
Investment-grade supply usually slows from June to August but stayed heavy this year; the AI-stock drawdown should reinstate that lull and support Treasuries.
Stay in UST 7s30s steepeners at 66bp, target 100bp, stop 50bp – the best vol-adjusted carry and roll steepener vs. 30s – plus SFRM7M8 steepeners.
Inflation remains a key driver of the outlook for monetary policy. June inflation was a clean – not messy – signal in favor of disinflation. We believe disinflation has begun and maintain our out-of-consensus call that the Fed will remain on hold this year.
Key takeaways
June CPI inflation was a hat trick in favor of disinflation: Payback from energy, tariffs, and shelter led to a decline in headline and core CPI inflation.
Factoring in components of CPI and PPI that feed into June PCE inflation, we now forecast headline and core PCE inflation of -0.08% and 0.17% m/m, respectively.
Risks to inflation remain, particularly from AI-demand effects, but we retain our outlook for the Fed to stay on hold this year and cut by 50bp next year.
The week ahead is light on economic data. The entire week falls inside the Fed’s blackout period ahead of the July 28-29 FOMC meeting, so there’s no Fedspeak to parse before the committee revisits the current 3.50%-3.75% funds rate range. Odds are that the committee’s statement will remain hawkish but postpone any rate hiking.
On the other hand, the earnings reporting season is jam-packed this week. And of course, the fireworks show has resumed in the latest Middle East conflict. One major downside of earnings is that they might only meet analysts’ already high expectations. Another is that hyperscalers might scale back their guidance for capital spending (and/or returns from such spending), or announce unforeseen delays in building data centers.
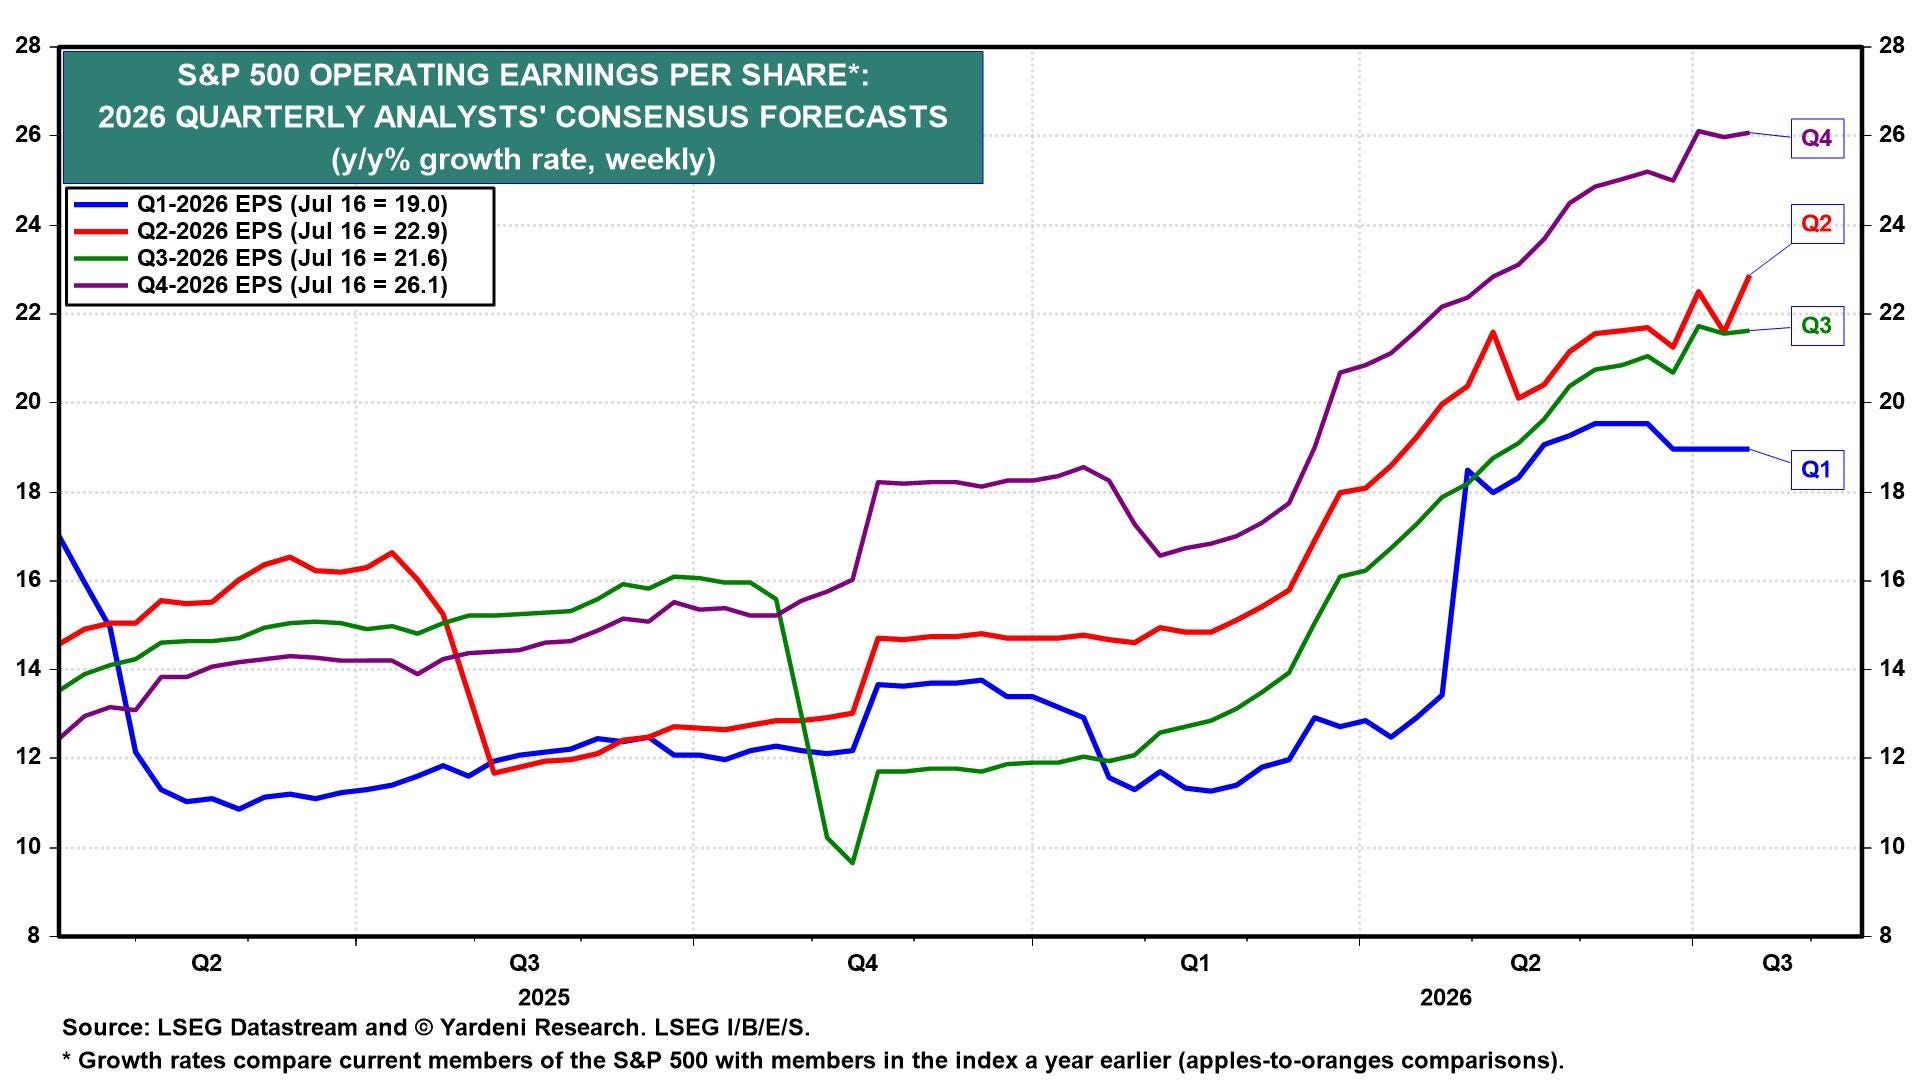
Wednesday stacks up as the busiest day of the earnings reporting week. GE Vernova, Texas Instruments, Alphabet, IBM, and Tesla all report that day. Intel reports on Thursday. The consensus of analysts’ estimates now implies Q2-2026 operating EPS growth for S&P 500 companies of 22.9% y/y, up from 21.6% a week earlier (chart).
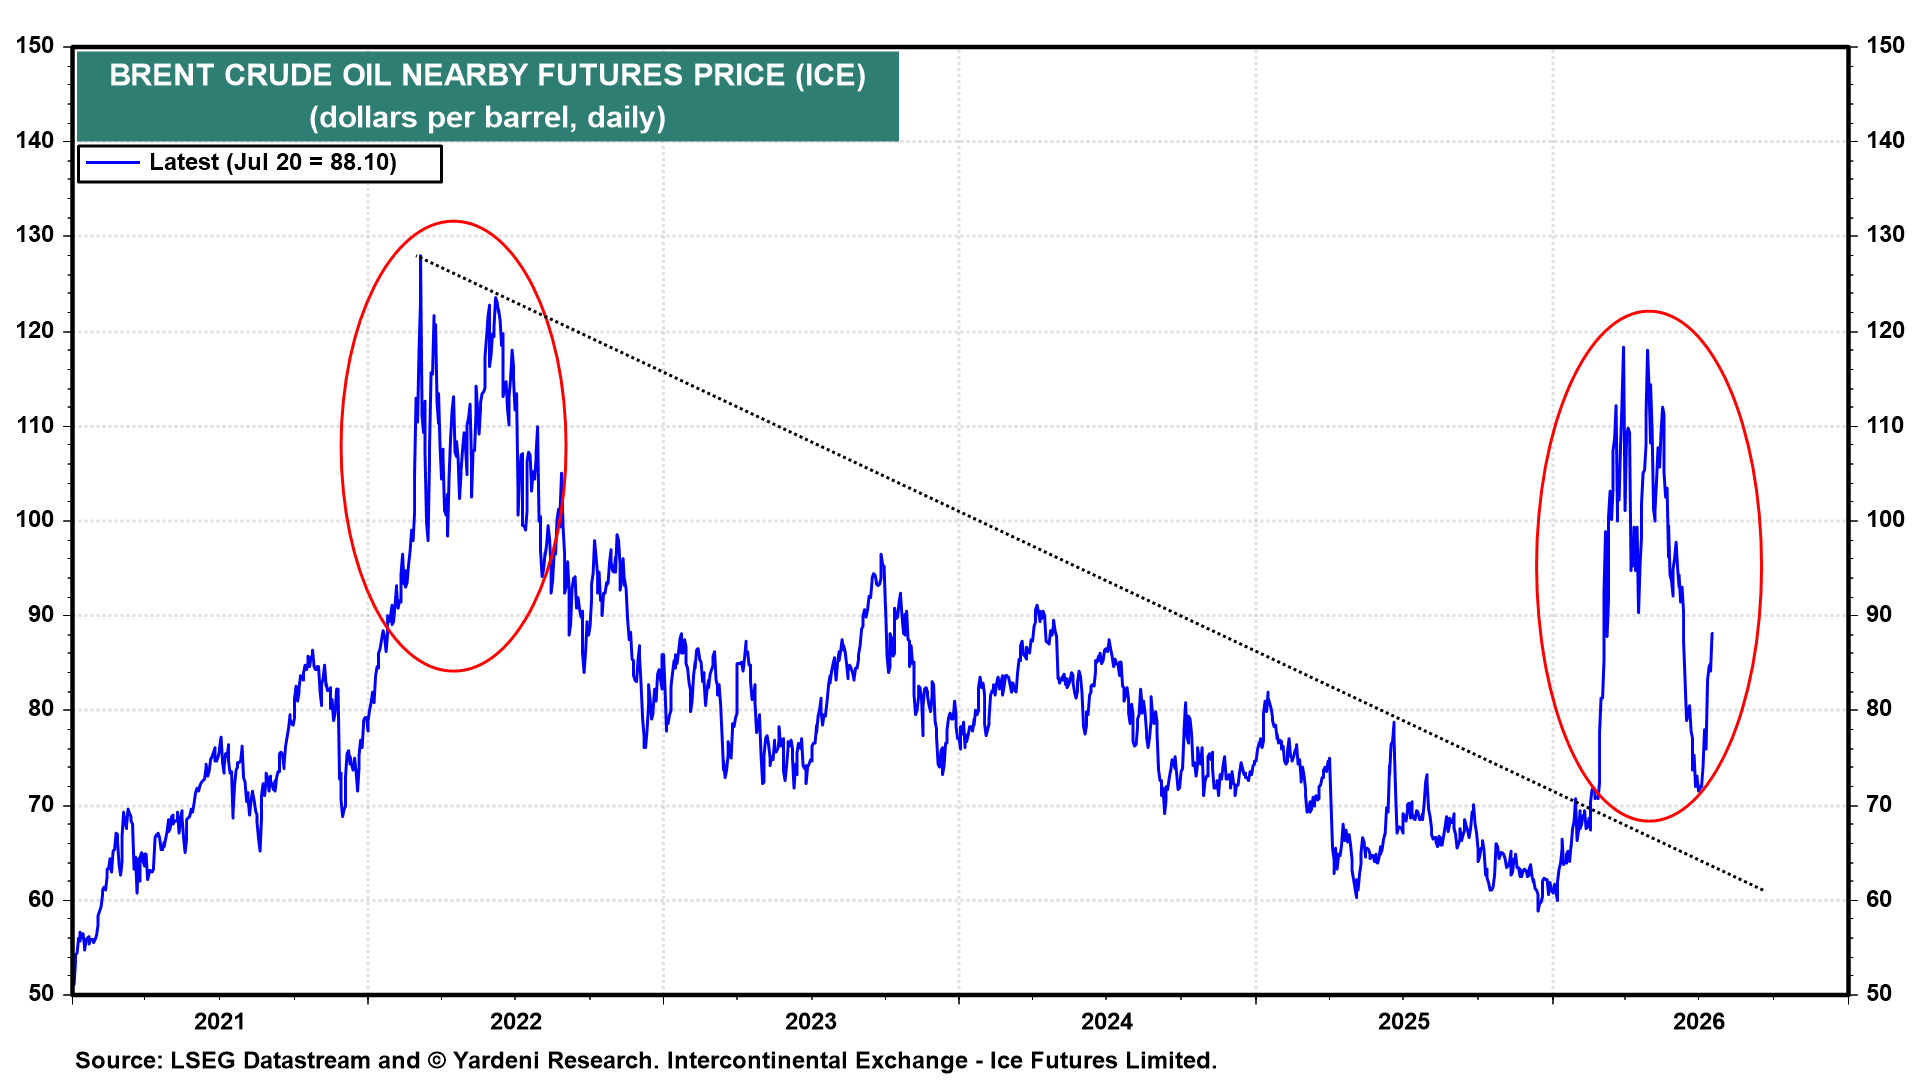
The risk in the oil market is excessive complacency about the impact of a reescalation of the Gulf War on oil prices. US forces carried out a fifth consecutive night of strikes against Iran this week, according to US Central Command, keeping oil prices elevated and pressuring borrowing costs. The price of West Texas Intermediate crude oil settled Friday at $82.49 a barrel and Brent ended last week at $88.10, both up over 10% for the week (chart).
… Moving along TO a few other curated links from the intertubes. I HOPE you’ll find them as funTERtaining (dare I say useful) as I do …
2s RANGEZILLA for ‘while …
July 17, 2026 AMFX: Friday Speedrun: Where are the animal spirits? Make it make sense.
…Interest Rates
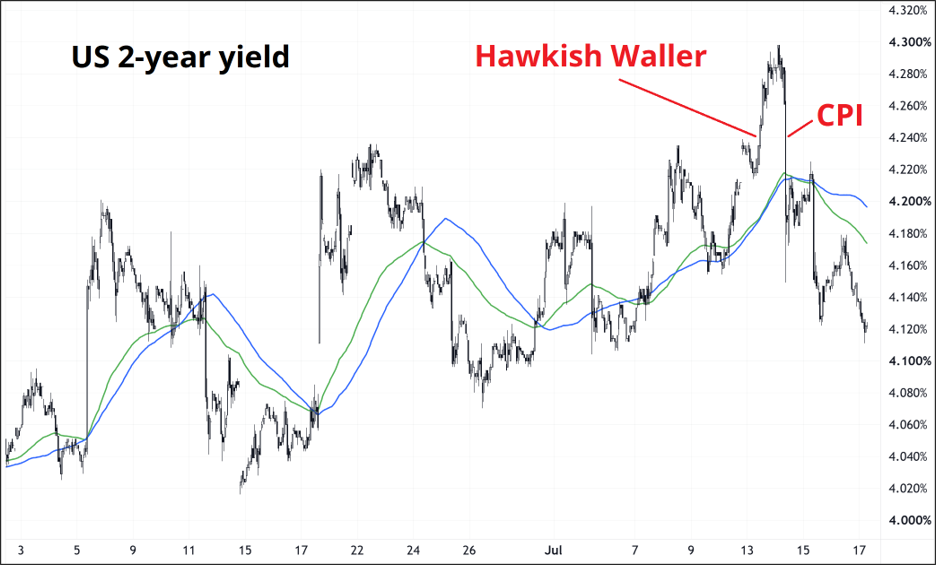
This week it was Waller’s turn to send out a super hawkish message at the worst possible time as Warsh’s pleas for less forward guidance go unheard and unnecessary volatility rules the day.
I agree with Warsh: We don’t need a Fed speech the day before CPI to explain the reaction function of a single Fed voter who was max dovish six months ago and is now max hawkish today. There is a theory that without forward guidance, we will see more volatility around data releases, but this mini experiment shows the exact opposite. My view is that changes in the economy and Fed policy will yield particular amounts of volatility and moving that volatility around doesn’t achieve anything other than lowering the credibility of the institution as it looks like they are chasing their tails.
There is a high probability that pre-war Fed speeches (especially Waller) added to the rate cut mania before the war and post-war Fed speeches added to the rate hike mania after the war. The truth was always in the middle: Fed on hold. But: “We’re going to stay on hold” is boring and speeches need to be interesting, I guess.
Going forward, the Fed has shown it is desperate to flex some credibility with a hike, but the data just absolutely refuses to cooperate. Despite the hawkish lean, it’s very difficult to justify a hike if you are data dependent. At some point they may find a sequence of releases to justify a hike, but that is not going to happen before September now because the only remaining data points on labor or inflation between now and the July FOMC are second-tier stuff like Initial Claims. Core PCE comes out after the Fed meets.
2-year yields in a 4.0%/4.25% range for a while makes sense to me because even if the data continues to show disinflation and a no hire/no fire job market, the Fed won’t flip back to signaling rate cuts in their speeches for many, many months. But rate hikes will not be justified. So: Fed on hold.
MORE SHORT THE LONGER END …
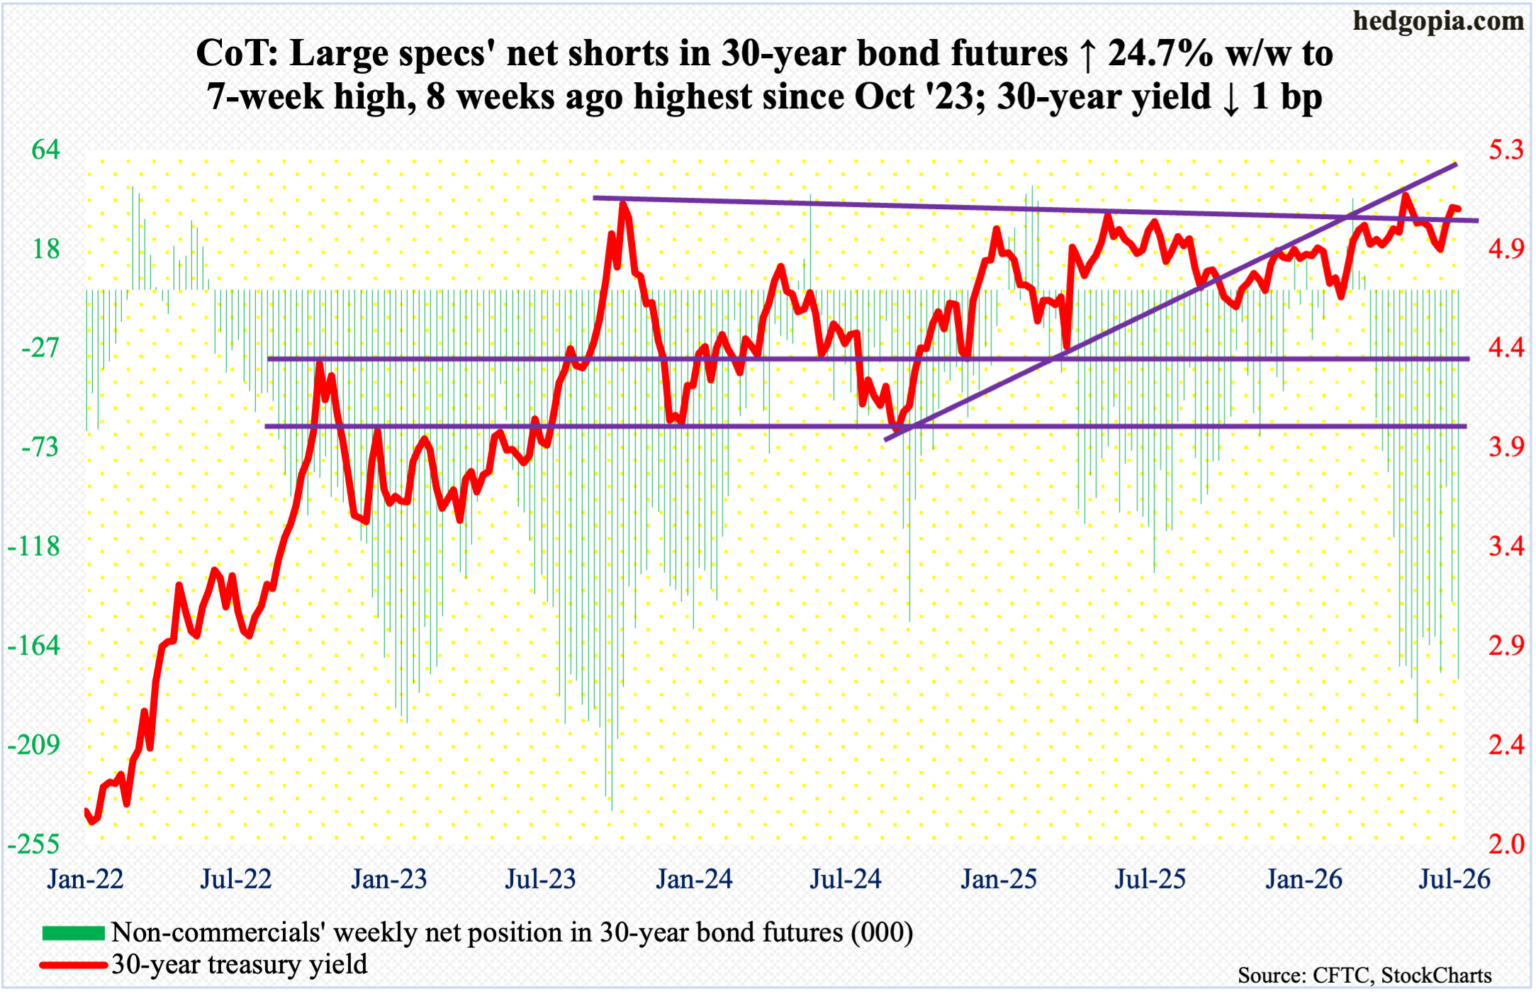
18 JUL 2026 Hedgopia CoT: Peek Into Future Through Futures, How Hedge Funds Are Positioned
…30-year bond: Currently net short 179.1k, up 35.5k.
Saw former Fed gov Miran on BBG TV early on Friday and now with Hudson Bay Capital, offered out some thoughts on MONETARISM … we think we KNOW what he thinks and now, on the ‘buy side’, a platform to share …
07/13/2026 HUDSON BAY RESEARCH: A Return to Monetarism? Peter Ireland · Stephen Miran · Nouriel Roubini
Executive Summary Due to the instability of money demand, monetary policy implementation in the United States has held a smaller and smaller role for analysis of money, to the point that the Federal Reserve and therefore market participants rarely if ever mention it. However, new Fed Chairman Kevin Warsh has clearly indicated a view that money supply is relevant for monetary policy. Our contention is not that a return to targeting monetary aggregates is imminent or appropriate, but that monetary aggregates contain useful information for forecasting growth and inflation and this information should not be discarded, as it currently is.
Because they generally follow the Fed, financial markets are ill equipped to understand the return of monetary analysis. We aim to bring them up to speed. We first review monetarism and its rise and decline at the Fed. Next, we survey the state-of the-art in this unjustly neglected field of macroeconomics. There is significant evidence that Divisia monetary aggregates outperform simplesum aggregates. Finally, we extend the frontier of monetary analysis to current data through an application of the Greenspan-era P-star model.
Under benchmark assumptions for the supply side, most monetary aggregates indicate monetary policy is at present approximately neutral in its effect on inflation. In contrast, immediately after the pandemic, monetary analysis indicated policy was extremely stimulative, suggesting high inflation would be persistent and that tighter monetary policy was necessary sooner than it arrived. Unlike immediately after the pandemic, most monetary aggregates do not suggest recent high inflation will prove persistent, and it may be inappropriate to attribute recent quarters' high inflation to excessive money growth. If money growth begins to accelerate from current levels, it would suggest tighter monetary policy is appropriate.
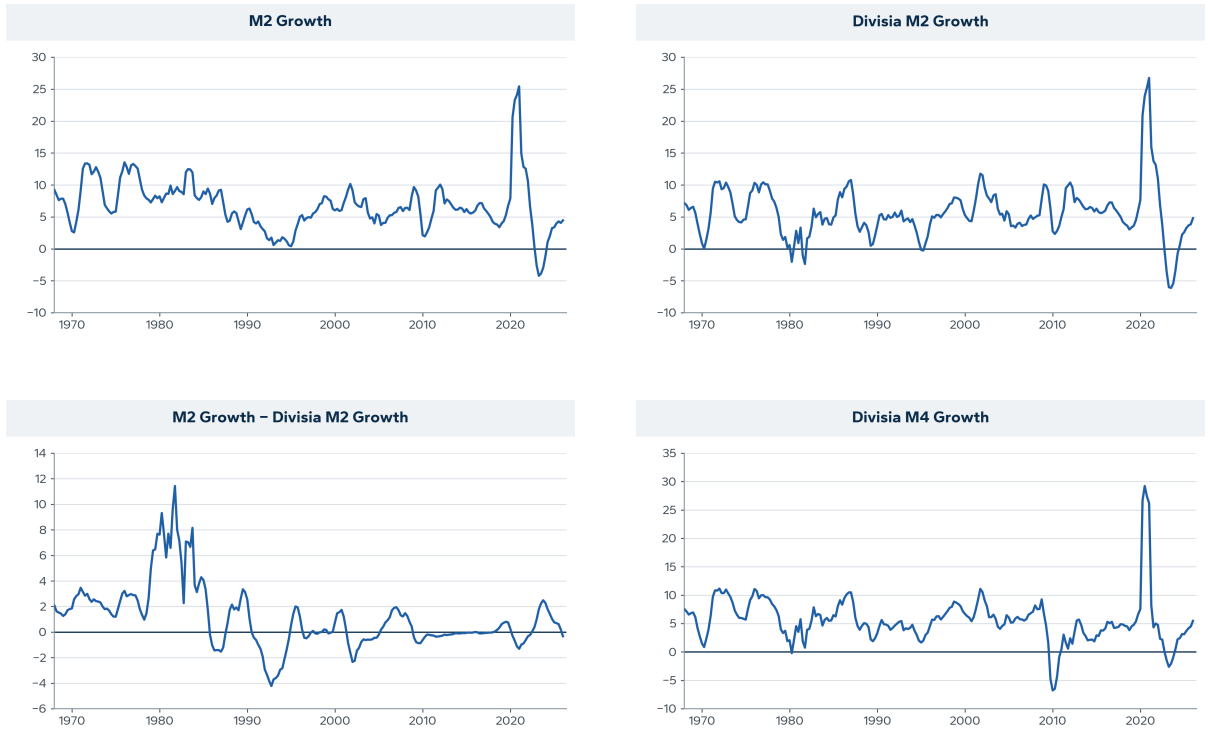
…Figure 2 compares the growth rates of M2 and Divisia M2. Reassuringly, it reveals that in recent years these two measures of money growth have behaved quite similarly. In particular, the 2020-21 explosion in money growth that presaged the inflationary surge that followed shows up quite clearly in both M2 and Divisia M2. Large differences have appeared in the past, however. And when these differences do appear, the signals sent by Divisia M2 have been more reliable than those sent by M2. The graphs show, for example, that if Milton Friedman had looked at the behavior of Divisia M2, he would have more correctly seen clear and persistent signs of monetary restraint – and even periods of outright monetary contraction – both during and after the Volcker disinflation of 1979 through 1983, thereby avoiding his unfortunate mistake warning of a return of higher inflation. In addition, the unusually slow growth in M2 that caused its velocity to rise unexpectedly in the early 1990s appears more muted in Divisia M2, suggesting that improved monetary measurement through use of the Divisia aggregate might have also avoided the breakdown of the original P-star model.
Figure 2. Broad Money Growth. The top two panels show year-over-year percentage-point growth rates of M2 and Divisia M2. The bottom left-hand panel shows the difference between M2 and Divisia M2 growth. The bottom right-hand panel shows the yearover-year percentage-point growth rate of Divisia M4.
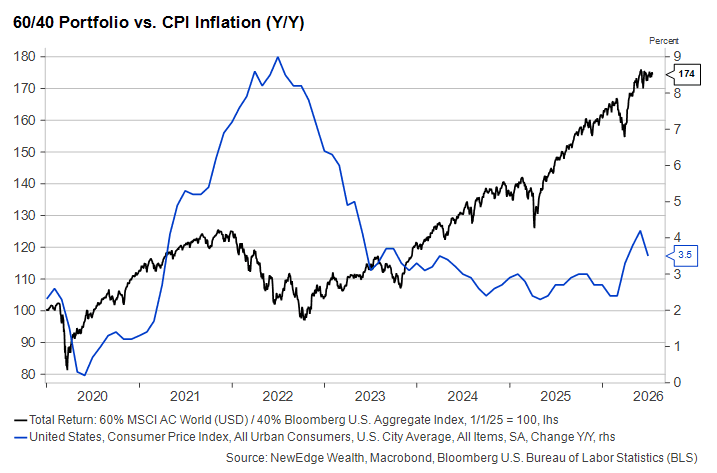
Inflation is kryptonite to the superman of the 60/40 …
Last week’s whirlwind of Fed commentary and inflation data created a few market gyrations but ultimately left interest rates lower and the need for rate hikes less urgent. Evidence that inflation may finally be back on the decline is welcome news for investors, even as it arrives with a reminder that the newly opaque Federal Reserve may limit the extent to which we can enjoy it.
We think the current economic backdrop continues to support a Fed on “hold”, neither hiking nor cutting rates, which we argue is the best outcome for risk assets in the near term. The Fed will only be compelled to hike rates if inflation becomes a more powerful “enemy” and the economy is running uncomfortably hot. If the Fed is cutting rates anytime soon, it will be because the “enemy” is weak growth and a softening labor market.
It’s important for investors to “know their enemy” when thinking about the forward rate path and find ways to diversify around the various risks it presents. Rage Against the Machine’s 1992 release, “Know Your Enemy”, lyrically and tonally encapsulates how both hot inflation and weaker unemployment could wreak havoc on markets, but in different ways. (And yes, we appreciate the inherent irony of using Rage Against the Machine song to inspire a written commentary for clients of a financial services firm.)
As of 7/17/26
…Hoping We Have Passed “Peak Fed Hawkishness”
“Something must be done”
Markets, of course, continue to view inflation risks through the prism of interest rates. Upside inflation surprises tend to push rates higher as investors a) demand a higher yield for fixed coupon payments; and b) anticipate tighter policy via higher interest rates from the Federal Reserve.
A central bank’s reaction function matters a great deal for how markets respond to inflation news. History is rife with examples of central banks (primarily but not exclusively in emerging markets) that either ignore or miscalculate the risks of higher inflation and see their currencies and sovereign bonds sell off sharply. Stocks’ reaction has been more case-dependent. On the one hand, higher inflation can help profit margins. On the other hand, too much inflation can lead to financial instability and economic collapse, neither of which is good for business.
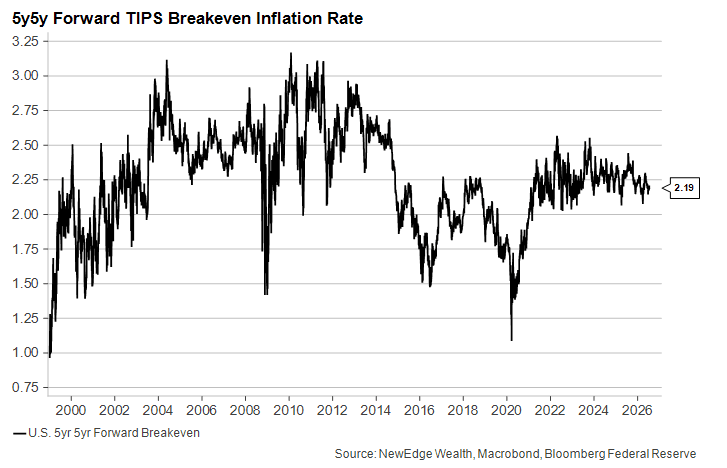
More credible central banks, which have nearly always included the Federal Reserve, tend to get the benefit of the doubt from investors on handling inflation risks. Communicating and executing policy calmly and competently can help keep investors’ inflation expectations low, and those low expectations can helpfully become their own self-fulfilling prophecy. One look at the 5-year 5-year forward breakeven rate of inflation – essentially the inflation risk premium priced into the Treasury market – tells you that at no time in the past five years have expectations become “unanchored” from the Fed’s two percent target despite the fact that target has never been reached:
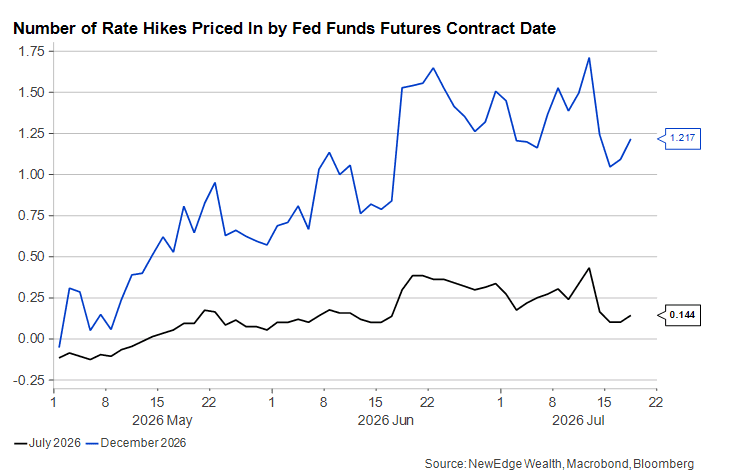
Enter Kevin Warsh, the new Fed Chair who has vowed to bring inflation back down to target to help preserve his institution’s credibility. Warsh testified before Congress last week for the first time and chose to “drop the style clearly”, to borrow a RATM lyric. His comments revealed little about his plans for monetary policy or even his framework for making decisions. Chair Warsh’s colleague on the Fed’s Board of Governors, Chris Waller, has been on the opposite side of the transparency spectrum lately. Waller gave a speech last Monday in which he strongly hinted at a willingness to vote for a rate hike at the July 29th meeting if inflation data, specifically core inflation, worsened. His comments sent the odds of a July hike to as high as 45% intraday on Monday before this week’s inflation data came in cool and caused the July hike expectations to fall to less than 15% by the end of the week.
Barring a prolonged return to oil prices above $100/bbl (and gasoline prices above $4/gallon), inflation may remain quiet enough for the Fed to keep policy on hold for the remainder of the year. If “action must be taken” in either direction – both hikes and cuts were floated as possibilities in the June meeting minutes – it’s unlikely to be good news for equity markets. Hikes would mean high inflation and volatile bond markets, while cuts would only come amid a serious macroeconomic deterioration. The pricing out of hikes, which would show up as a drop in the blue line above, would be positive for just about every asset class…
Bank failures and now foreclosures? Please tell me these things aren’t makin’ a comeback …
Yahoo: Foreclosures hit highest level since 2019, sparking interest from bargain hunters
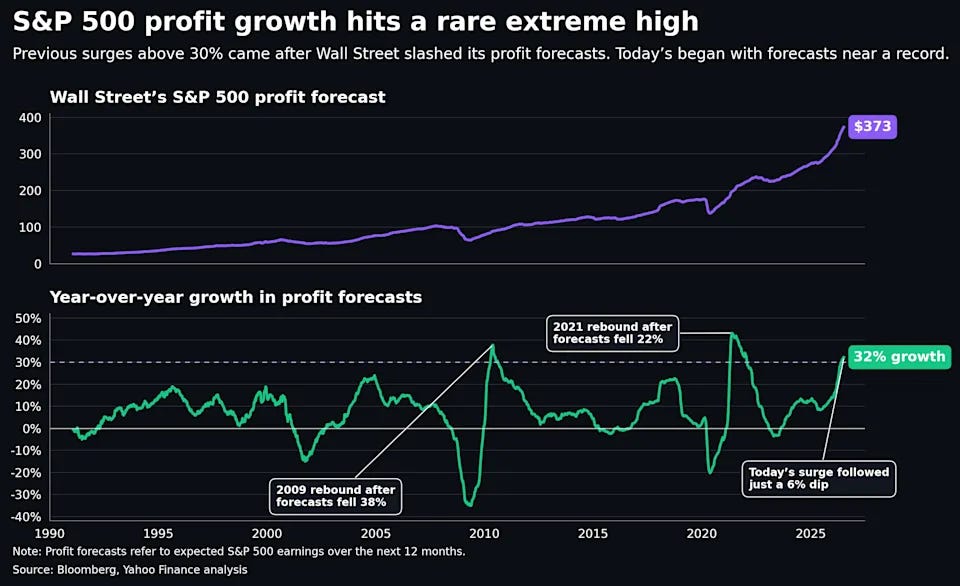
The S&P 500 (^GSPC) is in an earnings boom. The usual earnings bust never came.
Wall Street’s forecast for S&P 500 profits over the next year has climbed to about $373 per share, up roughly 32% from a year ago.
That is a rare number.
Since 1990, forward earnings growth has been stronger only in the aftermath of the global financial crisis and the pandemic. Back then, however, Wall Street was rebounding from deep cuts to its forecasts.
Bloomberg, Yahoo Finance analysis
Not this time…
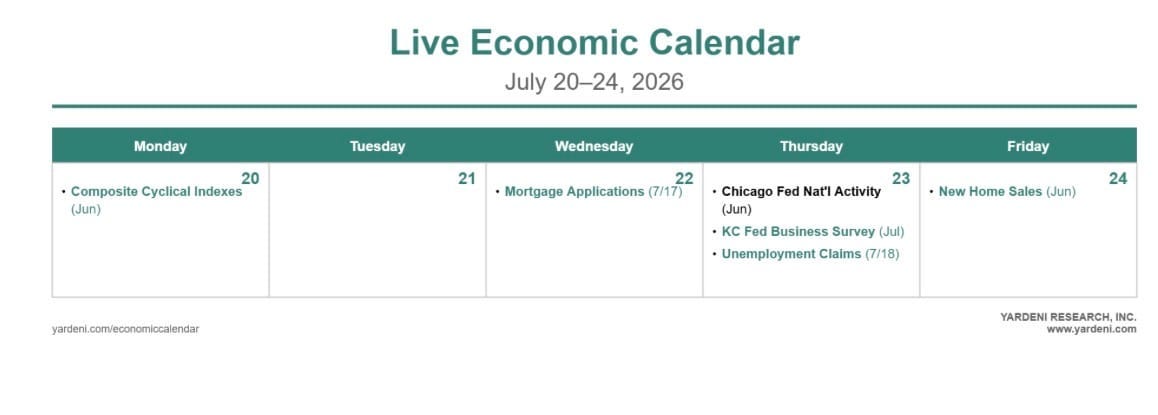
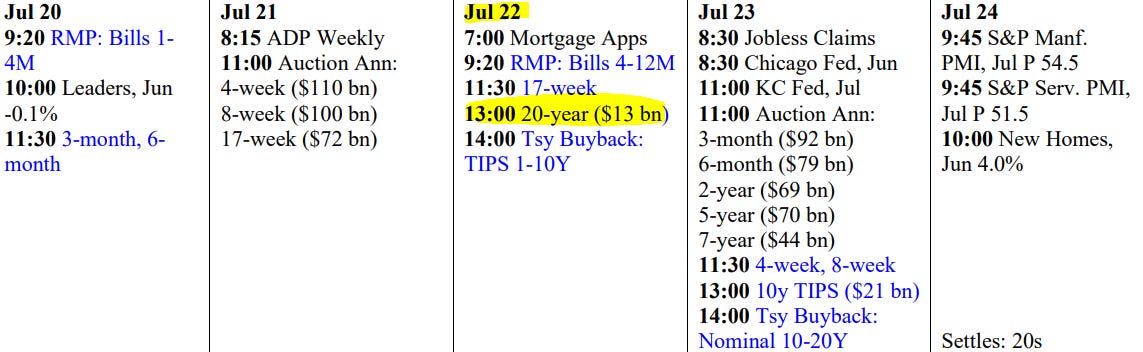
… AND for any / all (still)interested in trying to plan your trades and trade your plans in / around FUNduhMENTALs, here are a couple economic calendars and LINKS I used when I was closer to and IN ‘the game’.
We expect new home sales to rebound modestly in June following recent weakness, although elevated mortgage rates and soft buyer demand suggest housing activity remains subdued.

Had pretty major knee surgery myself 12 yrs ago. It's all in the rehab. Good luck they start you on the pink wts in PT for a reason lol!
Excellent piece
Best wishes for a full and quick recovery