Yahoo: Stocks fall after NFLX whiffs, chips sell-off hammers NAS…
RTRS: ‘Bloodbath’: Analysts react to Asian shares sinking on tech selloff
CNBC: SPCX falls further in pre-market after Starship test flight aborted
… AND a few thoughts …
Hopefully visuals yestworked and ‘Stack has things sorted out going forward.
Long duration assets — specifically Qs — are taking a hit this morning. Global CHIPS and the NAZ havin’ a rough couple / few days and the beating continued overnight … the good news is it’s not YET hit the long bond, one of the very longest duration instruments.
In fact, the selloff in long duration (QQQs) helping provide ‘the bond market’ a F2Q bid. Currently, the belly — 5s — nearly the best on the list — so lets begin there …
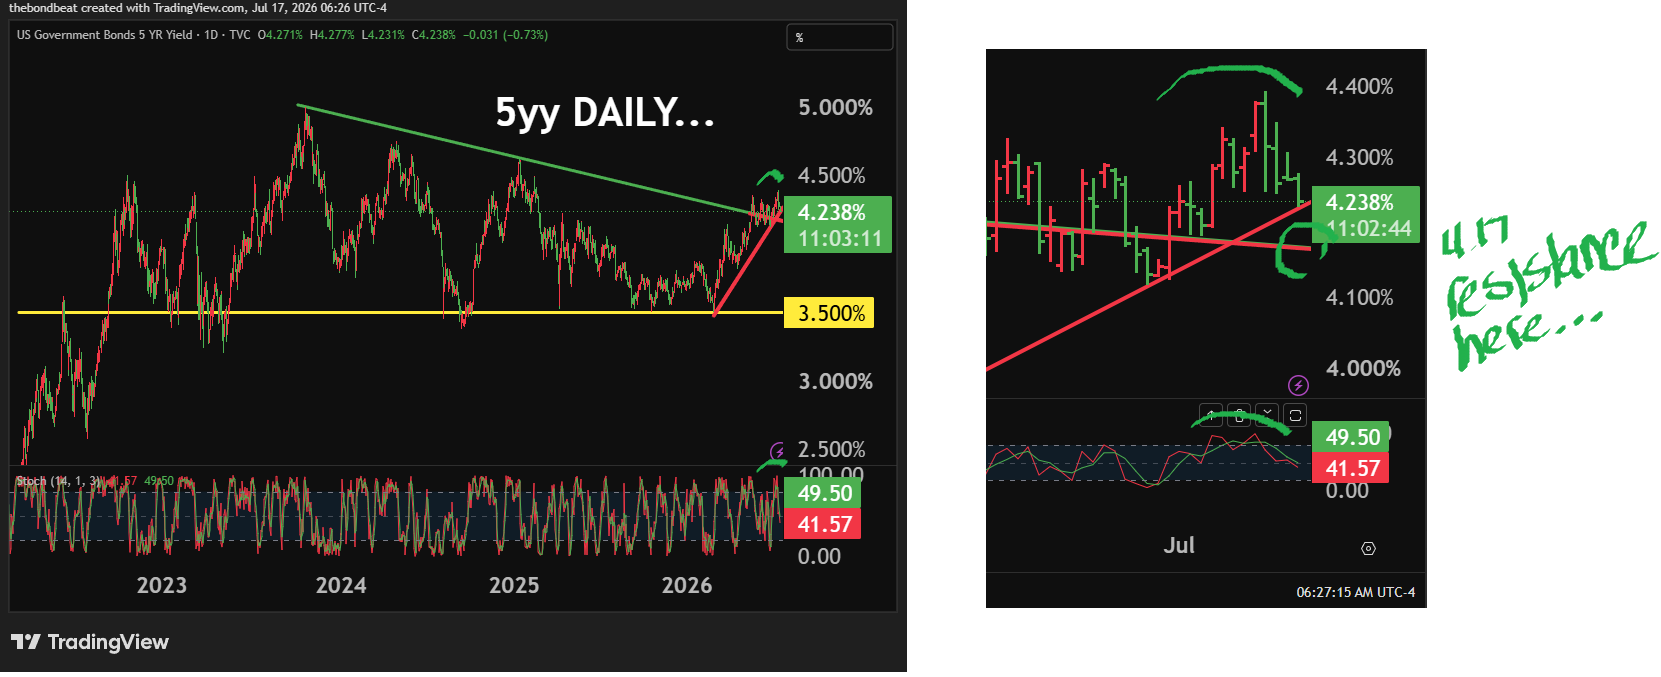
5yy DAILY (bars): 4.25%, 4.35/40 support and 4.17 resistance …
… as momentum reflexing lower unwinding overSOLD conditions as yields had risen and are now in a slight decline … all very unconvincing especially for those thinking HIKES and who are BEARISH … a #RipOrTunity of sorts — for those looking to sell into strength, may very well lie ahead
Yesterday I attempted to note more bullish look / feel of 10s (daily) as momentum appears oversold and 10s had romanced / created TLINE support (4.64%) … I’ll leave that be and continue to watch / listen to and learn from as many the experts as possible. That in mind, noted HERE with more bullish leaning visual of long bonds, a more bearish view (Gundlach) and a twitted reference suggesting, ‘…Even Lacy Hunt has turned bearish, to his credit.’
HERE’S LATEST from Dr. Lacy Hunt with bearishness, in his own words …
…As a result, Chairman Warsh inherits an immediate situation where money growth needs to materially slow if Fed policy is to avoid reinforcing inflationary momentum. The challenge is that the short-run financial effects of balance sheet reduction may differ substantially from the longer-run inflation effects. Markets that have become accustomed to abundant liquidity may initially experience tighter financial conditions, while the eventual disinflationary benefits of monetary restraint may emerge only with a considerable lag.
Higher real rates, tighter financial conditions, and reduced liquidity growth would likely restrain aggregate demand, credit creation, and asset-price inflation. Over time, this restraint could reduce inflationary pressure and eventually lower nominal interest rates if inflation expectations decline sufficiently.
The result is not a simple forecast of continuously rising interest rates, but rather a more volatile interest-rate regime. In the near term, balance sheet reduction could raise term premiums and real yields as markets absorb greater Treasury supply without Federal Reserve support. Over the longer term, however, if tighter monetary conditions successfully suppress inflation, the inflation component of nominal yields could fall, partially or fully offsetting the earlier rise in real rates and term premiums. If this new policy regime is not pursued, structural inflation will remain unchecked.
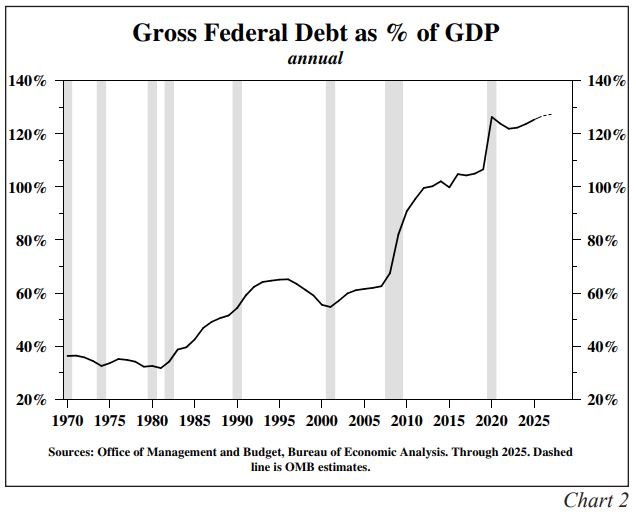
Persistent increases in gross U.S. federal debt relative to GDP (Chart 2) could boost debt-service costs through a channel that is not widely appreciated. Drawing on extensive archival research of fiscal policy and economic conditions, Hoover Institution historian Niall Ferguson formulated "Ferguson's Law," which holds that great powers risk decline when debtservice costs exceed military spending. Interest expense is more of a reflection of past fiscal policy failure rather than an indicator of future economic activity. As debt levels rise relative to the size of the economy and fiscal flexibility diminishes, investors may increasingly demand a higher risk premium on Treasury securities, placing upward pressure on long-term interest rates.
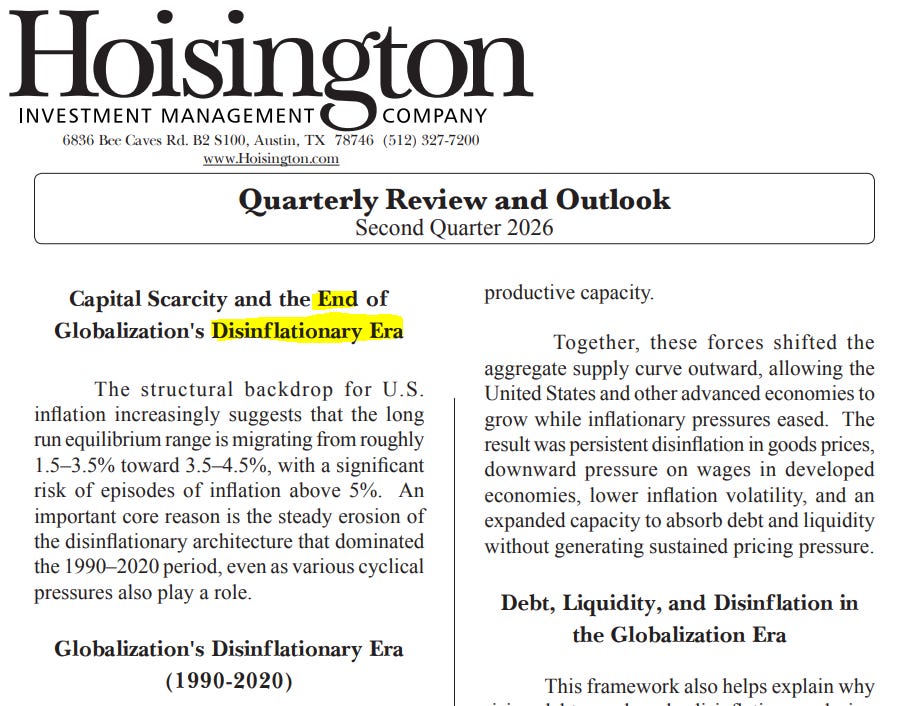
As a result, the post-globalization interest-rate environment is likely to be less stable than the one that prevailed from 1990 to 2020. Recessions, financial crises, technological breakthroughs, or successful balance sheet restraint could still produce periods of lower inflation and declining interest rates. However, absent a sustained recession, a favorable supply-side shock, or a prolonged period of monetary restraint, the broader structural backdrop—larger fiscal deficits, higher capital demands, fragmented supply chains, reduced globalization efficiencies, and greater sensitivity to Treasury supply—suggests that both inflation and long-term Treasury yields will trend upward.
… Fiscal policy, DEMAND (for capital), mucked up supply chance, reduced efficiency along with greater SENSITIVITY to UST supply add up to keep upwards pressure on 30yy … NOTED. Got it. Having followed him for the past 3 decades, this is ‘bout as bearish as it gets … I’ll print and keep this one on the desk for reference for awhile …
Now in as far as some of the DATA behind DAILY price action …
ZH: 'Slow Hire, No Fire' Economy Confirmed As Jobless Claims Drop Near Record Lows
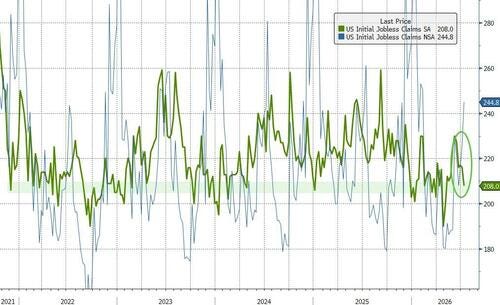
The number of Americans filing for unemployment benefits for the first time dropped to just 208k last week - back near its lowest level on record...
...and still showing no signs of stress in the US Labor market…
ZH: Despite Slumping Sentiment & Lower Gas Prices, The American Consumer Is Still Spending Strongly
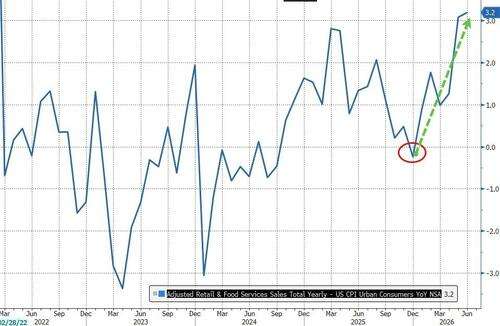
…Interestingly, ‘real’ retail sales (admittedly crudely adjusted via CPI) continue to rebound from a negative print in December to its highest since March 2022...
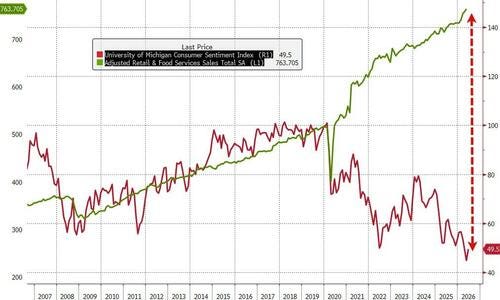
Finally, the American consumer appears to still be spending despite survey-based catastrophic slump in sentiment...
Admittedly, lower-income households have indeed felt the pinch of the gas shock more: they’ve seen a larger increase in necessary spending, which has led to a widening of the “K” in discretionary outlays.
Will that start to ease now that gas prices are starting to tumble? (although rising in recent days).
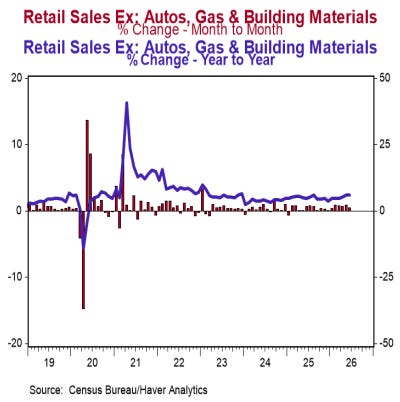
WolfST: Americans Splurge Online and at Vehicle Dealers, instead of Buying Homes? YOLO? Retail Sales without Gas Stations Jump for 5th Month - Sales at gas stations were pushed by massive price movements of gasoline; we look at retailer categories separately to sort it out.
… Data and price action in the short run, bond bulls turned bears for the longer-term, forget it. Here are a few words from my BondBot Intern …
Hamptons Hedge: When AI Checks Out, Bonds Check In Nothing motivates a Friday Treasury bid quite like watching global chip investors discover that "priced for perfection" is just another way of saying "priced to disappoint." Overnight, the semiconductor rout rolled from Wall Street into Asia despite strong earnings, because in late-cycle markets good news merely raises the bar for the next disappointment. The familiar Flight-to-Quality trade is back—just in time for portfolio managers to head for the Hamptons pretending this was always the plan—as buyers creep into Treasuries while equity tourists scramble for the exits. Yet before anyone resurrects the secular bond bull, remember Lacy Hunt's warning: structural deficits, relentless Treasury supply, fractured globalization, and sticky capital demand still argue that every rally in duration is fighting the fiscal tide unless recession does the heavy lifting. In other words, today's bond bid looks more like a life raft than a luxury yacht. Punchline:Risk-off can win the day—but deficits still own the decade.
Noted…
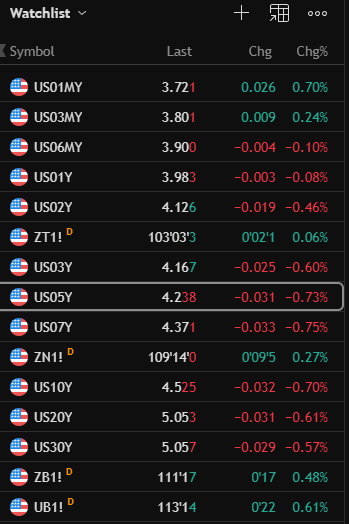
Onwards and upwards TO the reason many / most of you are likely here … whatever it may be on Global Wall’s mind but first … here is a snapshot OF USTs as of 700a:
… for somewhat MORE of the news you might be able to use … a few curated links for your dining and dancing pleasure …
NEWSQUAWK US Market Open: NQ -1.5% but off lows after weak APAC lead, USD and Fixed lifted on haven demand … Fixed income benchmarks supported by safe haven flows … USTs (+8 ticks) trend higher despite a lack of events on the calendar. Fed’s Jefferson gave remarks overnight, stating that it would be appropriate to reconsider the stance in the scenario in which inflation does not start cooling.
Finviz (for everything else I might have overlooked …)
Moving from some of the news to some of THE VIEWS of Global Wall you might be able to use … a large portion of what follows are ReSale Tales recaps / victory laps — think FIFA and PRIME DAY …
PRIME Day and FIFA = ReSale TALES looking better than they really are? Yep, may very well be …
Although headline sales moderated on the back of declining pump prices, details point to a strong rebound of consumer spending in Q2. With idiosyncratic influences from the World Cup and an earlier-than-normal Amazon Prime Day exaggerating strength, we still expect H2 deceleration.
…Revisions to seasonal adjustment factors contributed to June’s strength. As shown in Figure 6, June’s control group estimate a boost from seasonal adjustments, albeit providing less of a tailwind was not as substantial as in prior years. Even so, this tailwind is likely unwarranted, given the unusual timing of the Prime Day event. Published adjustment factors suggest that July’s control group estimates will be punished by seasonal adjustments, with the factors anticipating a recurring boost from the usual timing of the sale during that month (Figure 7).
AI sentiment is cooling but Semis still lead YTD; rotation into unloved Software is modest. Both seeing major multiple compression. Investors grappling with sustainability of Semis' outsized earnings growth. For Software, it is still the fear of AI disruption.
Soft CPI data take hawkish pressure off the Fed, but rebound in oil means inflation risk hasn't all gone away. This is more an issue for Europe, with German and US yields diverging again. Meanwhile, momentum unwind continues to cause volatility across the Tech space, but earnings remain strong.
ReSale TALES and a daily recap / victory lap - silence is golden?
July 16, 2026 BMO: Retail Sales Lowest Since Jan, Claims drop to 208k
Retail sales in June rose +0.2% MoM vs. +1.0% prior (revised up from 0.9%) and +0.2% anticipated. This represented the weakest print since January. Ex-autos, the -0.2% MoM print was the largest downside move since May 2025. The control group matched estimates at +0.5% MoM vs. +0.8% prior -- leaving well intact the prevailing perception that US consumers remain on strong footing. The three-month average annualized pace of control group sales came in at 9.2% vs. 9.7% in May and 5.9% at the end of Q1…
…Overall, this morning's round of economic data was net positive for the economic outlook -- indicating a stable labor market and ongoing consumption. Treasuries were under pressure ahead of the data and the bearishness persists as investors look ahead toward what is likely to be a relatively uneventful session from here. This morning's selling pressure has brought 10-year yields back toward 4.60% as the long-bond has reached levels not seen since mid-May…
…Treasuries cheapened throughout most of Thursday’s trading session, although the market found a bid off the lows late in the day as equities slipped. The debate continues whether the Fed’s next move will eventually be a hike or a cut. We’re cognizant of the arguments on either side and suspect that the performance of inflation during July and August will have the ultimate say – not only on a September move, but October and December as well. By the end of the summer, the Fed will have a much better sense of the degree of pass-through from the energy shock as well as whether the stickiness in supercore inflation seen in Q1 makes a return…
2-year yields between 4.00% and 4.25% for several weeks fits well with our interpretation of the macro risks and policy uncertainties. There is obviously event risk associated with the upcoming FOMC decision, statement, and press conference – although Warsh’s reluctance to offer forward guidance and the absence of SEP updates suggests the hawkish surprise-potential should be limited. Instead, we suspect that the truncated FOMC statement and Warsh’s demonstrated ability to hold-the-line on withholding forward guidance (even in front of Congress) will leave investors with the decided impression that monetary policy is data-dependent. It’s a familiar stance and one that investors can find comfort in given the lack of further cues from the Fed.
We’re constructive on the belly of the curve (5s and 10s) in the coming weeks. The front-end can only rally so far since the debate regarding the Fed’s next move is unlikely to be resolved in the near future…
ReSale TALES and a look at govies …
July 16, 2026 First Trust: Data Watch - Retail Sales Rose 0.2 % in June
…Implications: Consumer spending closed out the first half of 2026 on solid footing as retail sales matched consensus expectations in June and the underlying details of the report were strong…We like to follow “core” sales, which strip out the volatile categories for autos, building materials, and gas stations and is important for estimating GDP. This measure rose 0.4% in June and was running at a 9.1% annualized growth rate in the second quarter versus the first quarter average – the fastest quarterly growth rate in three years…
…The good news is that real retail sales have finally surpassed their peak from more than four years ago back in April 2022…
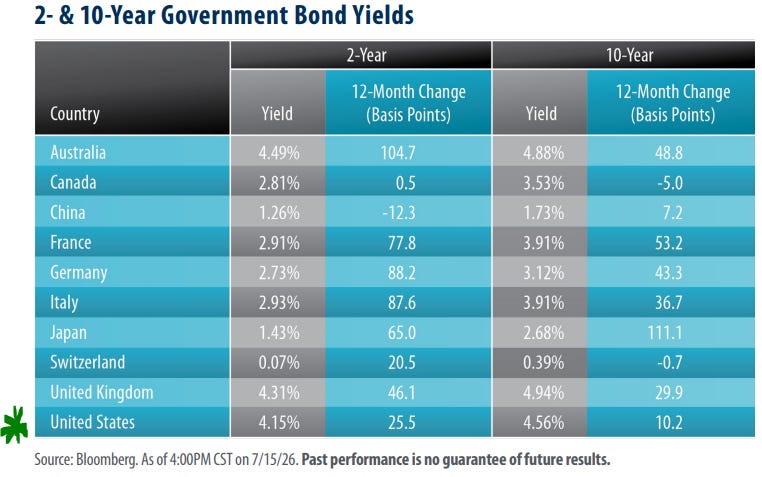
…Takeaway The Iranian war’s impact on global inflation has been notable, with surging energy costs pushing consumer prices higher across most major economies. As we see it, the short-term bond yields in today’s table likely reflect rising expectations of higher near-term interest rates. As the table shows, China was the sole country to experience a decline in 2-year government bond yields over the past year, with the remaining observations increasing between 0.5 bps (Canada) and 104.7 bps (Australia). While oil prices have come down from their recent highs, peace between the U.S. and Iran remains elusive, threatening to reverse this trend. In the U.S., the trailing 12-month rate of change in the consumer price index declined from 4.2% in May 2026 to 3.5% in June 2026. For comparison, the price per barrel of WTI crude oil fell from $105.07 on April 30, 2026, to $69.50 on June 30, 2026. That said, oil prices have spiked again amid crumbling peace negotiations, rising to $79.60 per barrel on July 15, 2026. While the war’s duration is unknowable, we expect a cessation of hostilities could bring rapid relief to surging price indices. Stay tuned!
ReSale TALES rebound = positive Q2 …
16 July 2026 INGUS retail sales point to a second-quarter consumer rebound
After a disappointing first quarter for consumer spending, retail sales data suggests we saw a rebound in the second quarter despite weak sentiment readings. Internet sales continue to outperform, with physical stores losing ever greater market share
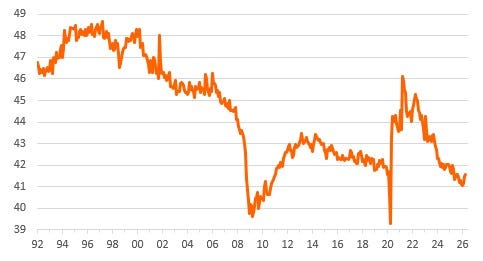
…Remember that we have experienced a 12-month period where real household disposable incomes have flat-lined – a highly unusual situation. This has most impacted medium- and lower-income households, with the combination of weak nominal income and employment growth plus elevated inflation prints constricting spending power and leading to a decline in the household savings ratio. Higher income households have been under less financial pressure and have been boosted by significant post-pandemic wealth gains – Federal Reserve data suggests that the top 20% of households by income hold 70% of the household wealth. These households tend to spend more of their income on services and experiences than middle- and lower-income households, who spend a greater proportion of their income on physical goods – as reflected within retail sales. The chart below shows that retail sales account for a declining trend overall of total consumer spending and suggests overall spending trends are likely to continue outperforming retail sales growth.
Retail sales as a proportion of total consumer spending
HAWK TALK … this what consumers need? I suppose the right side of the K don’t care … and if you take out energy from the picture, CPI (and swaps) can go lower …
Middle East tensions rise; Philly Fed rises to multi-year high; Fed's Schmid, Logan lean hawkish; Kospi drops 6.4% on leveraged-ETF curbs; chip selloff weighs on AI trade; DXY at 100.73 (+0.2%); US 10y at 4.55 (+0.6bp).
Hawkish Fed commentary and resilient US data pushed yields and the dollar higher, while a regulatory crackdown on leveraged trading in South Korea deepened a global selloff in chip and AI-linked equities.
…US Treasuries sold off modestly across the curve (2y: +0.6bp; 10y: +0.6bp; 30y: +0.4bp) as data reinforced a resilient growth picture. The Philadelphia Fed’s July manufacturing index surged to 41.4 (C: 12.5), the highest since 2021, a day after the Empire State survey also beat expectations. Weekly jobless claims fell 8k to 208k (C: 217k), the lowest since early May, while June retail sales rose 0.2% m/m, matching estimates. Kansas City Fed President Schmid said inflation remains “too hot” and has stayed above target for too long, while Dallas Fed’s Logan called for modestly higher rates to bring inflation back to target. Breakevens tightened across the curve (10y: -0.6bp; 30y: -0.7bp) even as nominal yields rose, suggesting the hawkish repricing was driven more by growth resilience than inflation expectations…
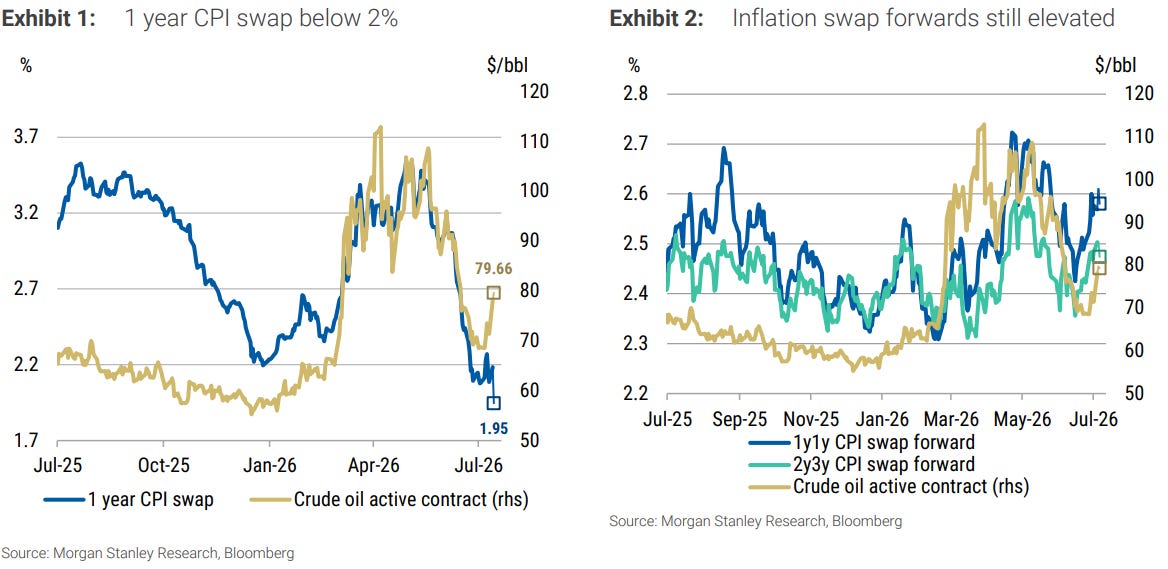
1y CPI swap is optically low because of base effects; 1y1y forwards and core CPI fixings remain elevated. As inflation keeps surprising lower with no second-order conflict effects yet, ex-energy CPI swaps can move lower and take Fed policy trough rate down. Maintain 10y TIPS with payer protection.
Key takeaways
1-year CPI swap below 2% signals no inflationary concerns at face value but it is distorted by base effects from high May 2026 CPI print because of oil prices.
In contrast, 1y1y CPI swap forwards is at 2.6% and 2y3y at 2.5%. Core CPI fixings in the range of 2.6% to 2.8% remain elevated vs our economists’ estimates.
After the print, only the June CPI fixing moved lower while later months were broadly unchanged, suggesting investors kept inflation path unchanged.
June CPI was soft across the board, with even supercore ex-airfares and hotels normalising on a Y/Y basis, showing the weakness went beyond volatile items.
We maintain long 10-year TIPS partial hedged with 1m10y payer swaption. We raise the stop by 5bp to 2.40%, and note the hedge is in the money, up ~40%.
The eighth in our series on the US consumer, with views from economics, credit and equities.
Key takeaways
Weak sentiment no longer reliably signals weaker spending; macro fundamentals matter far more in explaining consumer behavior.
Forward-looking expectations that are orthogonal to macro conditions emerge as a better sentiment signal for future discretionary real spending.
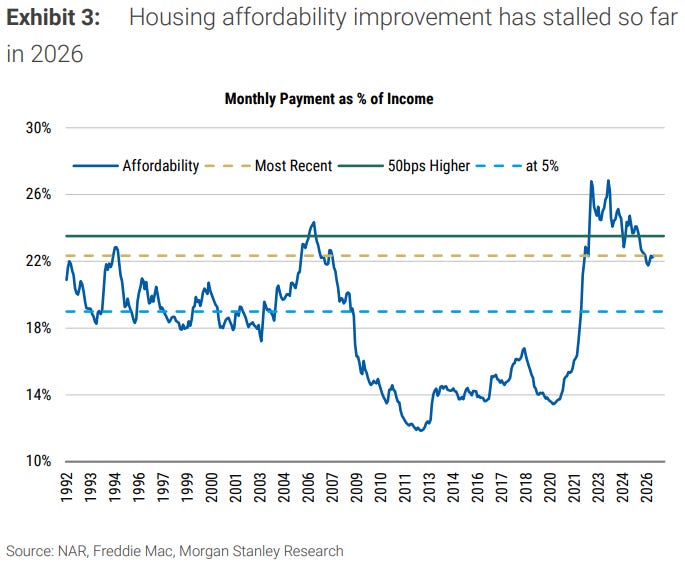
Housing affordability has plateaued and that is being reflected in purchase volumes. Homeowners remain supported as HPA has started to reaccelerate.
Consumer ABS continues to show middling performance. Auto ABS DQs fell, but less than expected. Unsecured consumer DQs improved, but partly due to mix shift.
Consumer sentiment and household finance outlooks improved in AlphaWise data. Inflation remains the top concern, suggesting resilient yet cautious spending.
ReSale Tales SAYS … decent and in line with expectations … HY upgraded. #GotJUNK?
16 July 2026 UBS: US Daily Data Recap Control group sales decent & in line
Retail sales at the control group of stores, which feed into GDP, increased 0.5% in June, in line with our expectations and continuing to show broad-based strength. A 1.9% increase in nonstore retail sales was potentially boosted by Amazon Prime Day shifting into June this year. Headline retail sales rose 0.2% in June, though prior months were revised up by a cumulative 0.4%. The headline was dragged down by a -5.3% decline in gasoline station sales, reflecting lower fuel prices, but was supported by a 1.9% increase in motor vehicle and parts sales. Sales at food services and drinking places showed less strength than we thought the world cup might have brought, but the May change was revised up notably…
…June control group sales decent & in line Sales at retail and food services stores rose 0.2% in June, versus the 0.4% we expected and the 0.2% expected by consensus. Prior months were revised up by a cumulative 0.4%. The headline was dragged on by a -5.3% decline in sales at gasoline stations (note that retail sales are a nominal measure and prices declined over the month). Headline sales were supported by a 1.9% increase in sales at motor vehicles and parts stores. We noted that nominal gasoline sales likely declined and that auto sales were likely supportive in June based on relief in retail gasoline prices and stronger lightweight vehicle sales over the month (see charts below). Excluding autos and gas, headline sales rose 0.4%, relative to the 0.5% expected by us and the 0.4% expected by consensus.
16 July 2026, 21:35 UTC UBS: Global credit strategy Upgrading HY to Attractive
Bond yields globally have increased in recent months, driven by a repricing of central bank policy rate expectations amid rising energy prices and possible second-round inflationary effects. We believe the total return outlook for the high-yield bond asset class has improved as a consequence.
Despite the rise in yields, total returns are positive year to date. This is due to the elevated carry and low duration profile, while credit spreads have been largely range-bound, even in the face of an energy price shock. We believe low spread volatility reflects a combination of ongoing stable economic activity, solid corporate balance sheet fundamentals, low default risks, and yield-based demand, factors which we believe are likely to persist.
Looking ahead, the combination of elevated yields, low duration, and low default risks suggest HY bonds are well positioned to deliver total returns over the next 12 months in the high-single-digit range. In our base case, we think total returns will be driven mostly by carry and duration, while HY spreads may widen modestly from here.
17 Jul 2026 UBS: The politics of price expectations
US Michigan consumer sentiment data is a weak economic signal. It does have political punch, via the inflation expectations measure. Consumers focus on the price of frequent purchases (food and fuel), and tend to fixate on the price level. Most consumers will have a “fair” price in mind as a reference, and for gasoline prices that is probably around USD 2.50 per US gallon. Gasoline remains well above that level—off its highs, but having risen recently.
Why does this matter? Because investors are looking for political pressure points that might produce US concessions, allowing a reopening of the Strait of Hormuz. US President Trump’s approval rating has correlated more strongly with the persistence of gasoline prices above pre-war levels than with the wilder swings in the price of crude oil.
Equity markets have fallen, led by technology stocks. Tech stock moves do not seem to be reflecting changing macroeconomic expectations, but their declines may feed back into the economy. Investment spending by tech companies has driven growth in some areas, though it has also potential sucked investment from other areas. Wealth effects, letting higher equity prices push up consumer spending, are less obvious…
Growth steady eddy, ‘flation remains sticky and a hawkish Fed … interesting discussion …
Wells Fargo: U.S. Economic Outlook: July 2026 Steady Growth, High Inflation and an Increasingly Hawkish Fed
Key Themes
The U.S. economy remains resilient but is unlikely to accelerate in the second half of the year. AI-related capex shows few signs of slowing, but its direct boost to growth continues to be partially offset by the surge in tech imports. The AI buildout has been indirectly supporting consumer spending through stronger household balance sheets, but consumption growth is unlikely to pick up meaningfully in the near term as support from tax refunds fade, real income growth remains soft, and the saving rate sits at a multi-year low. We look for real U.S. GDP to advance at a 2.1% annualized rate in the second half of 2026, broadly in line with the 2.2% year-over-year rate we estimate was registered through Q2.
The labor market is stable, not heating up. The June employment report revealed a cooler pace of job growth, with the three-month average pace of payrolls downshifting to 111K from 188K previously. And while the unemployment rate edged down last month, it stemmed from more workers leaving the labor force. We look for the jobs market to remain roughly in balance through the second half of the year, with unemployment hovering near its current rate of 4.2%.
Inflation remains the rub, although June data buys the Fed more time to assess the outlook. At 3.4%, the year-over-year rate of core PCE is at a two-and-a-half-year high. The pickup primarily reflects tariffs, the knock-on effects of higher oil prices, and surging demand for tech-related goods—the latter of which Fed officials seem to have a harder time looking through. But, the upturn in inflation showed hints of leveling off in June. The latest CPI and PPI data point to core PCE rising just 0.2% in June, which would be the smallest monthly gain this year and would push the 12-month change down to 3.3%.
The Fed has turned more hawkish. While we do not believe monetary policy is well-equipped to rein in the factors currently driving inflation higher, patience for returning inflation to 2% is clearly wearing thin at the Fed. Chair Warsh has been careful not to signal where he thinks policy is headed in the coming months. Yet, June’s evenly-divided dot plot, the latest meeting minutes, and recent comments from Committee bellwethers John Williams and Chris Waller suggest the bar for hiking rates is lower than it was a few months ago.
Our base case remains for the FOMC to stay on hold this year, but the potential for hikes is high. With the tariff shock fading and services inflation continuing to slow, we expect inflation to make some directional, if modest, progress in the second half of the year. We estimate core PCE will edge down to 3.2% on a Q4/Q4 basis, which would be consistent with prices rising a little less than a 3% annualized rate in the second half of the year. That said, renewed hostilities in the Middle East, unrelenting demand for all things AI, and an increasingly impatient FOMC create the risk that the Committee engages in a modest tightening cycle in the months ahead. With the FOMC already on the fence between holding and hiking, even a small upward adjustment to the inflation outlook would likely lead the FOMC to reverse some of last year’s cuts.
… Moving along TO a few other curated links from the intertubes. I HOPE you’ll find them as funTERtaining (dare I say useful) as I do … …
AND here we go, slow steady climb back UP (CPI, PPI and inverse sentiment to follow?) …
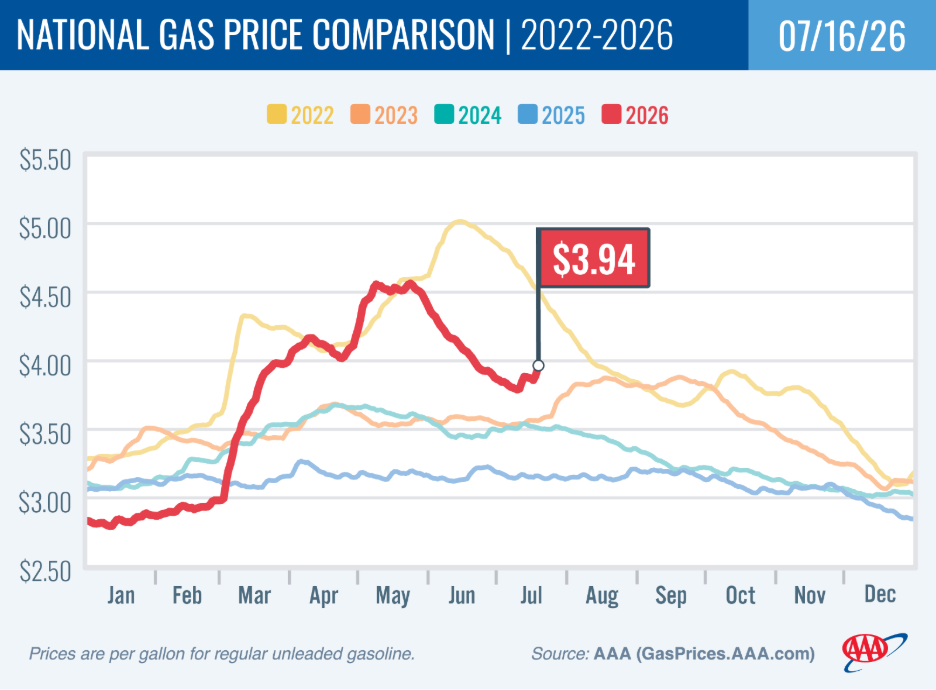
July 16,2026 AAA: National Average Moves Higher, Inches Toward $4 per Gallon
WASHINGTON, DC (July 16, 2026) – The national average for a gallon of regular gasoline went up 10 cents since last week to $3.94. Instability along the Strait of Hormuz is contributing to the increase at the pump and pushing crude oil prices toward $80 per barrel. Most states are still averaging less than $4 per gallon. Earlier this year, the national average remained in the $4 range all of April and May and most of June. Last time the national average was $4 or above was on June 17 when it was $4.02.
… the good Doctor SLOK says … the 'flation NOT going away. Why? Look TO labor mkts …
July 17, 2026 Apollo: The Labor Market Explains Why Inflation Won’t Go Away
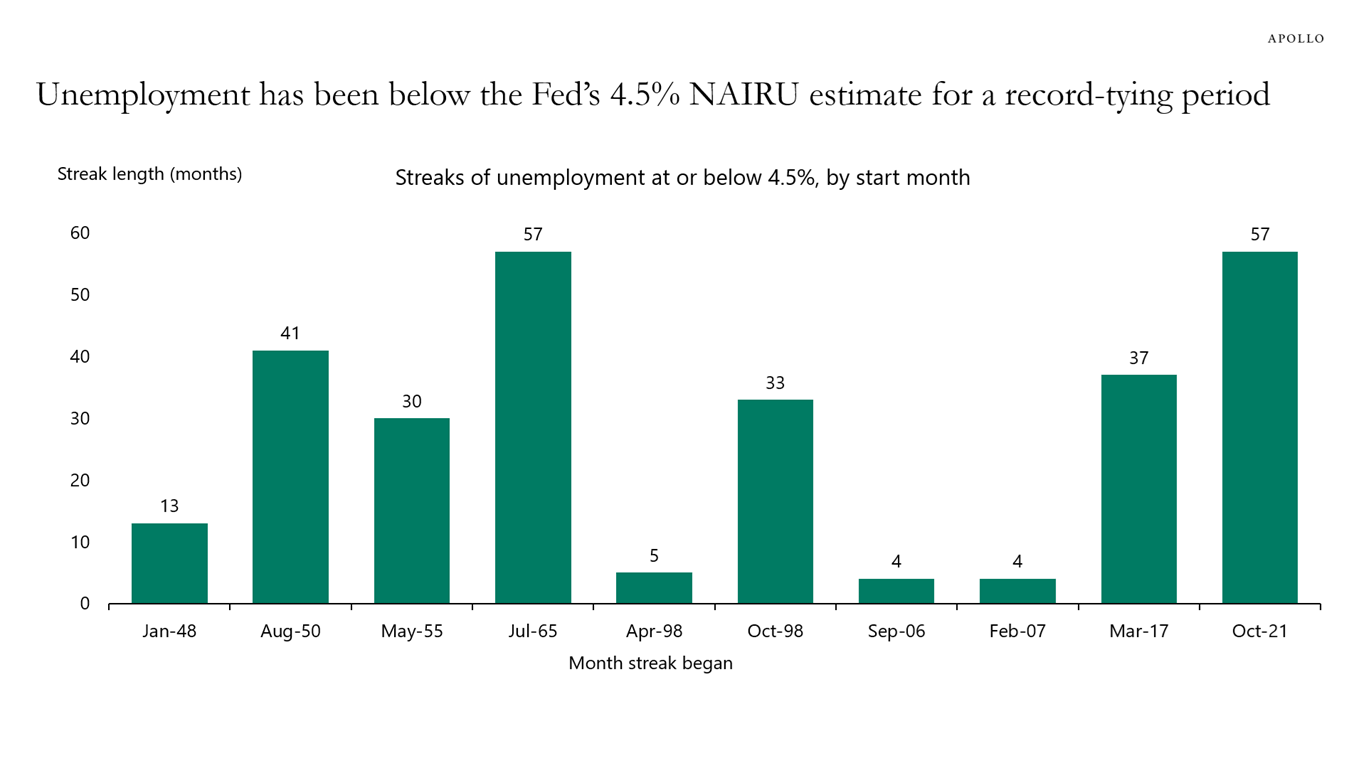
With the Fed estimating the non-accelerating inflation rate of unemployment (NAIRU) at below 4.5%, and unemployment having stayed at or below that level for 57 months, tied for the longest such streak on record, the labor market has been operating in excess-demand territory for an unusually long time. That persistent tightness is a key reason inflation has remained elevated: when unemployment runs below NAIRU, wages and prices face sustained upward pressure.
The chart below puts this streak in historical context. Prior episodes of sub-4.5% unemployment were typically far shorter. The current one is one of the longest on record, which helps explain why the ongoing inflation overshoot since 2021 has been so stubborn.
The bottom line is that a strong economy is the reason why inflation has been high, and only by keeping rates higher for longer can the Fed cool inflation down towards the FOMC’s 2% inflation target.
Terminal DOT COM with some words from LOGAN …
July 16, 2026 at 1:48 PM EDT BBG: Fed’s Logan Favors Modestly Higher Rates to Lower Inflation
(Bloomberg) -- Federal Reserve Bank of Dallas President Lorie Logan called for higher interest rates, saying inflation does not appear to be heading sustainably back to the central bank’s 2% target.
…“My primary concern is inflation, which is too hot and has been above target for too long,” Schmid said at an event in Nebraska. “As such, my focus remains on inflation in setting the correct course for policy.”…
Housing affordability has to be taking a hit, getting set back a bit …
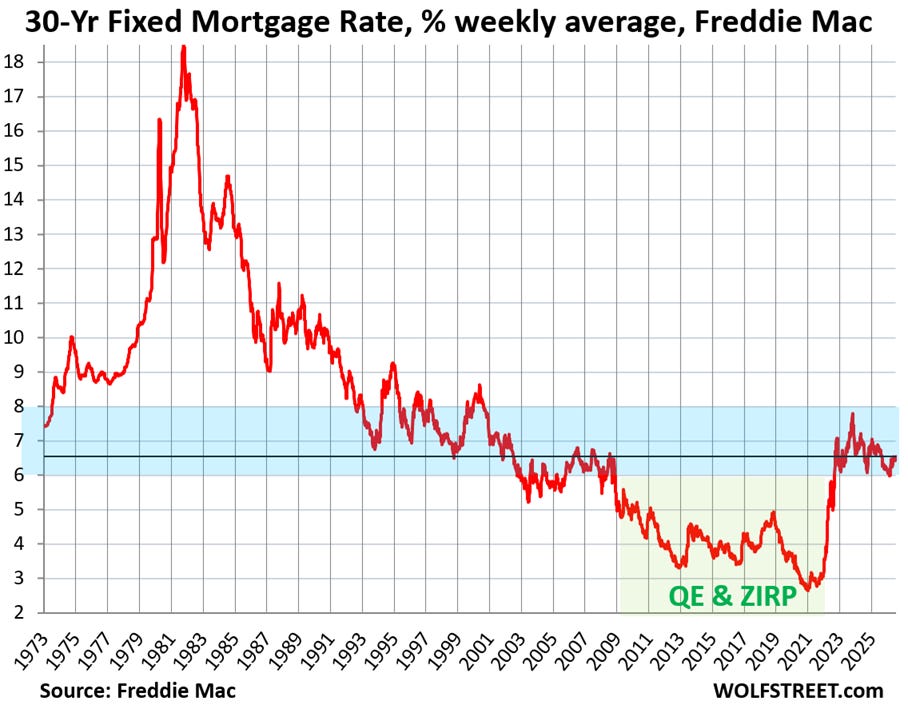
WolfST: Pending Home Sales Plunge to Near-Record Low in the Data, Hit Low in the West. Since then, Mortgage Rates Rose Further - Sales sag in all regions, plunge the most in the Midwest, drop to lowest for June in the South. Demand stuck in the deep-freeze.
Sales sag in all regions, plunge the most in the Midwest, drop to lowest for June in the South. Demand stuck in the deep-freeze…
…These mortgage rates are not high in a historic context. They’re only high in the context of the years of QE when the Fed purchased trillions of dollars of Treasury securities and mortgage-backed securities in order to artificially repress mortgage rates. This immense bout of money printing eventually triggered the worst inflation in 40 years and the worst home-price explosion on record, leading to home prices that are now too high and are a liability for the economy. Those too-high home prices are part of the hangover that the housing market is now trying to get over.
I hope some day we deal with the National Debt and Annual Deficits..