weekly observations (05/20/24): 30s on track for 3rd worst ann return since 1919 (BAML); get NEUTRAL (BARCAP covers short) and Scottie Scheffler showing up to Valhalla today ...
Good morning / afternoon / evening - please choose whichever one which best describes when ever it may be that YOU are stumbling across this weekends note…
First UP, some housekeeping as this place on the interwebs evolves and becomes whatever it becomes, I’d like to take a moment and say HI / thank you to all who’ve arrived.
I’d ALSO wish those who’ve left — or are, perhaps, about to — best of luck and hoping you find whatever it may be you are searching for.
Now, as this is (and likely to remain) and unpaid site, well, they say you get whatever you pay for (sorry) and I’ll begin with a LINK from ZH helping define what was yesterday and the week in the rear view mirror …
ZH: Dismal Data Sparks Dollar Dump - Everything Else Rips On Record Week
ZH: US Banks Suffer $80BN Deposit Decline, Money Market Fund AUM Rise As Stocks Soar
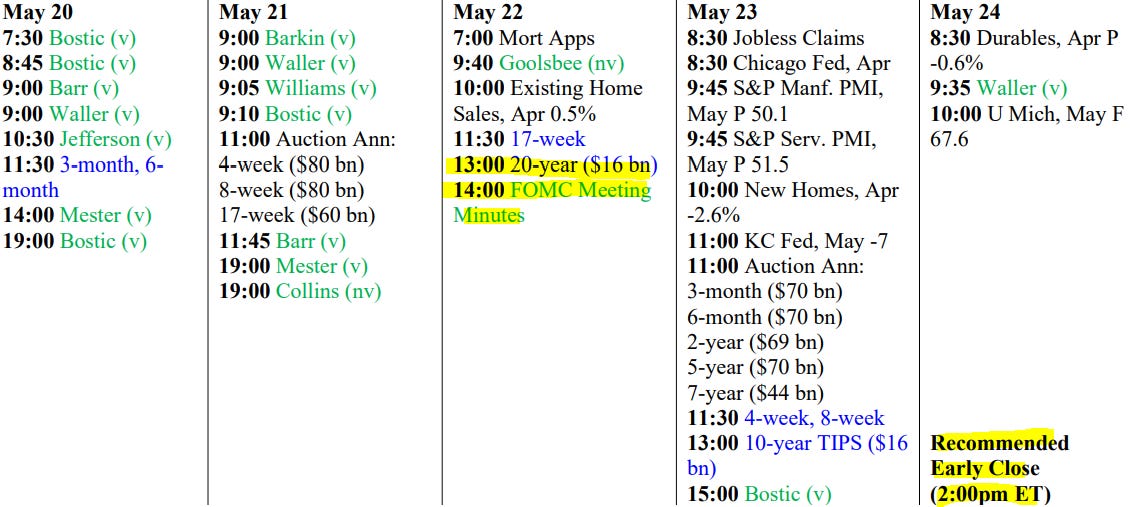
… Now, break out your HATS and I’ll hope someone with a more creative bone in their body than I gets one appropriate for us all on Wednesday when we’ve got the privilege of assisting The Hobbit finance the US of As national debt … with 20yr obligations. It is with THAT in mind, a look at the 2024 trend ….
… BEARISH BUT … when one views in a slightly longer-term context — ie WEEKLY — the picture becomes …
… make of it whatever you want, size your trades according to whatever your time frame IS and note full speaking calendar below … most all are voting FOMC members and I do not envy those in a seat trying to make heads / tails of comments and ‘red heads’ on The Terminal and square it all with the recent (near / far) data.
Suffice it to say, last I checked, JPOW and other hawkish FOMC members were, well, still hawkish — and so HIGHER FOR LONGER does cut both ways.
One COULD view said hawkishness as an aggressive anti ‘flation stance and so, read it BULLISHLY for the (longer-end of the)Treasury market.
At the very same time one COULD say it’s somewhat less bullish for the front-end.
So much for this year being THE year (again) for THE steepener?
… Ok I’ll move on AND TO the reason many / most are here … some WEEKLY NARRATIVES … Here are some of THE VIEWS you might be able to use. And while you may not find a comprehensive PDF this weekend (again, reference the pricing guide — freedom isn’t free but this ‘Stack IS), here are a couple / few of the things I’ve observed from my Global Wall Street inbox…
BAMLs Flow Show: The Hard Hedge (ah, the good ‘ole days … you know, The Covid !! ??)
… The Biggest Picture: total return of 30-year US Treasury -45% since Apr’20 (Chart 2).
… The Price is Right: 3Ps of Positioning, Policy, Profits argue for reversal of ABB trade in H2'24; 30-year US Treasury best "hedge" for weaker nominal growth; surprise rally in yields supportive for "leverage plays" China, UK, REITs, utilities...
… Positioning… investors very long cash, IG bonds, stocks/tech, some long 2-year UST to play Fed cuts, but no one long 30-year (annualizing 15% loss in '24 - Charts 3 & 4) on debt dynamics/concern slowdown = more fiscal excess; lower long yields v obvious "pain trade" in H2;
BARCAP: United States: Interest Rates (turning NEUTRAL)
Taking a breather
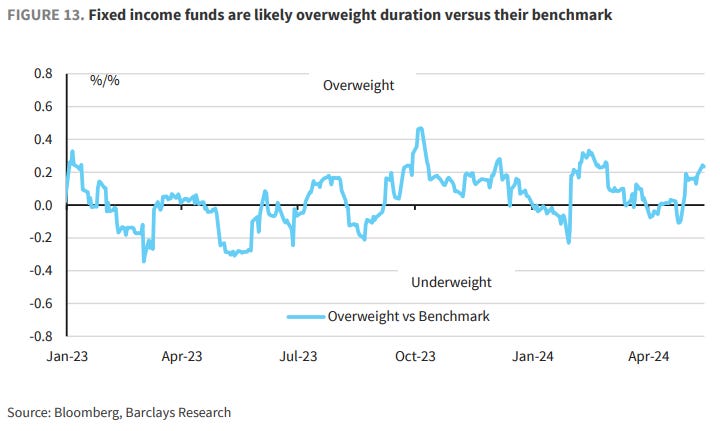
We are turning tactically neutral on our short 10y UST view initiated in early March. While the fundamental backdrop argues for higher rates, the positioning backdrop has become a hurdle in the near term, with our metrics suggesting short duration positioning in the leveraged community. We maintain short Aug'24 FF.… We also estimate duration positioning of fixed income funds that are indexed to the US Agg (estimated based on a regression of daily outperformance of a fund versus the benchmark and daily market moves, aggregated across major funds). Figure 13 shows that they likely turned from neutral duration in April to overweight duration recently.
One could look at the above and conclude that the rally would unwind quickly, as it is not justified by the turn in the data and likely has been exacerbated by flows. While very possible, we see the current short position of leveraged investors as a headwind to that view.
Figure 14 shows an empirical estimate of duration of macro HF/CTA investors (proxied using the HFRXM Index) by regressing daily returns on yield changes and risk asset returns. They appear to be quite short duration. Exponentially weighing more-recent data points suggests an even larger short duration exposure. This was not the case when we initiated the trade in early March.
Should data surprise to the downside, one might still get a larger reaction than would be justified.
… We believe long-term rates are low from a fundamental perspective. A few things of note …
BMO weekly, “The Fed Anticipates (i.e. Hopes)…”
… The bond bullish price action that has thus far defined May has brought the Treasury market to levels at which the path of least resistance has become an in-range consolidation … the data-lite calendar and the smattering of Fed-speak will leave investors in a persistent state of limbo – too soon to be convinced the Fed will cut but the mounting signs of cracks in the real economy advocate against approaching the Treasury market with an aggressive short bias. That being said, a tactical short in the case of another in-range rally should prove prudent, particularly if our expectations for the 200-day MA in 10s to continue holding in the near-term come to fruition. While we’re holding our 2s/10s flattener, the curve flattening trend is also vulnerable to a partial reversal – more from a technical perspective …
… For a new trade, we've set our sights on 4.53% as a level we'd look to buy a dip in the 10-year space. Benchmark rates opened CPI-day at 4.45% and reached as low as 4.41% in the lead-up to the 8:30am CPI/Retail Sales releases. Given the April 15th data showed that Q2’s inflation and consumption trajectory appears to be cooling – a trend that reinforces Powell's pushback against rate hikes – we like buying any dips that bring 10-year rates back above 4.50% as our medium/long-term bullish bias remains intact…
DB: Asset Allocation: Equities H2 Outlook: Adopting The Top Of Our Range
Coming into the year, our constructive view on equities saw valuations as relatively full, with upside driven by earnings, while multiples came in as the recovery priced in unfolded. We saw a range for S&P 500 EPS of $250-$271, conditional on macro growth outcomes, with the lower end seeing a mild US recession (house view at the time), the top end a continuation of above trend growth, an outlook we favored. The corresponding range for the S&P 500 we saw was 5100-5500.
Goldilocks: Global Rates Trader: Further Relief Requires Softer Data
… Less room for US rates to rally, but stay long belly …
… Treasuries
… Stay patient given risks of a later cut
Treasury yields declined on weaker-than-expected inflation and retail sales data, extending the month-to-date rally alongside downside data surprises that have reduced fears of a reacceleration in inflation...
...However, the April data doesn’t quell fears that the disinflationary process is halting, particularly as we expect core PCE to hold steady on a year-ago basis in April. In turn, this suggests risks the Fed might not be in a position to cut rates before the fall
We remain neutral duration: risks of a later cut suggest it’s too early to add duration as yields traditionally start falling 3- to 5-months ahead of the first ease, Treasury yields have already declined 22-28bp in May and we don’t want to chase this move, we are unsure of a catalyst that can impact Fed expectations in the near term, and carry remains punitive
We continue to hold 5s/30s steepeners as a core position ahead of the first ease, but we no longer think 2s/5s flatteners offer a good hedge for our long-end steepeners: this trade is trading bullishly and 2s/5s appear too flat relative to the level of yields …
… Technical Analysis
The 30-year bond breaks from its tactical pre-inflation data holding pattern, but fails to surpass key levels in the 4.40s. While the recent data relieved some of the bearish pressure, we need to see the market move back into the first quarter ranges to rebuild confidence in our bullish medium-term outlooks.
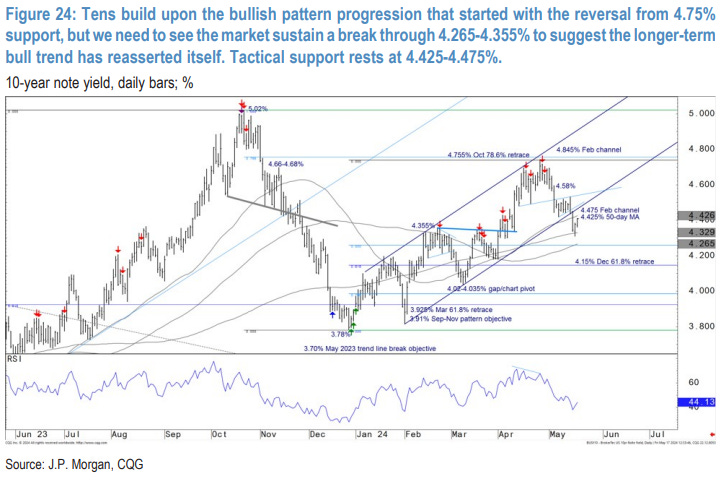
Tens build upon the bullish pattern progression that started with the reversal from 4.75% support, but we need to see the market sustain a break through 4.265-4.355% to suggest the longer-term bull trend has reasserted itself. Tactical support rests at 4.425-4.475%.
The 5-year note rally failed to carry enough inertia to sustain the break through 4.345-4.40% resistance. The tactical rally structure remains firmly in place while richer than 4.44-4.455%. Key breakout support rests at 4.565-4.60%.
Twos recoil again, after another rejection of the 4.694% Jan 38.2% retrace. While the market has yet to sustain a break back into the first quarter trading range, the price action richer than the 4.885-4.93% early-May pattern breakout still has a bullish tone. We think the rally will extend in the weeks ahead.
MS: The Rate Cuts Are Coming! | Global Macro Strategist
Not the redcoats, the rate cuts, although rate cuts are coming to Britain too. Rate cuts aren't easing if they simply match lower inflation rates and reflect already priced in policy paths. We suggest investors stay long duration and prepare for the policy pricing pendulum to swing again.
MS Friday Finish – US Economics: July's Too Soon (but … they are comin’, right?)
Data this week helped push market pricing back toward two rate cuts this year, and the July FOMC has become a plausible live meeting. We think the market is still underestimating the number of moves this year, but the Fed will need more evidence to start cutting. See our updated roadmap within.
SocGEN Global Strategy Weekly (Albert Edwards …)
Is the Fed making yet another massive policy error?
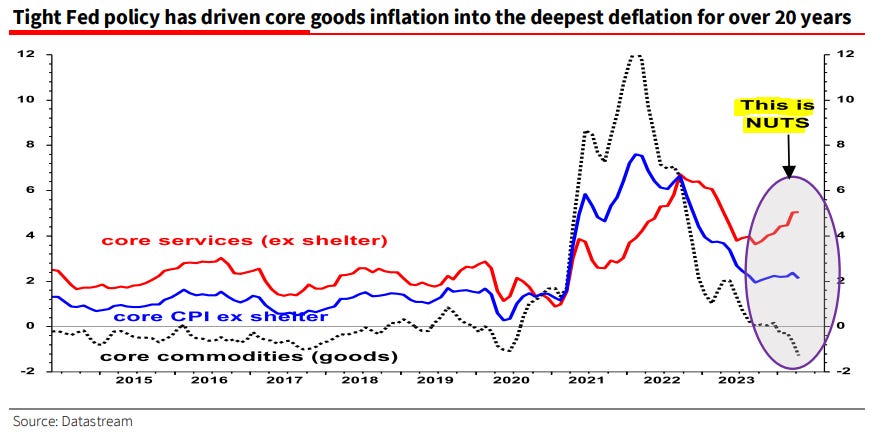
I believe the Fed is sowing the seeds of yet another policy disaster. Having let the inflation cat out of the ‘transitory’ bag, it now seems determined to regain its credibility by driving CPI inflation all the way back down to its 2% target. This has led to a huge divergence between goods and services inflation. This policy error is the mirror image of the mistake the Fed made after the 2008 Global Financial Crisis, the very mistake it was castigated for by former Fed Chair, Paul Volker, back in 2018.One swallow does not make a summer
Markets have felt better about 2024 rate cuts after a US CPI print which, for once, did not beat expectations. Markets should be careful about extrapolating further moderation in US inflation. Equally, a June ECB rate cut should not make markets too excited about the prospect of more summer cuts. While all remains in play in our view, investors should favour Bunds vs Treasuries during the countdown to ECB cuts, and they should continue to be mindful of carry in what could prove to be a rangy market.Wells Fargo: Weekly Economic & Financial Commentary
… Interest Rate Watch: Fed Rate Cuts Back on the Table?
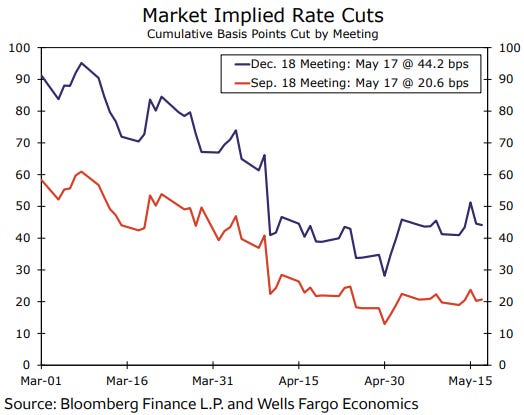
Market participants have significantly dialed back their expectations of the total amount of Fed easing this year, but recent data keep a 25 bps rate cut at the September meeting in play.
… Moving along and away FROM highly sought after and often paywalled and Global Wall Street narratives TO a few other things widely available and maybe as useful from the WWW
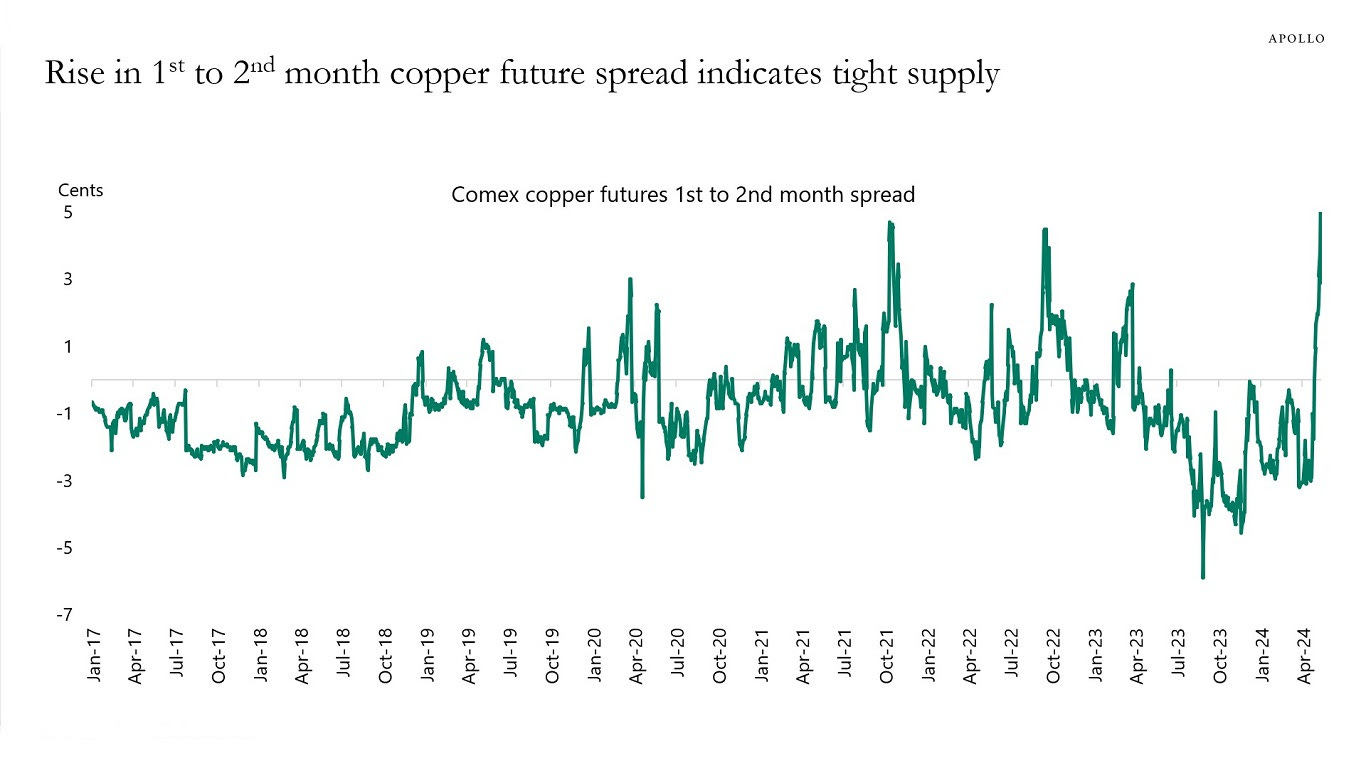
Apollo: Why Are Copper Prices Going Up?
Copper prices are rising due to supply shortages, hedge fund speculation, China demand, AI demand, and green energy demand. For more, see our chart book available here.
Calafia Beach Pundit: Charts with a message
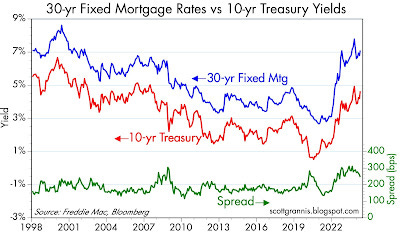
… The charts which follow have several messages: 1) interest rates are high enough to cause some serious problems in the housing market, while at the same time boosting the dollar and keeping downward pressure on commodity prices, and 2) some sectors of the economy—manufacturing, international trade, small businesses, commercial real estate, and the service sector in general—are struggling even as the high tech sector continues to boom and corporate profits are showing healthy growth (which is why the stock market is moving higher).
Chart #1
The average rate on mortgages held by the public is 3.9% or so, whereas the current mortgage rate for new 30-yr loans is 7.2%. This creates a powerful incentive to avoid selling one's home, because acquiring a new mortgage is extremely expensive. It also depresses the demand for housing because 7.2% mortgage rates make home prices quite unaffordable for the vast majority of people. Housing supply and demand are both very constrained, with the result that the market is not likely in an equilibrium situation. Conditions could change dramatically at any time.
Chart #1 also shows that the spread between mortgage rates today and 10-yr Treasuries (the backbone of the mortgage market) is elevated. Why? Because investors are reluctant to buy 30-yr mortgages that could turn into very short-term interest rate loans should Treasury yields decline (because those who borrow at today's high rates would rush to refinance if rates fell). In sum, homeowners don't want to sell, buyers don't want to buy, and lenders (investors) don't want to lend. Again, this is not a healthy market and these conditions cannot persist much longer…
FEDS Notes: Why Do Mutual Funds Invest in Treasury Futures?
… Mutual funds can use futures either to hedge or amplify interest rate risk. To understand how futures contribute to the portfolio interest rate risk, we examine the time-series and cross-sectional patterns of duration adjusted Treasury exposures. The left panel of Figure 5 shows the duration exposures, measured as the dollar value per one basis point decrease in interest rates (DV01), that are sourced through Treasury securities and futures. The DV01 sourced through Treasury futures is much smaller than the notional value of these exposures, largely reflecting mutual funds' preference for shorter Treasury futures tenors and, to a smaller degree, offsetting short positions. Overall, futures contribute just 7 percent of the overall portfolio DV01, while Treasury securities contribute 31 percent. As shown in the right panel of Figure 5, Treasury futures exposures appear larger if measured on a net notional basis – allowing for an offsetting between long and short futures exposures without regard to duration.
… Overall, this comparative analysis shows that futures usage in mutual funds is associated with greater risk taking, greater flow volatility, and higher expense ratios. These findings suggest that although mutual funds have various uses for Treasury futures, many funds use the embedded leverage in futures to increase portfolio risk and reach for yield. An important limitation of our analysis is that it is based on a simple comparison between groups of mutual funds according to their futures usage. More work is needed to establish causal relationships.
Sitka Pacific: The Standard 60/40 Portfolio Yield
The underlying yield of a standard 60/40 portfolio of U.S. stocks and bonds is shown below.
After reaching a record low of 2.14% in 2021, the underlying yield of a standard portfolio has risen to 3.46% at the start of the second quarter 2024. It remains near prior secular lows of the past century, which marked the beginning of extended periods of low returns.
… AND for any / all (still)interested in trying to plan your trades and trade your plans in / around FUNduhMENTALs, here are a couple economic calendars and LINKS I used when I was closer to and IN ‘the game’.
First, this from the best in the strategy biz is a LINK thru TO this calendar,
Wells FARGOs version, if you prefer …
… and lets NOT forget EconOday links (among the best available and most useful IMO), GLOBALLY HERE and as far as US domestically (only) HERE …
THAT is ALMOST all for now.
In case you missed it …
at NUCLRGOLF
I HOPE I’ve not let you down (again) and to all the newcomers — WELCOME … and to all about to leave … well, best of luck to you!! I hope you find whatever it is you are searching for … Enjoy whatever is left of YOUR weekend …








you dont do the summary of weekly narratives in pdf anymore? that was excellent wrap up
still amazong work though
Excellent work !!!