This is NOT, repeat NOT in any way / shape / form, similar to Friday night, August 5th, 2011, at least NOT in my humble opinion … YES, equity futures traded down (ZH below) and am sure bonds will catch a bid … watching, waiting and catching up through the inbox after a few days off for good behavior.
I apologize for what follows as I attempt to catch back up to Global Markets speed.
Good morning / afternoon / evening - please choose whichever one which best describes when ever it may be that YOU are stumbling across this weekends note…
I’m BACK … back in the New York Groove and just in time (Knicks, NYY!!) …
Ok … you get the idea … Hey, don’t AT me bro. I got in late and missed the Moody’s announcement but did NOT miss the tip or a pitch!! Thankful for those at ATC in / around NY / Philly area doing their thing!! Travels weren’t without their moments and not completely without a hitch but suffice it to say I was impressed. Had I missed some of the games, well, my view might be somewhat different…
Onwards and upwards. Thanks for your patience in my brief absence and as you’d imagine, I’ve got a bit on my mind …
First UP, everyone will be talking about this one so I suppose I’ll follow the crowd here, as much as it pains me.
Friday night and … ratings agencies weighed in with a view and what seems to be another effort to stay relevant …
…The downgrade reflects our opinion that the fiscal consolidation plan that Congress and the Administration recently agreed to falls short of what, in our view, would be necessary to stabilize the government's medium-term debt dynamics.
More broadly, the downgrade reflects our view that the effectiveness, stability, and predictability of American policymaking and political institutions have weakened at a time of ongoing fiscal and economic challenges to a degree more than we envisioned when we assigned a negative outlook to the rating on April 18, 2011…
We’ve heard this all before and know how it went / is going. Back to my short story…
We were having a few friends over on a Friday night after work, drinks, fire pit, the whole ‘nine’ and then the headline hit.
At the time, I was one of those, ‘armed <with a Bloomberg Terminal'> and dangerous.
And so it began … a long weekend ahead as I was to Start Spreadin’ the News ahead of Sunday evening opening so as to help those covered, not miss a beat.
Markets were extremely volatile and to best of my recollection, everyone assumed it was bearish for everything USD but that saying where, ‘truth is stranger than fiction’, well, this was one of those times.
USTs actually went BID and, to some degree, one might assume the message was lost on various TRADING desks and market makers.
It was fun, don’t get me wrong, but I gotta tell you those at the house that Friday night, didn’t seem to understand or care, frankly, why I looked like I’d seen a ghost.
At that time, nerves still quite tense on heels of the ‘Great Financial Crisis’ — nothing GREAT ‘bout it — and I knew what was coming, at least in terms of increased vol (so, VIX and MOVE).
I also knew at that time (Friday evening) what I didn’t know. Another of those many times where I felt like if you gave me the answers ahead of time, I’d still only have a 50/50 chance at GUESSING Mr. Market reflex to it.
Or at least brutally honest enough to myself, my friends and clients at the time, to admit it.
It was one of those moments to keep your friends close (and your stops closer).
And that’s just what we did and soon as the trend and trade emerged, it was clearly more a risk OFF event supplying a bid TO UST complex than any of the authors of the report might have desired or thought.
That was then and this is now and frankly, this a long time coming. The bloom is off the rose and I’d really not expect much of a markets reflex (at least not relative to prior experience) but would fully expect the political class to be up in arms.
Prepare for I TOLD YA SO (both sides of the aisle) and a continued lack of action.
Moody’s extremely late to the game BUT to their credit, a reminder as to what is on their minds last night, while most everyone watching NYK and NYY have a day (or was it only me ;)) …
MOODY’S RATINGS Rating Action: Moody's Ratings downgrades United States ratings to Aa1 from Aaa; changes outlook to stable 16 May 2025
New York, May 16, 2025 -- Moody's Ratings (Moody's) has downgraded the Government of United States of America's (US) long-term issuer and senior unsecured ratings to Aa1 from Aaa and changed the outlook to stable from negative.
This one-notch downgrade on our 21-notch rating scale reflects the increase over more than a decade in government debt and interest payment ratios to levels that are significantly higher than similarly rated sovereigns.
Successive US administrations and Congress have failed to agree on measures to reverse the trend of large annual fiscal deficits and growing interest costs. We do not believe that material multi-year reductions in mandatory spending and deficits will result from current fiscal proposals under consideration. Over the next decade, we expect larger deficits as entitlement spending rises while government revenue remains broadly flat. In turn, persistent, large fiscal deficits will drive the government's debt and interest burden higher. The US' fiscal performance is likely to deteriorate relative to its own past and compared to other highly-rated sovereigns.
The stable outlook reflects balanced risks at Aa1. The US retains exceptional credit strengths such as the size, resilience and dynamism of its economy and the role of the US dollar as global reserve currency. In addition, while recent months have been characterized by a degree of policy uncertainty, we expect that the US will continue its long history of very effective monetary policy led by an independent Federal Reserve. The stable outlook also takes into account institutional features, including the constitutional separation of powers among the three branches of government that contributes to policy effectiveness over time and is relatively insensitive to events over a short period. While these institutional arrangements can be tested at times, we expect them to remain strong and resilient…
… the last part of the excerpt (FULL NOTE HERE) noted will NOT likely draw as much attention as the downgrade itself because it’s a bit of realism and not that controversial OR negative, frankly.
It’s not as incendiary as the headline and wont ‘sell as many newspapers’.
… We’ve heard this all before and know how it went / is going. Back to my short story…
The downgrade, in general, reflects a perspective I’d think both sides of the aisle would concur with. I’d even think we’ve heard similar language, tone and concern from various Fed chair over the years.
This is real and while S&P and Fitch had already gone ‘there’, suggesting as much, well, Moody’s now simply catchin’ down to the narrative.
This will inevitably lead to conversations of relevance and attempts to stay in the news cycle. There will likely be political motivations as an overture and by days end, I’d THINK you’d find it difficult to disagree with reasoning and logic behind the downgrade itself.
I’d ALSO think you’d still find it difficult to replace USDs (and so, USTs) with any other deep, liquid market, which could then be a substitute. When you think of one, please let me know. We’ll have to see what consequences are — will there be those forced to sell as, say, USTs aren’t AAA any longer?
Lot of moving parts and very least of which I’ll consider in the days ahead is TDS and whatever motivation / part of Moody’s this all might be.
Folks gotta get OVER it and read / re read the book.
On that note, one more quick story / visual about tariffs and trade.
Mentioned I’d be out amongst real people and here’s just one observation from the Savannah River …
Note all in disbelief and impressed by the size and magnitude of … INCOMING CARGO … but wait, there was this the very next morning ‘bout 6a …
… Alrighty, then.
Seems to me, trade didn’t all of a sudden come to a grinding halt. Who’d a thunk it??
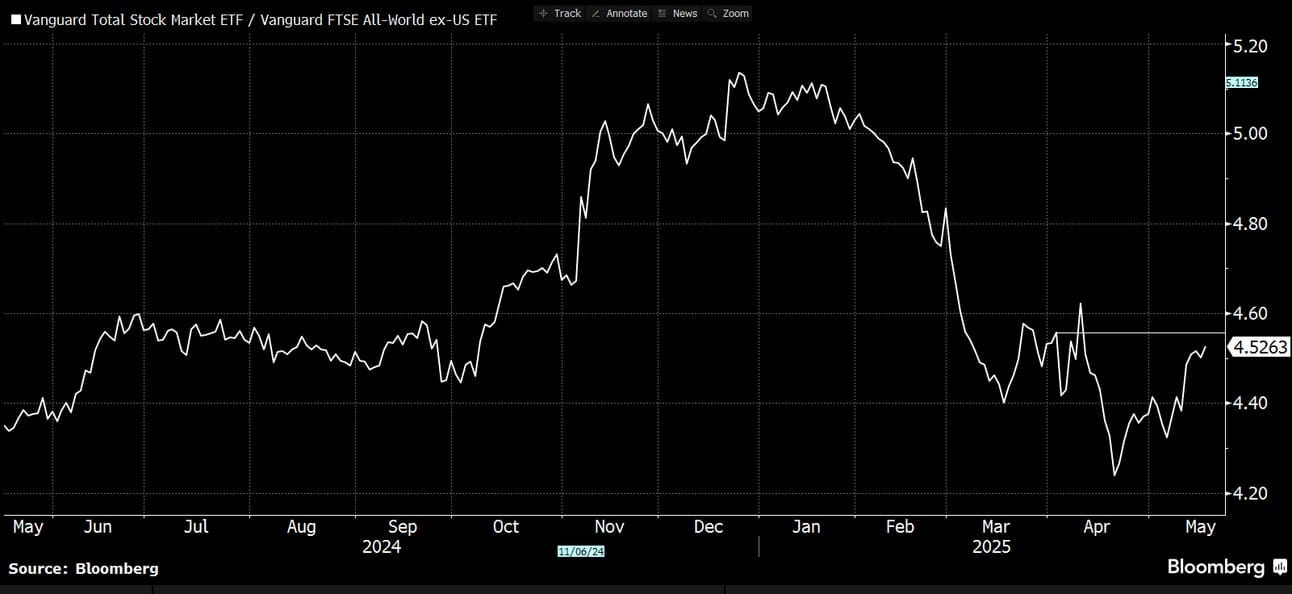
Seeing these vessels sorta made me pause and think about 5yy vs 4.10, for example.
… and with those vessels above and the DAILY price action — hugging of DOWN TREND LINE with oversold momentum (stochastics, bottom panel), one could / should be forgiven IF a bit confused.
I often find myself sayin that if yer NOT confused, yer NOT payin’ attention.
For somewhat more, kindly refer TO some levels below by none other than BAML (Paul Ciana, formerly of BBG) and CitiFX — best techAmentalists I’ve had privilege to read over the course of my (~30yr) career).
Technicals schmecnicals aside, with CPI in the week just passed and in light of vessels continuing to move freely in / around town, well …
I’m done for now. More to come on Moody’s and all …
I’ll move on TO some of Global Walls WEEKLY narratives — SOME of THE VIEWS you might be able to use. A few things which stood out to ME this weekend from the inbox … many of these written and sent BEFORE Moody’s … THAT will pass along whenever / if ever I get it but for now …
What better place to begin than global economics, a most catchy title and oh, yeah, an updated narrative and dart throwing results NOW suggesting NO RECESSION and less ‘flation and wait, what … a Fed on HOLD for longer …
The surprise US-China tariff deal removed worst-case economic scenarios. Given how much policy uncertainty remains, however, amid a continuing stream of new deals, the sharp market rally looks vulnerable. The focus now turns to the US budget and Europe's and China's activity data.
…US Outlook Wait wait ... don't tell us Uncertainty about the US outlook remains elevated amid a shifting policy landscape. With China tariffs cut dramatically, we now expect the US to sidestep a recession with less inflation, positioning the Fed for a longer hold. But with fiscal and trade policy developments still fluid, stay tuned.
We have upgraded our baseline to reflect the latest tariff policy developments. With China tariffs cut dramatically, we think the US economy will slow in 2025, but avoid a recession, and that the run-up of inflation will be less pronounced. We think the FOMC remains on hold until December, then cuts three more times in 2026, presuming that the tariff-driven stagflationary impulse unwinds.
Incoming data are difficult to interpret due to tariff-related crosscurrents, but we detect early signs of an stagflationary impulse that seems poised to intensify. April retail sales estimates suggest that frontrunning is still likely supporting consumer goods expenditures, with payback effects from earlier consumer stockpiling in some categories only beginning to take shape.
Policy remains highly uncertain and fluid. Tariff policy is still evolving, with the President seemingly eyeing a return to country-specific reciprocal tariffs. Meanwhile, congressional negotiations have reminded that the budget reconciliation process implies two-sided risks to fiscal impetus, with hardliners standing in the way of a House proposal that features frontloaded tax cuts and delayed spending cuts. Although Moody's US debt downgrade from Aaa to Aa1 further complicates the reconciliation process, we doubt that it will affect the outcome on the margin.
… same shop bit earlier in the week, ahead of the Moody’s (not so)news …
The House version of the tax bill adds several trillion dollars to the US 10-year deficit, more than appears at first glance. With the deficit already at 6.5-7% of GDP, investors in longer US bonds are unlikely to be happy.
Moving back across the pond to THE bank of our land … a couple / few notes and thoughts … interesting mention they are noting some upside risks to their f’casts and so, this narrative not YET following price … staying tuned …
16 May 2025 BAML: Global Rates Weekly Going places together
…Rates: Liberation retracement US: We are underweight rates near term as the market pares back ’25 recession risk. We stay underweight front end, like Z5-Z6 flatteners, and 10s30s steepeners.
… We hold our current US rate forecasts stable but acknowledge upside risks. Our end ‘25 forecasts: 2y = 3.75%, 10y = 4.5%, 30y = 4.9%. Our forecasts vs forwards: 2Y f’cast now below forwards (3.87%) but 10 & 30Y in-line…
… Bottom line: we are underweight rates near term due to a reduction in recession risks. We are most confident to be paid the US front end (fading of ’25 rate cuts) & underweight the back end due to fiscal expansion & supply / demand dynamics. We think belly longs are more compelling with Z6 around 3.75% or 2-5y OIS 4-4.1%; Z5-Z6 is another way to position for pushing out of Fed cuts to ’26 with inflation drops. US asset pessimism is high; if US growth remains resilient global UST sentiment may shift.
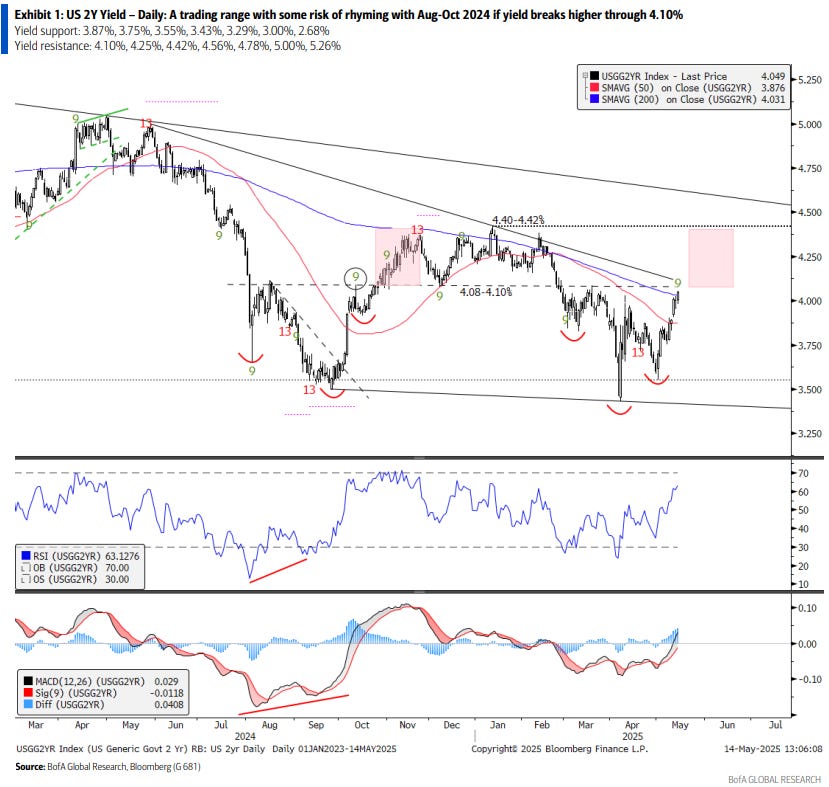
…Technicals: Deals for yields Upside risks for US yields continue to materialize. Multiple trend continuation patterns & MACD signals imply they still do. US2Y may be repeating Aug-Oct 2024 when it grinded up to 4.40%. US5Y yield is breaking above a trend line and 50wk SMA. US 10Y & 30Y yields show two uptrend continuation patterns. After a dip, we see the US 10s30s curve steepening to 55-65bps.
… US 2Y Yield: 3.50-4.10% range. Aug-Oct 2024 repeat risk? Trading rangebound between 3.50-4.10%. Short-term, we see similarity in the Mar-May 2025 period with that of Aug-Oct 2024. A break above the 200d SMA and trend line in the 4.08-4.10% area can trigger upside to 4.25% and 4.40%. Medium-term, the downtrend channel remains with yield resistance at about 4.20%. A weekly close above it increases upside risk to 4.42% and 4.75%.
US 5Y yield: Upside breakout above trend line, 50wk SMA After forming a head and shoulders base in favor of upside, yield is breaking above a trend line and pursing wave C up to 4.20% and 4.35%. We see upside risks developing in the weekly chart, too, which can imply a rise to about 4.50%.
US10Y Yield: Two uptrend continuation patterns Patterns in April-May imply upside risk for yield. This includes a wedge continuation pattern and a head and shoulders continuation pattern. A dip over the next few sessions as indicated by the TD Setup signal may precede a move higher to 4.59%, 4.66% and 4.72%. Ideally yield does not break above 4.80% for a cyclical bull market bias to remain. The weekly chart leaves us with many questions however the MACD turning up says yields can go higher with our most bearish scenario estimating a rise to 5.30%.
US30Y Yield: Uptrend continuation patterns, rising MACD We see a wide trading range between 4.30-5.02% with upside risk due to two trend continuation patterns. The consolidation since the April peak formed a flag pattern and a head and shoulders pattern. Together they suggest upside potential to 5.02%, 5.17% and possibly 5.33%. If the move in 2023 repeats, there is risk that 30Y yield sees 5.50%.
16 May 2025 BAML: The Flow Show More Jaw-Jaw, less War-War
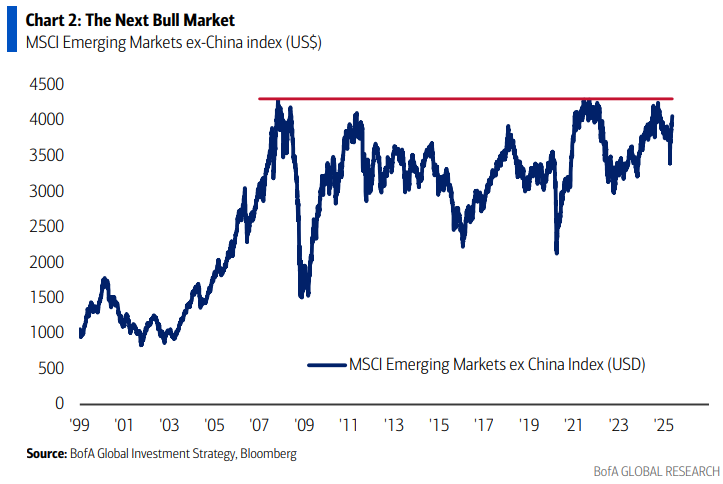
…The Biggest Picture: the next bull market…weaker US dollar, US bond yield top, China economic recovery…nothing will work better than Emerging Market stocks (note EM ex. China index up 20% past month, set to break out of 20-year trading range - Chart 2).
Best in the biz (b/4 Moody’s, time / date stamp noted) offering some insights as to longer run dots and current (ie TRADING BIAS) approach — noteworthy when best in show stopped OUT of long 2s … said another way, traded out bulls …
In the week ahead, the US rates market will have remarkably little fundamental information from which to derive trading direction. The weekly jobless claims figures top the list in terms of relevance – which is more a testament to the dearth of economic data than it is to the importance of claims. The slate of Fed-speakers is full, albeit skewed toward the beginning of the week. Investors have been looking toward monetary policymakers for an update on the Fed’s reaction function to the developing trade war only to be left with little more than the well-worn ‘wait-and-see’ mantra. While we’re certainly sympathetic to the Fed’s unwillingness to speculate on the degree to which tariffs will influence the real economy and therefore the direction of policy rates, investors are increasingly viewing the market impact of the trade war as having peaked in the wake of Liberation Day. The 90-day pauses on 'reciprocal' and Chinese tariffs indicate a degree of de-escalation that has afforded investors an excuse to step back from trading every tariff headline.
This reprieve has also implied a less hurried process in negotiating bilateral trade deals. While 90 days is unlikely to be sufficient to reach agreements with all the nations doing international trade with the US, it’s enough time to at least achieve material progress with the US’s larger partners. Moreover, investors are viewing the 90-day pauses as renewable if final deals have yet to be reached, but all sides are negotiating in good faith. Of course, we’re outlining the current interpretation of recent developments and this perception could easily shift once the eleventh-hour approaches and Trump’s rhetoric heats up again. For now, optimism has overtaken the post-Liberation Day pessimism and the incoming economic data has been viewed as stale because it doesn’t fully incorporate the new tariff regime.
This begs the question: when will the market and Fed have sufficient confidence as to the extent that the trade war will increase inflation and weigh on growth? Next month’s FOMC meeting will be viewed as an ideal forum for a fuller discussion of the implications from the trade war. The logic is relatively straightforward; there ‘should’ be enough progress on bilateral trade deals that estimates for the increase in the average tariff on imports to the US will be in a narrower band – although lacking the certainty policymakers would prefer. The looming SEP will also allow the Fed to put updated projections on the impact to the real economy. Investors are savvy enough to view even June’s estimates as a work in progress. After all, SEP revisions are a quarterly pastime.
The recent price action in the Treasury market points toward a further consolidation as the crosscurrents of slowing realized inflation and forward inflationary angst leave investors unwilling to chase Treasury yields outside the current range. Assuming that the Fed rhetoric remains largely on-message and risk assets are well-behaved, the path of least resistance will be toward marginally lower yields. We’re not anticipating a sharp rally in duration, rather a grind that leaves 10-year yields in a range between the 200-day moving-average of 4.23% and the 4.55% double-top. The near-term direction of the curve is more uncertain as 2s/10s appears wedded to the range of 42.4 bp to 58.7 bp as the 200-day moving-average has crossed into positive territory in early-March and currently stands at 19.7 bp – solid support in the event of a strong flattening push. The long-bond rejected 5.00% twice already since Liberation Day, and we’d be surprised to see a handle-change in 30-year yields revisited anytime soon…
…Strategic Bias 10-year rates have spent much of the last week trading in the top quartile of the post-Liberation Day range but with Treasuries having rallied off the local lows, the next move is likely to be a consolidative sideways shuffle with a modest bias for lower yields. The combination of CPI, PPI, and Import Prices has left April core-PCE estimates tracking at a benign +0.1%, as the prevailing disinflation trend has offered an encouraging departure point from which to begin absorbing tariff-driven inflation in the coming months. Even so, Fed-speak continues to suggest that the FOMC's hands will be tied by elevated policy uncertainty for the foreseeable future and with the real economy on solid footing, steady policy rates have become the path of least resistance for the coming meetings.
…Trading View …As a brief summary of our recent trading activity:
Stopped out for a loss on our long position in 2-year notes (entered on Thursday, May 8th at 3.90%) on Wednesday at 4.04%.
Shorted 10-year breakevens on Wednesday, May 14th at 237 bp. We set our stop level at 246 bp (above the multimonth high close from March 27th at 240 bp). Our initial target is set at the NFP-day close from May 2nd at 227 bp.
… here are a few words from a rather large French operation, time / date stamped as best I could and a couple / few items on my weekend reading list …
12 May 2025 BNP Global: The larks, still bravely singing, fly
KEY MESSAGES
The pause in the trade war between Washington and Beijing leaves open the possibility that the US economy can avoid a recession. However, we still expect high inflation, a soft patch in growth and an FOMC on hold into next year.
The news will do little to alter the structural shift in policymaking in Europe. We continue to expect this structural shift to result in higher medium-term growth, inflation and policy rates in the eurozone.
Rates: Recent tariff changes could reverse market conviction in curve steepeners as markets price out rate cuts and get better optics on budget deficits, with foreign demand possibly returning. Curve flatteners are the US rates version of the “buy America” trade.
FX: US-China tariff de-escalation could put near-term pressure on EURUSD and other currencies with significant US investment as the market revises US growth expectations higher. However, we ultimately maintain our bullish EURUSD stance as policy uncertainty is likely to persist.
US economics: Our base case economic view, from 10 April, entails a moderation in tariffs to still-high levels and a firm pivot away from tariff brinksmanship. We see today’s US-China announcement as encouraging news that suggests this outcome is on the path to being realized. Thus far, businesses have refrained from laying off staff, closing plants or curtailing investment on the view that tariffs would be moderated and tariff-related uncertainty would fade. This confidence has helped the US economy avoid passing the point of no return for recession, and should tariff policy continue to support that confidence, we believe a recession is avoidable.
The delivery of this news, and the process seemingly being led by Treasury Secretary Bessent and thus market-friendly (as opposed to being led by trade adviser Navarro and thus ideological), should reduce tail risk. We had earlier seen a 60% likelihood for our optimistic base case view, 25% for a serious economic downturn and 15% for entrenchment of high inflation into the economy. We believe the trade announcement shifts this outlook in favor of the base case, to 70%, with respective 20% and 10% chances for a downturn and for entrenched inflation. Reduced tariff uncertainty also improves the growth profile within our base case and should somewhat reduce the peak in inflation. That said, the news does not dramatically lower our expected inflation profile, as the better growth profile implies a tighter labor market and greater second-round inflation effects, offsetting some of the reduction in the direct impact of tariffs on prices.
In our view, the main catalyst for recession or inflation-entrenchment risks is uncertainty about tariffs, not their exact level. Whether the reduction of tariff uncertainty is sustained or not is critical to our economic view. There remain countless country- and sector-specific trade negotiations in flight, and our economic views incorporate anticipated moderation in essentially all of them, particularly on automotive tariffs. A ‘yo-yo’ framework for tariffs – for example, where the administration oscillates between Bessent policy and Navarro policy, or where it rotates among countries to focus on for brinksmanship negotiation – would be recessionary in its uncertainty.
Looking ahead, we perceive bidirectional risks to tariffs from here. We see the possibility of further moderation on Chinese ‘fentanyl’ tariffs. Our global economics view is that there is room for a deal on international trafficking in drug precursors that could underpin an eventual reduction, although this does not seem imminent. At the same time, we see risk of further intensification of tariffs on China or elsewhere as the political winds shift.
The Fed’s decision against panicking into the Liberation Day drawdown looks exceptionally prudent in retrospect and will likely be the cornerstone of a recovery in consumer and investor confidence in US inflation and fixed income markets. One can only imagine the environment if the FOMC had allowed itself to be seen as holding a devil-may-care attitude toward inflation. With still-high inflation on the horizon and fewer worries about a sharp loosening of the labor market, the FOMC likely will see little need to cut rates near term and considerable risk in doing so. Instead, with Chinese tariffs on hold for 90 days as well as many other ongoing trade processes and the economic reaction to existing tariffs only starting, it is hard to see the FOMC having enough clarity in the data to cut before Q4 2025 at the earliest.
As a result, we remain comfortable with our existing call for easing to resume in Q1 2026. It would be easier for us to envision earlier cuts (perhaps in Q4 2025) if the administration were to again lower tariffs sharply, such as by eliminating the automotive tariffs and the ‘fentanyl’ tariffs on China. On the other hand, it is also now easier to devise a scenario of reasonably robust US growth, perhaps underpinned by easy fiscal policy coming out of budget negotiations, coupled with inflation persistently at or above 3% y/y. That is an environment in which the FOMC might consider a shift toward somewhat more restrictive policy, particularly under new leadership that may be much more focused on inflation credibility….
13 May 2025 BNP US rates: Start spreading the news on the front-end
KEY MESSAGES
Our model highlights four key drivers that affect 2y swap spreads, including T-bill supply, dealer balance sheet capacity, bank demand, and MBS duration hedging. Our model currently values 2y Treasury-OIS spreads at -21bp.
T-bill supply and dealer balance sheet constraints are significant drivers, where historical events such as the Covid-19 pandemic and the Fed’s quantitative tightening regime have shown significant impacts on these drivers (and front-end spreads).
Despite recent pressures, the normalization of T-bill rates, dealer balance sheets, and potential regulatory changes suggest a favorable environment for front-end swap spreads. We enter long 2y OIS swap spreads.
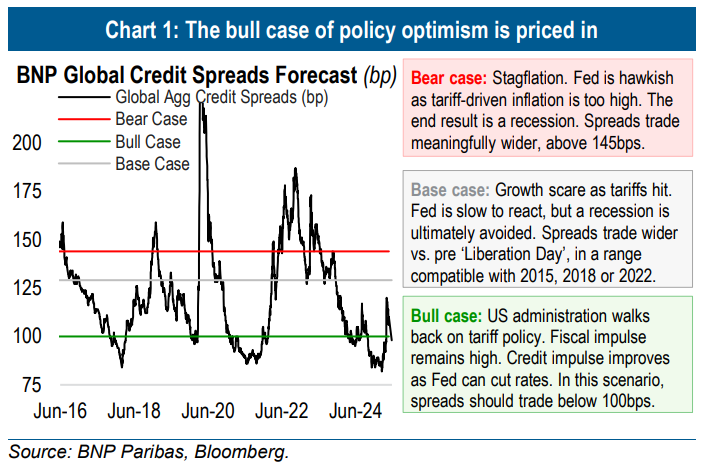
The US-China trade agreement reduces recession probabilities. However, a growth slowdown remains likely. US effective tariff rates will remain well above pre-March levels. We expect wider spreads from here, particularly as the bull case of US policy optimism is now fully priced in.
Data should start reflecting post-tariff reality soon. The markets have been trading in an information-vacuum ahead of tariff impact, with earnings and data releases still backward-looking. Post-tariff reality data should become prominent by the end of May, in our view.
There is weakness in the pipeline. Despite this week’s trade agreement, some damage has already been done, in our view: (i) pre-emptive imports should revert as tariffs are now in place; (ii) uncertainty is weighing on capex plans; and (iii) the Fed has a more hawkish reaction function now.
BNPP Tactical Credit Indicator triggered a sell signal. Credit appears overbought after a significant spread retracement, according to our tactical credit indicator. Risk appetite is at extreme levels and positioning is not as light as it was.
Trade ideas €: Buy € Single-B versus € BB. Lower rated High Yield still prices in a high recession probability. Sell € IG Industrials versus € IG Non-Financials Senior. Cyclical risk premium is low in Europe and Industrials are the most expensive cyclical sector.
Trade ideas $: Buy $ Single-B versus $ BB. Single-B has room to compress vs. expensive BB HY, as the US recession tail-risk declined. OW $ IG Tech. Fundamentals are resilient and issuance plans were front-loaded. US deals with China and Saudi Arabia could be a tailwind.
… being back home and noticing somewhat (pennies here/there) higher gasoline prices ‘round, this next one caught my attention (hope not a strategy but…)
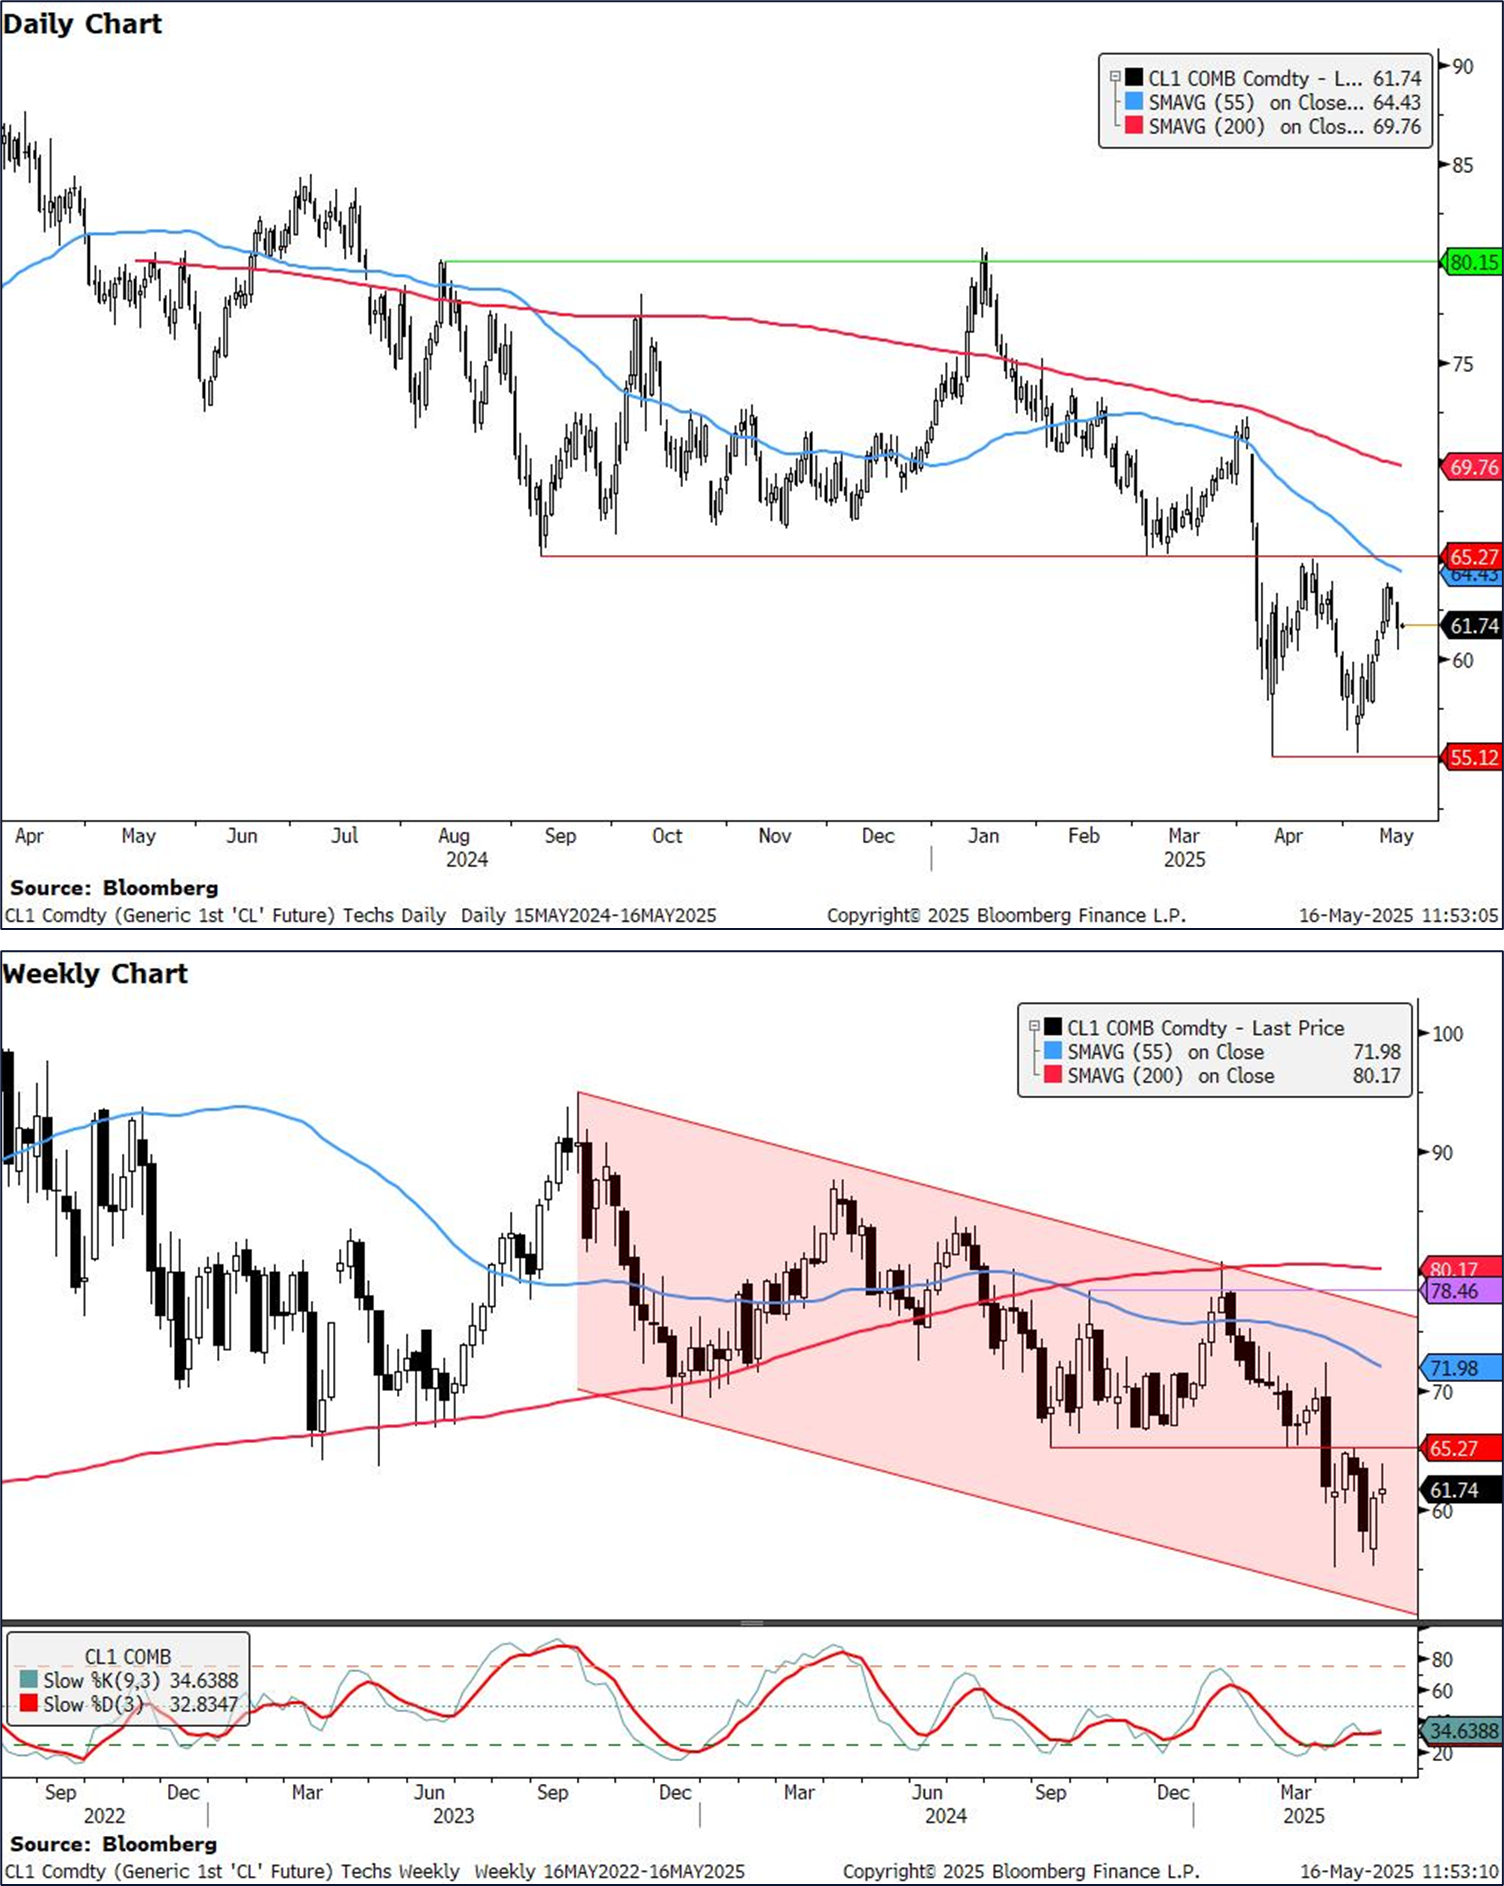
Friday, May 16, 2025, 0:21 CitiFX: Techs - Oil faces a move back lower
Brent and WTI face a possible ~10% move lower towards the April and May lows from a technical standpoint, which could materialise if we see more concrete news around a potential US-Iran nuclear deal…
…WTI (CL1): A similar picture in WTI, with the broader bearish trend still intact. WTI has come near resistance at 64.43 (55d MA), from where we have turned lower. Here, the key support area to watch is at 55.12 (April low) which also held in early May.
… same shop with one I missed Tuesday and checking in to see how they did as they are some of, if not THE very best ‘techAmentalists’ out there …
Tuesday, May 13, 2025, 22:58 CitiFX: Techs - US yields testing key levels
The rise in US yields mean that we are now testing very strong levels across the curve. 4.50% in US 10s in particular could be an attractive level to buy the dip. In US 2s10s, we flag triple momentum divergence in the weekly slow stochastics indicator. This s one of our favored indicators of trend exhaustion, and could suggest that we could see some flattening ahead…
…US 30y yields Resistance in 30y yields remains very strong at 5.00% (Jan high, psychological level). We note this is a level that held on a daily basis in April as well. We think support is likely at 4.67% (55d MA) in the short term.
Longer term, 4.30% remains the key level to watch. Till then, yields look rangebound between 4.3-5.0%.
… German shop (b/4 Moody’s) with a couple notes debt / deficits and on tax bill and elevated deficits (interesting to see how or IF Moody’s impacts thinking going forward) and on bonds and front end, positions and flows (discretionary O/W) and …
15 May 2025 DB: We have a problem George Saravelos
t is simple. The US cannot close its very large current account deficit unless it closes its fiscal deficit too. But over the last few days we are learning something very important: the US appears unwilling to do that. The emerging reconciliation bill from the US Congress points to ever-wide fiscal deficits above 6%. The US - China trade accord effectively signals a very low pain threshold on taxing (tariffing) the US consumer. In all, even if we account for the (now diminished) revenues from tariffs the US budget deficit will keep growing. The current account deficit will likely keep widening in this scenario too.
The significance of this conclusion cannot be over-estimated. We have been arguing over the last few months that the market is reducing its willingness to fund US twin deficits. This is arguably entirely reasonable given the expressed US desire to reduce them. But actions speak louder than words: the newsflow over the last few days aligns with the opposite outcome. We worry this is brewing a major problem for the dollar and potentially the US bond market too.
The rationale is as follows. The US has a record negative net international investment position (chart 1), the most rapidly deteriorating and largest in the world (chart 2). This is reflective of three things: very large foreign ownership of US assets, extreme valuation of dollar assets and the very expensive dollar itself (chart 3). Running a wider fiscal deficit requires foreigners to buy an ever-expanding amount of US Treasuries and an ongoing rise of America's foreign liabilities. This we believe is no longer sustainable.
To see this, consider our long-held argument that the best metric of fiscal space is a country's net international investment position (NIIP). The greater the amount of money a country owes to the rest of the world, the more difficult it is to borrow more money. This can be seen in the very tight relationship between sovereign yields and the NIIP (chart 4), far tighter than the corresponding relationship to fiscal deficits. The current path of America's deteriorating net foreign asset position implies UST yields well above 5% over the next few years. We believe foreigners are becoming increasingly aware of this dynamic as the dollar has lost some of its "special" status.
The market conclusion is clear. For foreigners to continue financing US debt one thing needs to happen: the non-dollar price of US Treasuries needs to decline, either via currency depreciation or a drop in the price of the bonds. The problem for the latter is that it makes US debt dynamics even worse so is not sustainable. We are ultimately left with the only solution to this problem being dollar weakness. That will effectively lead to a capital writedown of foreign holdings of US assets and an improvement in America's net external asset position, making it easier to finance new issuance again.
We would argue this dynamic is already playing out. Our high-frequency foreign inflow data is continuing to show very tepid inflows in to the US. There is persistent reporting of investors and countries reconsidering their dollar asset exposure, most recently in Taiwan. The discussion of "passive" currency accords implies less Treasury buying from foreign central banks, while a more globally expansive fiscal stance will reduce foreign willingness to buy USTs even more.
Perhaps the most compelling evidence of this dynamic accelerating would be an increasing decoupling of US yields from the dollar, most visibly in USD/JPY. As one of the world's biggest buyers of US fixed income,if Japan stops buying US debt you would expect to see the yen stronger and US yields higher at the same time. The bond - dollar correlation needs to be watched closely. It will be the clearest signal of an ongoing deterioration in US bond dynamics.
To sum it all up, as Secretary Bessent alluded to himself, the US cannot be asking of the rest of the world to reduce its imbalance with America if the US is not willing to reduce its own. The risk is the rest of the world forces the correction upon the US in a disorderly way.
…The US owes too much money to foreign investors
15 May 2025 DB: Tax bill details suggest still-elevated deficits in the near term
The Joint Committee on Taxation (JCT) released its preliminary score of the House Ways and Means Committee mark-up of the large budget reconciliation bill working its way through Congress. Recall that the Ways and Means Committee is responsible for writing the main tax code portion of the bill. Relative to the CBO’s January 2025 baseline, the JCT estimated the mark up to increase deficits by $3.8trn over the next 10 years, with most of the deficit increase ($2.2trn) occurring over the next five years. Indeed, breaking the bill down even further, of the $1.9trn of total savings identified in the mark up, the majority ($1.2trn) is realized over the back half of the 10-year budget window.
Though the specific components of the additional tax cuts on top of the TCJA extension differed from what we had previously outlined (see “US outlook: Tariff-struck”), the JCT score of the Ways and Means mark-up was largely in line with our top-line deficit assumptions.
Risks are two-sided at this point. On the one hand, tariff revenues could be higher than we have currently penciled in, which assumes a ~15% tariff rate and only 2% import growth on average going forward. Conversely, the JCT score of the Ways and Means mark-up can be best thought of as a floor in terms of deficit increases over the 10-year budget window. The final legislative product is likely to show even less savings once the House and Senate “reconcile” their differences…
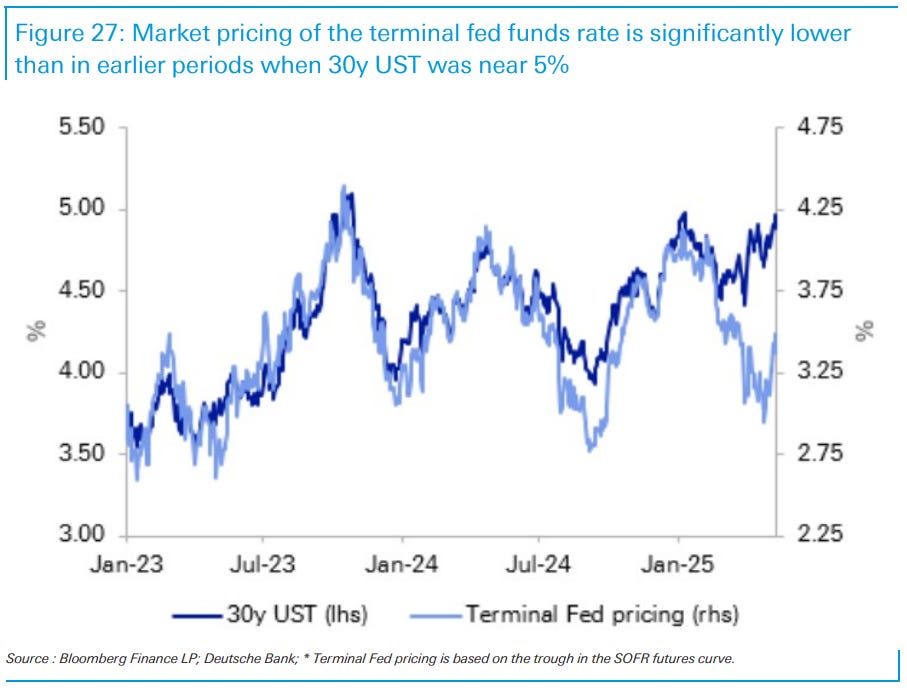
…Terminal Fed pricing and the long-end The spotlight this week has again been on the long end, with the 30y UST trading close to 5%. This is near local peaks reached in late 2023 and January of this year. But, as shown below, pricing of the terminal fed funds rate today is about 50bp lower than in those earlier periods.
The wider spread between long-term yields and terminal Fed pricing reinforces other signals that term premia have risen substantially. Higher premia are justified by the global bond supply and inflation outlook and expectations that foreign investors will, at the margin and over time, reduce allocations to USD assets. Moreover, as we’ve pointed out, even with recent increases, term premia don’t look stretched by longer-run historical standards.
Given all this, it is not difficult to imagine the 30y yield breaking above 5%. Looserthan-expected fiscal policy coming from the bill working its way through Congress could fuel further increases in long-end premia and justify a more hawkish Fed path; our forecast has the deficit around 6.5% of GDP over the next several years, in line with consensus. Alternatively, data in coming months that point to ongoing labor market resilience and upside inflation pressures could push terminal Fed pricing back towards 4% and bring the long-end up with it.
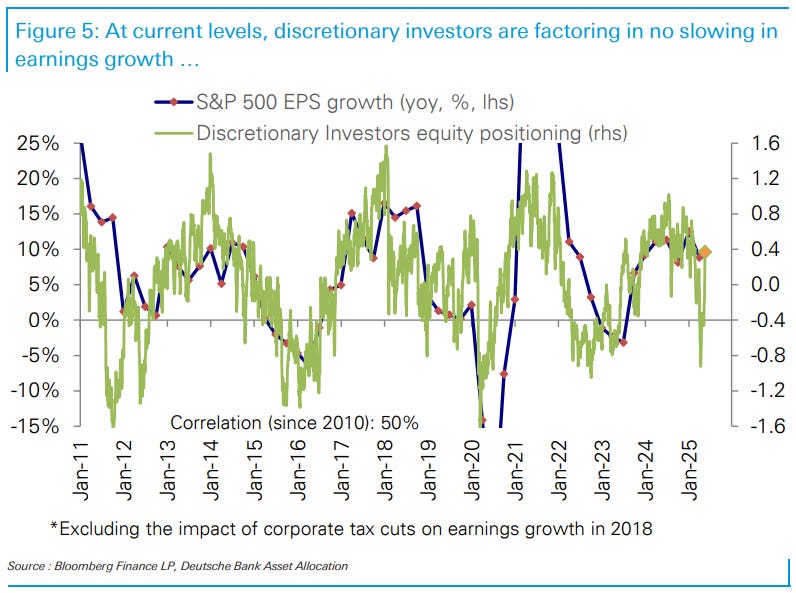
16 May 2025 DB: Investor Positioning and Flows - Discretionary Investors Jump Back To Overweight
… Discretionary investor positioning is now in line with no slowing in earnings or GDP growth. Discretionary positioning is now in line with there being no slowing in earnings growth beyond the modest slowing in Q1 and no slowing at all in GDP growth (using the ‘final sales to private domestic purchasers’ measure which strips out the impacts of changes in net imports, inventories and government spending). We note that the US-China deal still leaves a hefty 15pp increase in effective US tariff rates from 2.4% to over 17%, with those on China at a massive 43%. An increase in tariff rates of this magnitude will weigh on growth, but discretionary investors are likely factoring in additional rollbacks and exemptions once the impacts start to manifest.
… attention all of Goldilocks muppets and minions … stocks are to continue rising … nothing says ALL IS WELL like stocks which are once again high and rising, amIright?
May 15, 2025 Goldman: US stocks are forecast to rally amid China tariff discussions
US stocks are expected to rally in the coming months as the Trump administration overhauls the country’s tariff policy with its largest trade partners.
The S&P 500 Index fell in early April after the US government announced sweeping “Liberation Day” tariffs, but the index has rallied since then amid delays on the import taxes and signs of progress on trade-policy negotiations. China and the US agreed last weekend to reduce duties for 90 days amid ongoing trade discussions.
“Investors have generally embraced the view that there's an off ramp for some of these hefty tariffs,” David Kostin, chief US equity strategist in Goldman Sachs Research, says in an episode of Exchanges. “I think that largely is priced in the market.”
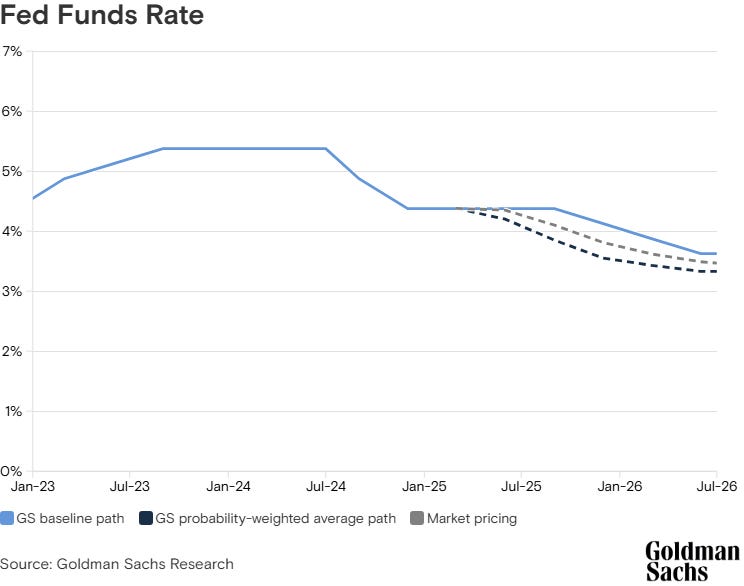
…The forecast for Fed rate cuts
Goldman Sachs Research expects a slower pace of rate cuts by the Federal Reserve on signs of tariff de-escalation between the US and China.
Our economists now expect the Fed to begin a series of three 25-basis-point cuts in December rather than in July, and to implement them at every other meeting rather than sequentially. The Federal Open Market Committee meets roughly every six to eight weeks.
Jan Hatzius, Goldman Sachs Research's chief economist, writes in the team's report that the rationale for interest rate cuts in our economists' forecast has shifted. Previously, the rationale had been insurance: pre-emptive action when the central bank sees potential weakness in the economy.
Now the team expects that the Fed will instead start cutting with a view to slowly returning interest rates to a more conventional level “as growth remains somewhat firmer, the unemployment rate rises by somewhat less, and the urgency for policy support is reduced,” Hatzius writes.
The team's estimate for the terminal rate — the point at which the Fed will stop cutting interest rates — is unchanged at 3.5-3.75%.
These next couple / few notes from a shop with a very deep bench (some of which now litter other — FRENCH — operations on Global Wall) and here’s a more BEAR STEEPENING take (notice no longer long 5s). an economic WEEKLY as well as an excellent money market fund update IF that’s your jam …
May 16, 2025 MS: A Steeper Yield Curve Coming on More DV01 Risk | US Rates Strategy
Private sector investors took on increasing amounts of Treasury DV01 risk since QT began in mid-2022, but the majority of the risk came since mid-2024. With more DV01 risk on the way, we expect investors to demand increasingly higher term premiums – keeping the US yield curve on a steepening trend.
Key takeaways
We calculated weekly DV01 risk for all US Treasuries held in SOMA and held by the private sector since mid-2003 and made it available on Bloomberg.
Since mid-2024, the DV01 risk held by the private sector rose dramatically – nearly reaching its mid-2019 high as a percentage of total risk.
We expect this trend to continue as Treasury net supply increases, Fed QT continues for now, and Fed QE remains absent.
The Fed's portfolio holds much more >11y DV01 risk as a percentage of all DV01 risk held than the private sector, but this should converge over time.
We continue to suggest investors embrace US yield curve steepeners. Stay in UST 3s30s steepener and 1y1y vs. 5y5y term SOFR steepeners.
…We plan to map out different scenarios for this transition in future research – a transition key to the amount of term premium private sector investors demand to own long-end DV01 risk.
Trade idea: Maintain UST 3s30s yield curve steepener at 0.96% with a target of 2.10% and a trailing stop of 0.62%.
Trade idea: Maintain term SOFR 1y1y vs. 5y5y curve steepener at 0.73% with a target of 2.10% and a trailing stop of 0.25%.
Trade idea: Exit long TII 0.125 04/15/27 at 1.25% trailing stop.
Trade idea: Close long 1y2y straddles at stop-loss of 114bpv.
Trade idea: Close short 3m2y straddles (ref. 120bpv; 0.5x notional to 1y2y long).
May 16, 2025 05:00 AM GMT MS: US Economics Weekly: Touching a hot stove
In raising tariffs, the administration touched the stove and found it hot. Inflation should pick up beginning in May, keeping the Fed on the sidelines in 2025. The House budget plan is consistent with our outlook for a broadly unchanged fiscal stance.
Key takeaways
Tariff de-escalation reduces the risk of a hard landing and helps lock in a slow growth, firm inflation outlook.
Reducing downside risk increases the probability that inflation rises before activity slows. We retain our outlook for no rate cuts from the Fed in 2025.
Negotiations over the fiscal budget remain ongoing. We think progress to date points to a largely unchanged fiscal stance, with a risk toward higher deficits.
May 16, 2025 MS: A Check-in on Money Market Funds | US Rates Strategy
Total MMF AUM sit at $7.351tr, quickly recovering from the April tax-related dip. Attractive front-end yields, a more uncertain macro environment, and supportive 2H seasonals likely produce new record highs soon. MMF portfolios lower allocations to bills in April, in favor of repo and FHLB debt.
Key takeaways
Total MMF AUM at $7.351tr have almost fully recovered from the April tax-date-related dip and is poised to soon make new record highs, in our view.
A more uncertain macro environment makes cash allocations even more appealing, likely leading institutional and retail investors to be more risk adverse.
Debt limit dynamics and tax-related outflows both likely contributed to the decline in MMF T-bill market share to 35% in April.
MMF portfolio allocation shows a further allocation to repo, with total repo outside the RRP now above $2.6tr; FICC-sponsored repo hits ~$1tr.
MMFs also increased their allocation to Agency debt – specifically FHLB debt – at the fastest monthly pace since the March 2023 regional bank stresses.
… next up and any time Global Wall offers updated, marked to market forecast it’s worth pausing to absorb … it’s a reminder of one thing which is constant principle ‘out there’ and that is, in my view, how narratives FOLLOW price … these ‘stratEgerist’ jobs aren’t easy and neither is the job inside the Fed …
16 May 2025 NatWEST: US Weekly Economic and Strategy Brief
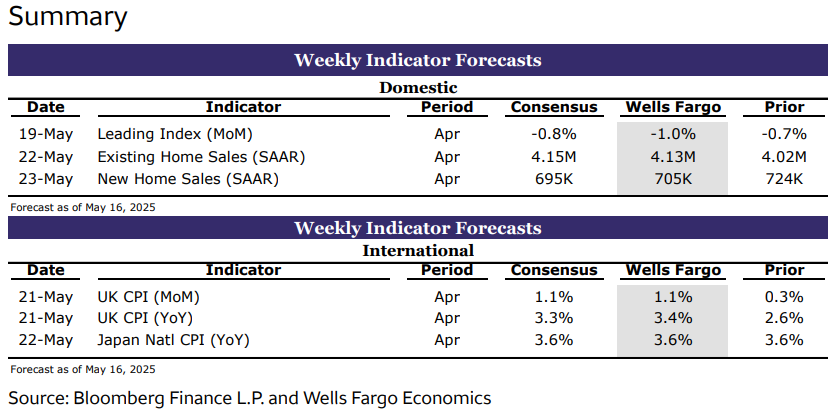
US Economy Preview: The data calendar in the upcoming week is light, with only secondary indicators on tap, including both new and existing home sales. Additionally, a number of Fed officials are scheduled to speak leading up the start of the Memorial Day weekend at the end of the week. (The bond market in the US will close early on Friday.
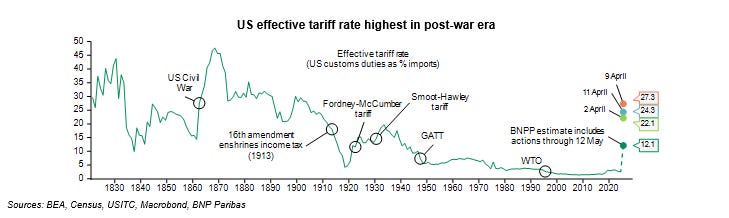
Forecast Update: On Sunday, May 11 the U.S. and China jointly announced a 90-day trade de-escalation that would see respective tariff levels pulled back sharply: U.S. tariffs on Chinese goods are now proposed at 30% (instead of 145%), while Chinese tariffs on U.S. goods are now proposed at 10% (instead of 125%). We estimate is that this development effectively cuts the average effective tariff rate (i.e., the ratio of tariff revenue to the value of imports subject to tariffs) in half—from 23% to 11.5% (versus 3.5% last year) if current proposals are not altered again from here. Of course, no one really knows where the tariff rates will finally settle but the most recent news is a positive step relative to a few weeks ago…
…US Rates: Market pricing for Fed easing has adjusted sharply in the last two weeks. At the start of May, futures markets were pricing 100bp of policy rate easing in 2025 and are now pricing just ~55bp (two 25bp cuts). Expectations have shifted primarily with the softening of President Trump’s tariff stance and especially with the US / China tariff de-escalation that saw each country reduce its tariffs on the other by 115%.
Covered wagon folks offer some weekend reading and once again, this was written / sent ahead of the Friday Night Lights offered by Moody’s but still …
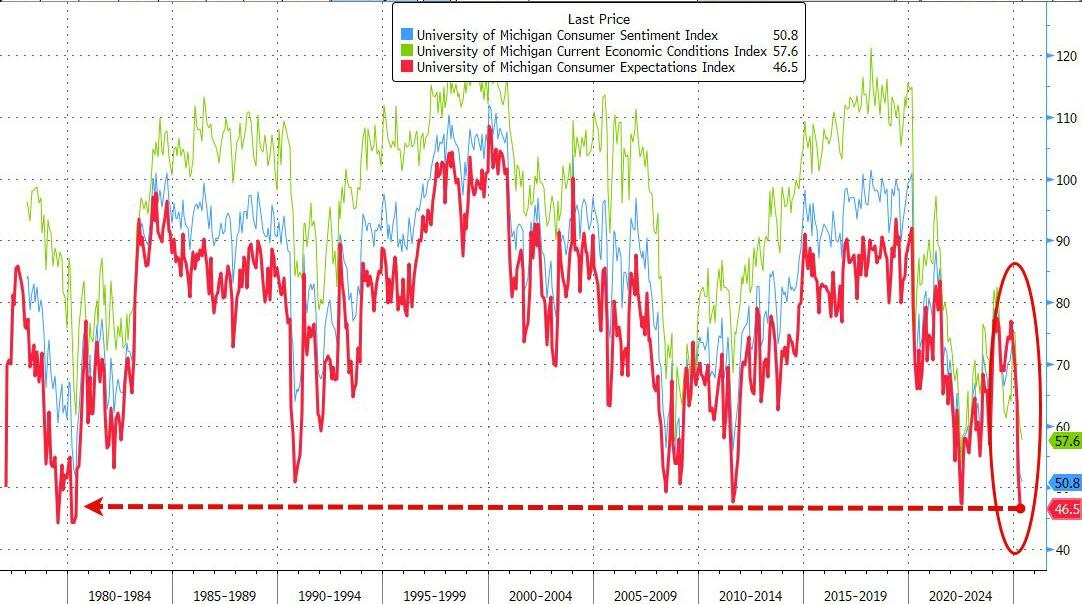
United States: Sentiment Is Cratering but Hard Data Signal Only a Stalling The 90-day pause with China cheered financial markets, but economic data showed early indications of the economic impact of tariffs. Retail sales held up OK and industrial production was flat, but small business confidence optimism faded. Consumer sentiment plunged to the second lowest on record amid inflation worries.
… Consumer sentiment data in May showed the consumer psyche continued to deteriorate. The University of Michigan's headline Consumer Sentiment Index dropped to 50.8, the second-lowest point the index has ever reached going back to 1978 (chart). Inflation worries remained top of mind; median year-ahead inflation expectations jumped to 7.3%, up four percentage points since the start of the year. Long-term inflation expectations (5–10 years ahead) rose to 4.6%, the highest long-term inflation expectations since 1991. The threat of tariffs is the culprit behind the large upticks in inflation expectations, as the press release noted that tariffs were spontaneously mentioned in close to threequarters of interviews. Though some of the worst-case outcomes were mitigated this week through the U.S.—China reprieve, tariffs still present a sizable threat to the economic outlook.
...Credit Market Insights: Here to Collect: Student Loan Delinquencies Surge in Q1
The Federal Reserve Bank of New York released an update to its Quarterly Report on Household Debt and Credit this week, which included data through Q1-2025. Rising delinquencies point to some modest strain among consumers, and the resumption of student loan payments after almost five years of forbearance comes as the consumer is on somewhat shakier footing.
… finally a few words from earlier in the week from Dr Bond Vigilante, offering an updated ‘recalibrated’ f’cast …
May 12, 2025 Yardeni: Recalibrating Our Forecasts As Stock Market Roars
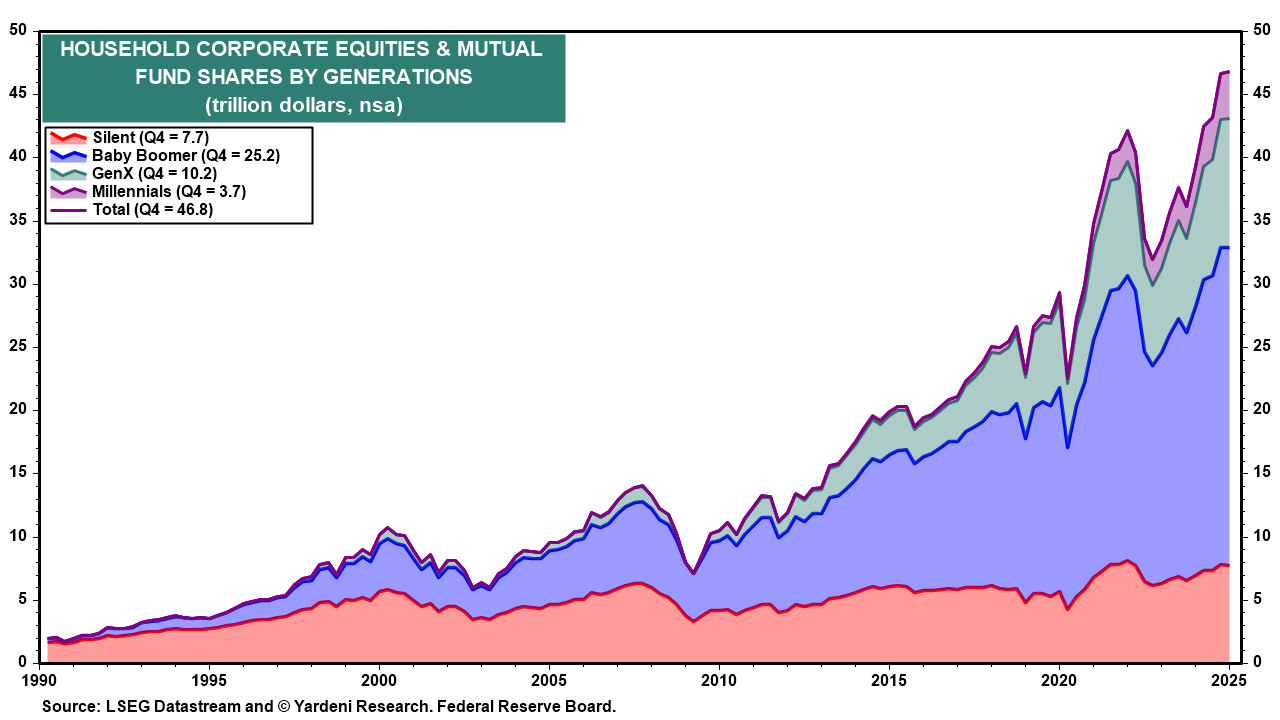
Among our main concerns about Trump's Tariff Turmoil was that the drop in stock prices would have a significant negative wealth effect on consumers, especially retired and soon-to-be retiring Baby Boomers, who collectively own about $25 trillion in corporate equities and mutual funds (chart). We raised our subjective probability of a recession this year from 20% to 35% on March 5, and from 35% to 45% on March 31 as stock prices tanked in response to TTT.
We didn't cross over to the dark side subsequently, i.e., forecasting greater than a 50% chance of a recession. Instead, we lowered our recession odds back down to 35% on May 4. Now we are lowering it again to 25%. After today's stock market rally, the negative wealth effect is probably insignificant. We are also raising our S&P 500 year-end target back up to 6500 from 6000. (BTW: According to Polymarket.com, the odds of a recession dropped from 51% on Friday to 41% today.)
We are still predicting that S&P 500 forward earnings will rise to $300 per share at the end of this year. We now see the S&P 500 forward P/E at 21.6 at the end of the year rather than 20.0 as we previously had projected. We are raising our real GDP growth range to 1.5%-2.5% this year, up from our previous 0.5%-1.5% (chart).
In the April 7 Morning Briefing, we wrote: "We expected Liberation Day [April 2] to bring trouble. So for now, we aren't changing our outlook or our odds of a recession. Call us delusional optimists, but we aren't ready to bet against the resilience of the US economy in general or its consumers in particular. Of course, our big assumption is that Trump's tariff nightmare will go away sooner rather than later, one way or another." We predicted a V-shaped stock market recovery when that occurred, which it did two days later on April 9 …
… Moving along TO a few other curated links from the intertubes, which I HOPE you’ll find useful …
DOWNgrading and buying of bonds …
May 16, 2025 at 9:47 PM UTC Bloomberg: US Credit Rating Cut Over Massive Government Debt
The US was downgraded by Moody’s Ratings on Friday thanks to government debt that’s approaching a mind-numbing $37 trillion. It was a dramatic move that cast further doubt on the polarized nation’s status as the world’s highest-quality sovereign borrower. Moody’s lowered the US credit score to Aa1 from Aaa, joining Fitch Ratings and S&P Global Ratings in grading the world’s biggest economy below the top, triple-A position.
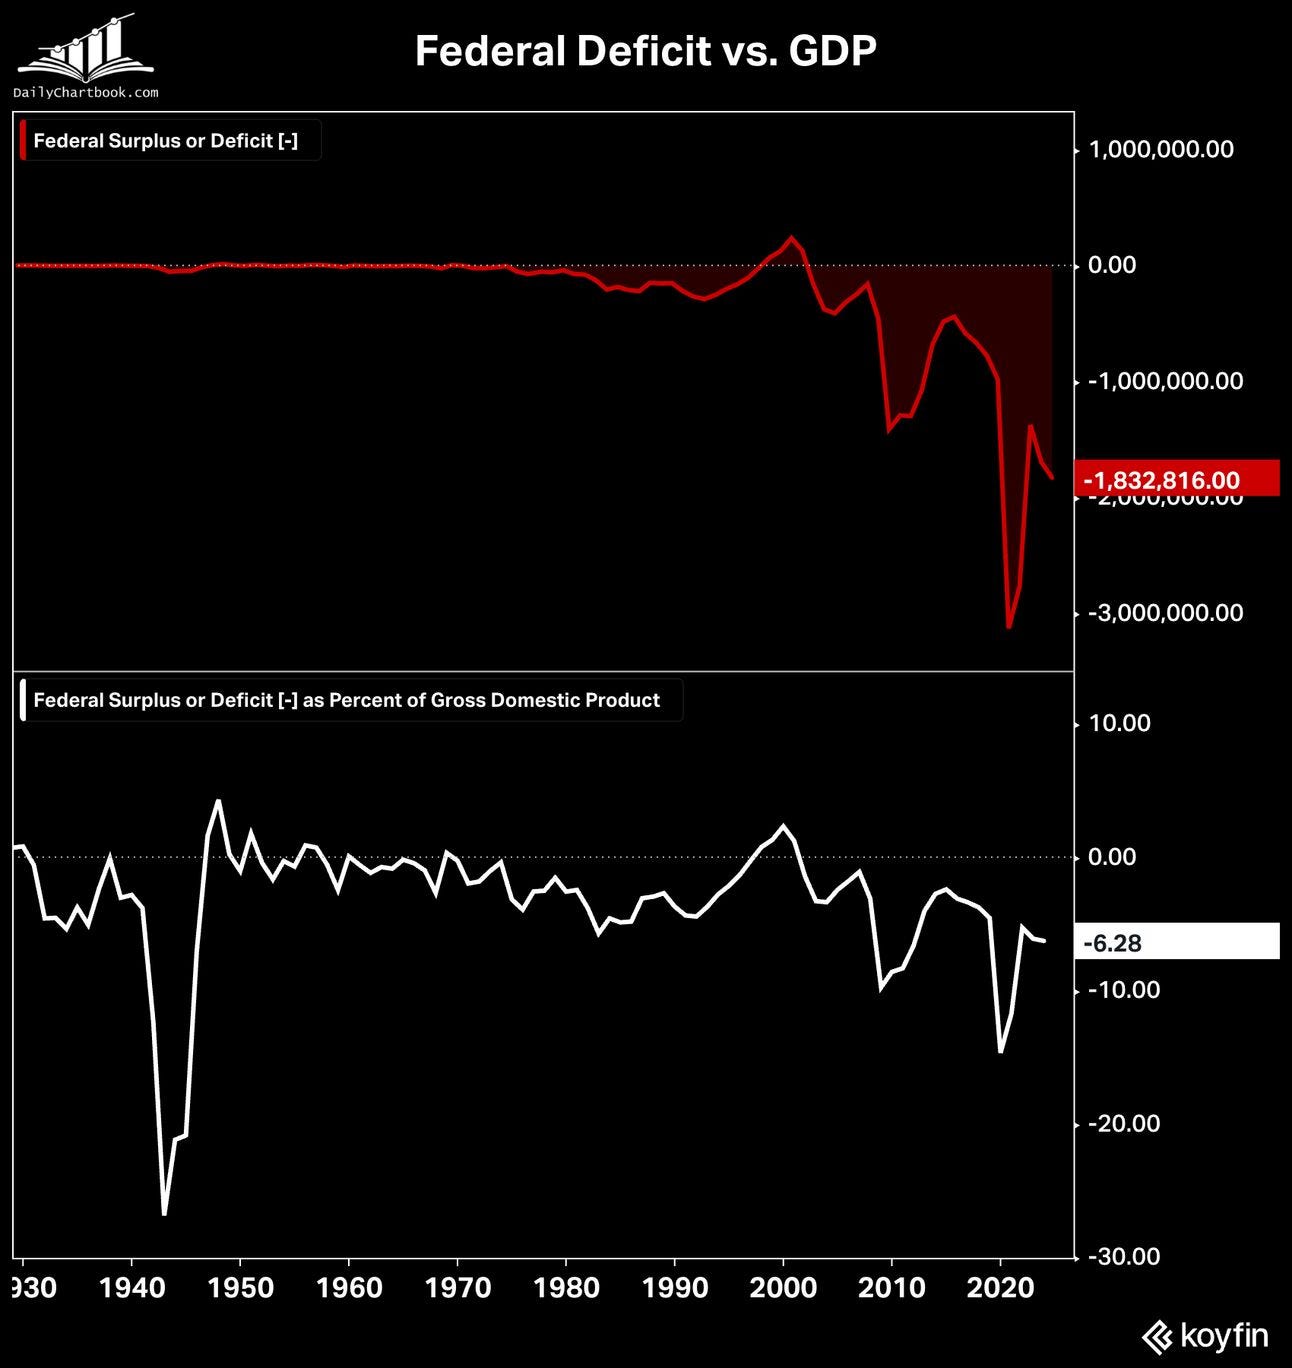
The one-notch cut comes more than a year after Moody’s changed its outlook on the US rating to negative. The federal budget deficit is running near $2 trillion a year, or more than 6% of gross domestic product, and Congressional Republicans are pushing through budget legislation that could add trillions of dollars more. “While we recognize the US’ significant economic and financial strengths, we believe these no longer fully counterbalance the decline in fiscal metrics,” Moody’s wrote in a statement…
…China shrank its holdings of US Treasuries in March, with the UK replacing it as the No. 2 overseas owner. China was the top holder of Treasuries as recently as 2019, when Japan overtook it. Total overseas holdings of the debt rose $233.1 billion, to $9.05 trillion, Treasury Department figures showed Friday. While the release showed there was no revolt against American government securities in the first few months of the Trump administration, the data predates the destabilization of the US Treasuries market last month following Trump’s rollout of “reciprocal” tariffs.
Stocks rose Friday as the Financial Times reported the US and the European Union broke an impasse to enable tariff talks, bolstering optimism about negotiations with America’s top trade partners. The news comes after the Trump administration announced an agreement with the UK and a temporary truce with China in the trade war. The renewed optimism sent the S&P 500 up 0.7% Friday, with the gauge climbing over 5% for the week. Action in the bond market was muted, though Treasuries saw a third straight weekly drop—the longest slide this year. The dollar rose despite data showing sentiment among options traders is the most negative in five years…
Terminal with writeup on Global Wall (only familiar with couple folks …) reaction TO downgrade …
Updated on May 16, 2025 at 11:03 PM UTC Bloomberg: Wall Street Strategists React to Moody’s US Credit Rating Cut
… Thomas Thornton, founder of Hedge Fund Telemetry LLC:
“This is not good for overall US markets. This is not like when S&P lowered the AAA rating back in 2011 which was a shocker and markets were already teetering then. The bond market is seeing rates late in the day move higher and rates moving higher, faster and sharper has been number one on the risk list for me.”
… Dan Greenhaus, chief market strategist at Solus Alternative Asset Management LP:
“The United States is running a giant, peacetime budget deficit unlike anything we’ve seen probably in our lifetimes. But we all know that. Moody’s isn’t telling us anything new.”
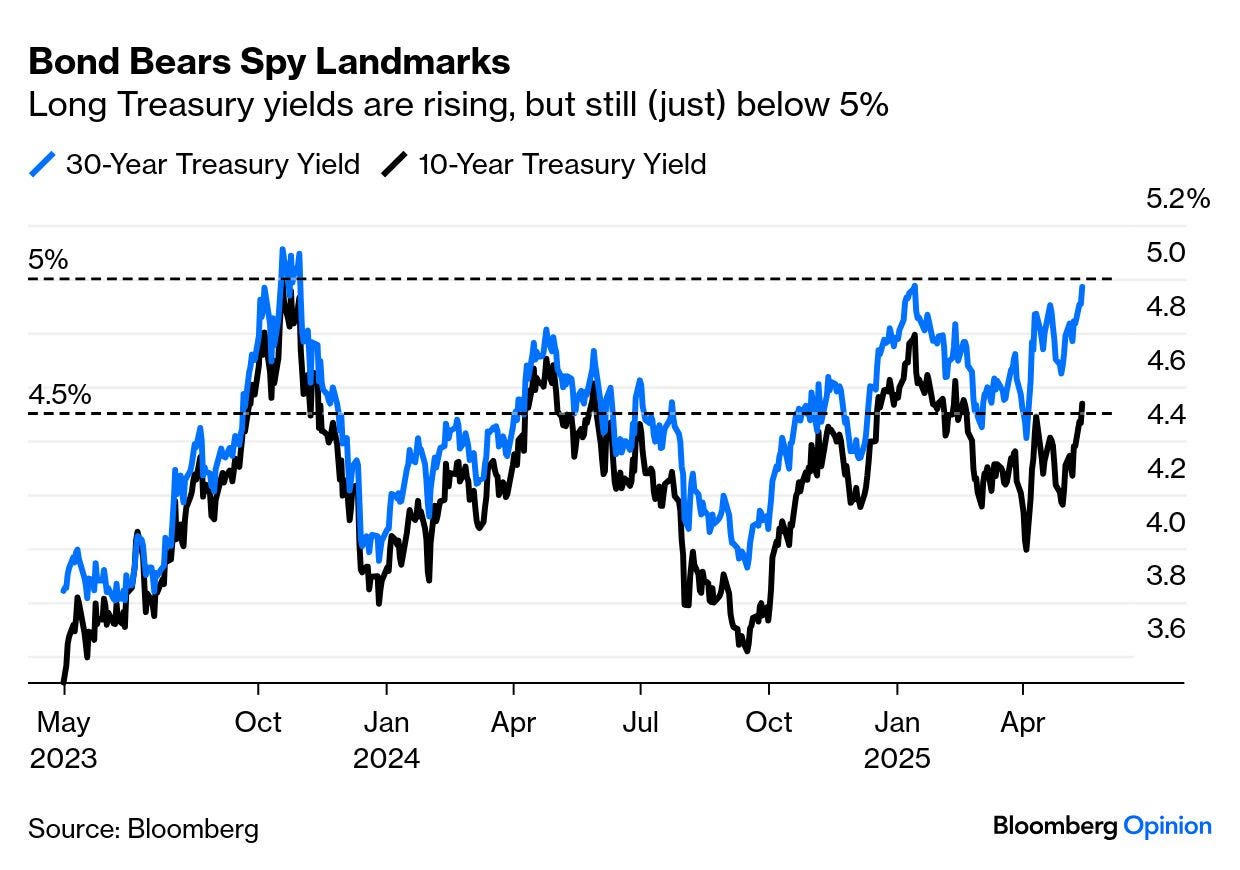
Terminal with a view and any time you talk vigilantes, you got MY attention (and also the visual of stocks vs bonds, funTERtaining to me, anyways) …
May 15, 2025 at 5:00 AM UTC Bloomberg: ‘Beautiful’ is in the eye of the bond vigilantes The bottom line of Trump’s desired tax cuts will be greater deficits.
… Until recently, the new administration had appeared ready to take a big hit to its political capital in the aid of reordering global trade. Now, it seems the bond vigilantes may need to levy a similar price to bring fiscal continence back to the US. The menacing rise in longer yields shows that they have doubts:
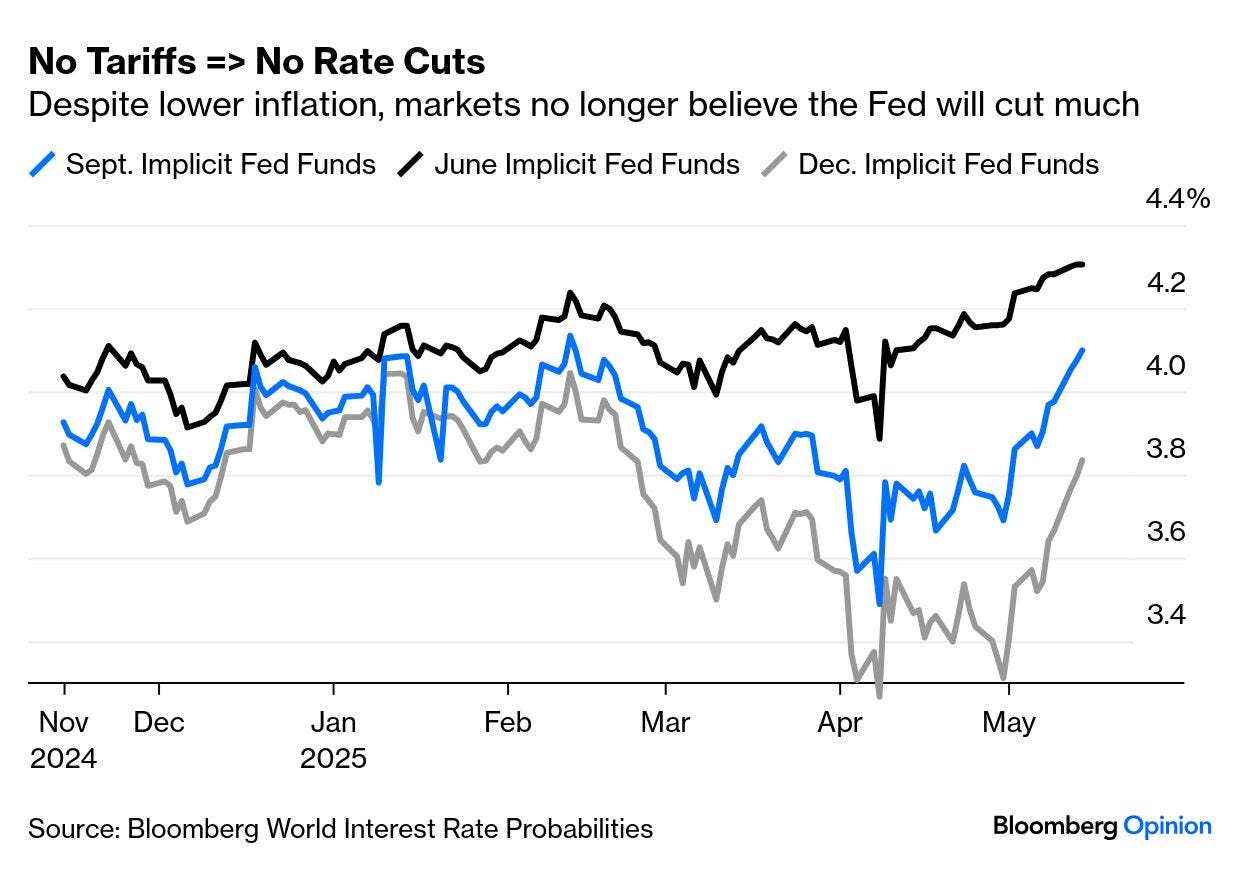
Bonds have moved in conjunction with expectations for the Federal Reserve. Tariffs posed a clear and present danger to US growth. After April 2, when the administration was insisting that trade levies were not merely a negotiating tool, fed funds futures began discounting a series of cuts. That is over. The implicit rate for next month’s Fed meeting is at a new high, with the chance of a cut now negligible:
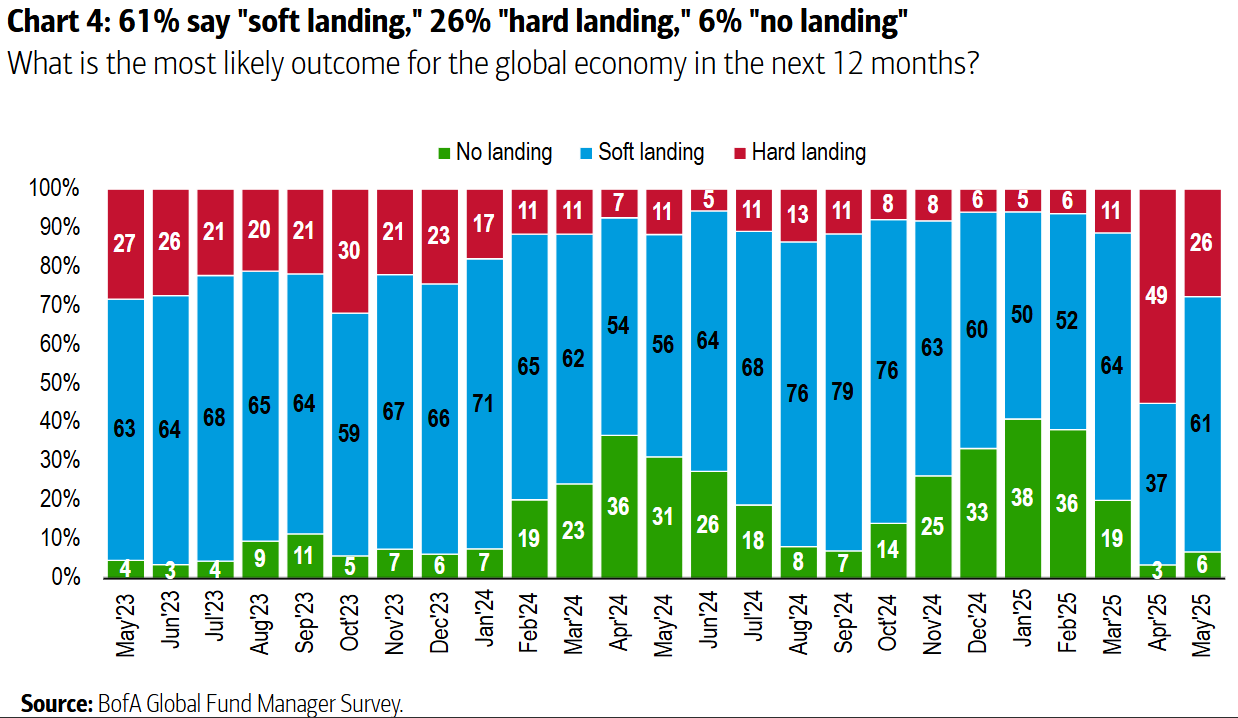
Meanwhile, the most imminent risk has shifted from stagflation (a real possibility if tariffs remained at punitive levels) to inflation. Viewing the economy in terms of landings has gone out of fashion of late, and the Bank of America survey of fund managers showed that belief in a “no landing” scenario — in which the economy booms, inflation is not tamed, and rates eventually have to rise still further — almost disappeared during the tariff tantrum. We can expect those odds to rise considerably from here:
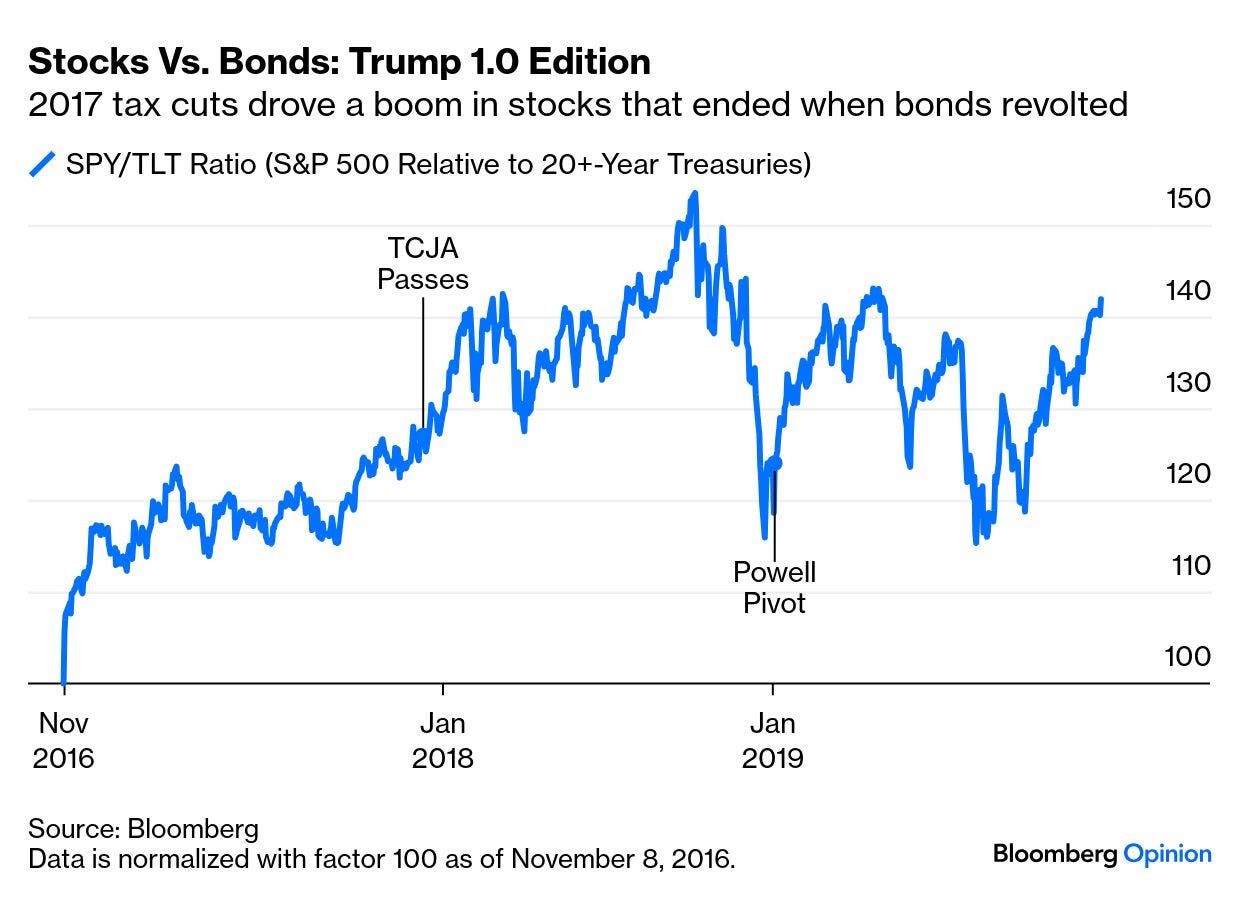
All of this is consistent with the theory that Trump has given up on a certain kind of 2.0 radicalism, and will now follow his 1.0 model — which involves tax cuts, and a pronounced concern to please the stock market. Eight years ago, that led to a potent rally once it became clear that the tax cuts really were going to happen. It ended when 10-year yields rose to 3.25% — a level that at that point the stock market could not tolerate:
AND with stocks / bonds in mind, lets turn TO The Terminal.com for a look at STOCKS …
Sat, May 17, 2025 at 7:00 AM EDT Bloomberg: Grim Economic Outlook Overtakes Solid Earnings as Tariff Disruptions Surface
(Bloomberg) -- One thing is clear as the first-quarter earnings season draws to a close: The uncertain outlook for the global economy is superseding better-than-feared results even as stocks rally on signs of easing trade tensions.
… In the US, a measure that reflects the proportion of S&P 500 Index members that raised their earnings outlook compared to those that held or reduced, the so-called profit guidance momentum, fell to the lowest level since at least 2010, according to an analysis from Bloomberg Intelligence’s equity strategists Gina Martin Adams and Wendy Soong. That is in spite of S&P 500 companies delivering double the profit growth that was expected in the first quarter, according to BI.
AI all the rage and here, a former Fed chair offers some support of ‘ALTERNATIVES’ but not the alts you think of …
Fri, May 16, 2025 at 11:27 AM EDT Bloomberg: Bernanke Urges Fed to Adopt ‘Alternative’ Forecast Scenarios
1. US credit rating. Moody’s downgraded the US’ last remaining Aaa credit rating by one notch to Aa1, citing persistently large fiscal deficits and rising debt affordability concerns. The agency expects the deficit to grow from 6.4% of GDP in 2024 to nearly 9% by 2035. It revised the outlook from negative to stable.
… 3. US vs. RoW. "Kind of surprised that even with this huge rally, and tech having done so well, that US stocks have still underperformed global peers since April 2. I wouldn't have guessed it."
🏆 Today's Chart of the Day was shared by Walter Deemer (@WalterDeemer).
The S&P 500 ($SPY) closed higher in all five sessions this week, gaining +5.3%. This marks the second ‘perfect week' in the past month, as a V-shaped recovery off the April lows continues to play out.
Walter points out that $SPY opened firmly above its 200-day moving average on Monday and never looked back, leaving an unfilled gap on both the daily and weekly charts.
To fill this week's gap, $SPY would need to drop roughly -4.5% to $567.50. The gaps on April 27th and May 1st were also left unfilled. As Walter often notes, "How quickly gaps get filled—if at all—gives us an idea of how strong the underlying trend is."
The Takeaway: In the past month alone, $SPY has logged two ‘perfect weeks’ and three unfilled gaps, reflecting a strong underlying bid and solid momentum off the April low.
Young and brilliant much in same way that Lacy Hunt is, Eric Basmajian earlier in the week …
May 14, 2025 EPB Research: The (Cyclical) Economy Leads Earnings
Stock prices are no longer a leading indicator. This post provides empirical evidence behind how the Cyclical Economy leads company earnings which leads stock prices.
NewEdge with a hot<inflation> take on the week that WAS (hindsight 2020 and those who don’t learn from history are doomed to …) and hey, lots of Terminal infographics so …
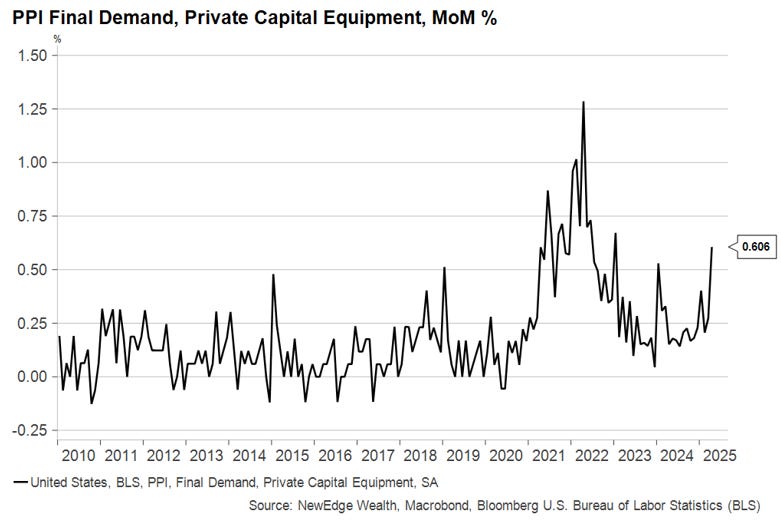
The grains of sand that tariffs have thrown into U.S. economic gears showed up last week in U.S. inflation data, though not in the consumer report, as many had anticipated. The Producer Price Index (PPI) provides prices on transactions made between businesses as well as estimates of profit margins. In April, prices rose while margins shrank on the categories most affected by tariffs.
Prices for finished capital goods rose by 0.6%, their largest monthly increase since the supply chain bottlenecks that formed after the COVID pandemic:
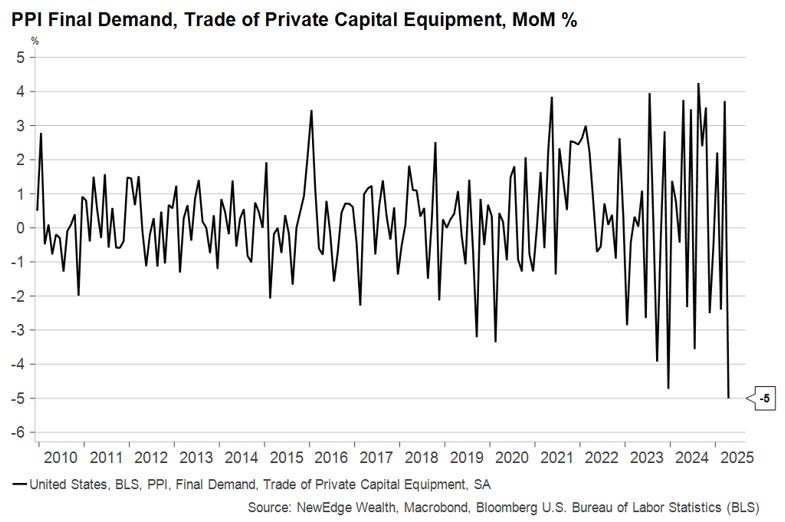
While this may represent just the tip of the iceberg for the inflation impact to come, it could also have been a lot worse had companies fully passed on their cost increases to customers. Trade in capital equipment, which measures profit margins for wholesalers and retailers on their finished capital goods sales, plunged by the most ever in a single month:
The story in consumer goods is directionally similar, but not as great in magnitude yet. Firms are more reluctant to raise prices on consumers than they are on other businesses, for now. But the bulk of the tariffs had only been in effect for a matter of weeks when this data was collected, meaning this data does not reflect the full impact of today’s tariff rates.
Further, as we heard from Walmart this week, saying that price increases were on the horizon for products in its stores, there remains a significant delay in how stated tariffs work their way through business and consumer data.
Just as the Soft Data Turns…Higher?!
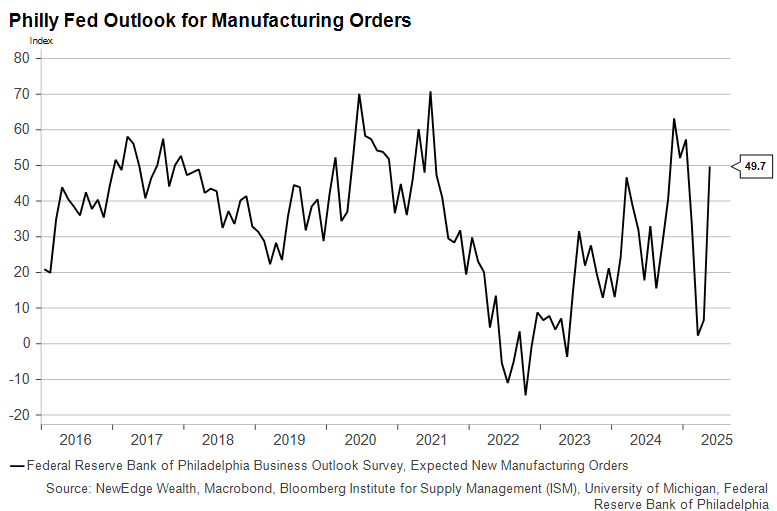
The tragicomedy of U.S. survey data took another absurd turn this week, even as the first signs of higher prices and squeezed margins showed up in the PPI. The Philadelphia Fed Business Outlook, which tends to capture manufacturing sentiment early in the supply chain, surged out of deep recession territory to a much more optimistic outlook in the May reading:
The pause in the bulk of U.S.-China tariffs undoubtedly had something to do with it. And if this index lives up to its reputation as a leading indicator of leading indicators, we may begin to see other “soft” data pull back from the abyss they had been staring into since Liberation Day.
It should be noted that markets and growth forecasts never priced in the full extent of the deterioration in soft data we saw in April (a lesson learned from misleading soft data in the post-COVID era?), so the sharp rebound in soft data may not spark big upward revisions to forecasts either.
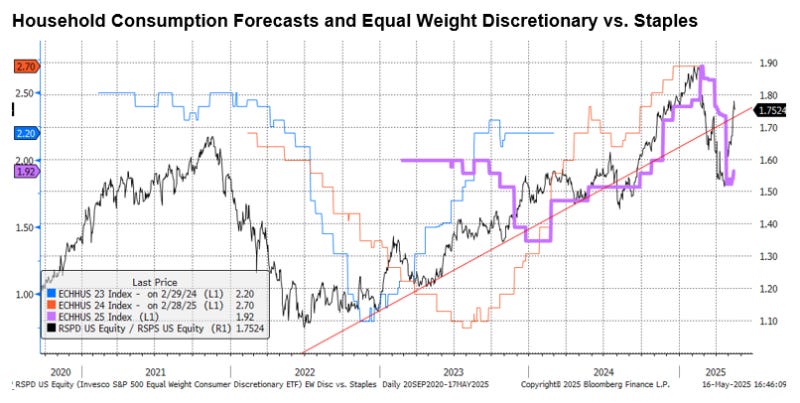
That being said, we did see Household Consumption forecasts tick back higher this week, as shown in the purple line below, following the rebound in the important Equal Weight Discretionary vs. Staples ratio (which has been a helpful signal about how the equity market views the health of the US consumer).
Source: Bloomberg, NewEdge 5-16-25
Tailwinds and Headwinds for Equities This brings us to our assessment of the US equity market. In just over a month, the S&P 500 has soared an impressive 20.25% from its April closing low, bringing the index above its 200-day moving average and defying many expectations that the rally in shares would stall.
Below, we provide a ledger of the tailwinds and headwinds for equities, but we would like to highlight one vitally important factor: positioning…
…Conclusion We think the “pain trade” could still be higher for equities in the near term, given how light positioning remains, but could see strength fade in the summer months as valuations hit a ceiling and EPS estimates continue to fade as the tariff realities set in to the hard data. Given the degree of underweight positioning, we don’t rule out a retest of the prior highs, but we see the risk reward fading for new capital as this positioning tailwind begins to fade and the economic reality of slowing growth and higher inflation begins to threaten the peace of relieved markets (much like a teenager standing in front of a jukebox armed with a fistful of dollar bills).
… I’m a terrible dancer, ask anyone (no, pls dont) but the 2-step (forward AND back) is a new one …
After a lot of back and forth, tariffs are back to manageable levels and markets are back to where they started the year. Institutions that kept their heads cool, like the Fed, appears to have made the right choice.
Despite all the big letters emanating from US trade politics, both the S&P and US rates are back to where they started the year after having been down 18% and almost 60bps in the meantime. The high correlation between the tariff rate of the day, equities and rates suggests markets have mainly been concerned with the growth impact of trade barriers and not too worried about higher prices.
Markets are back to unchanged for the year
The Fed stands out as one of few institutions that have managed to keep their cool amidst all the noise coming from commentators and analysts calling for an imminent recession and emergency rate cuts for the n’th time since 2022. The back and forth on tariffs shows that there is a tight limit to how far Trump is willing and able to push US trade policies. Both the WTO and IMF have recently put out revised econmic forecasts that are far less pessimistic that the median analyst or market participant and probably a better guidepost for how hard the US will be hit by tariffs.
Analyst are again too pessimistic on US growth (not for the first time)
In the process of ramping up and down tariff rates, the trust in the US as an investment destination and business partner has eroded, something that is visible in the value of the dollar. Along with the weakening of the USD, EURUSD basis has moved lower. This suggest that in addition to selling US assets, international investors have started to increase their fx hedges on dollar assets. Even it the US were to try to repair the damage to foreign relations, it will take time. We therefore believe the dollar will continue to weaken as investors take a more cautious stance on US assets and hedge a larger portion of what they already own. There are still no good alternatives to a dollar-centric financial market, but more investments elsewhere will create more non-US investment alternatives. We have updated our forecast for the dollar, read more here…
…Chapter one of Trump 2.0 has been a lot about import tariffs and the weakening of domestic institutions. The next chapter looks to be more centered around domestic economic politics and getting the big “beautiful” bill through Congress. If the beauty of the bill is hard to spot, we can at least agree that it is big (and growing). It also shows few signs of wanting to deal with the ever growing fiscal deficits. The lack of fiscal discipline should continue to discourage foreign investors from buying US treasuries and keep the yield premium over swaps high. More expensive funding further increases the US government debt problem. Enticing domestic investors to take a larger share of the new debt, by dialing back the SLR requirement on bank holding on Treasuries or otherwise will probably be tried as a fix. The problem still remains. The US government is using too much money compared to what they bring in. It will need to be dealt with, and when that day comes it will change many things. But that is probably a story for the years to come.
The yield premium on US Treasuries continue to grow
On (dated, stale)TICS …
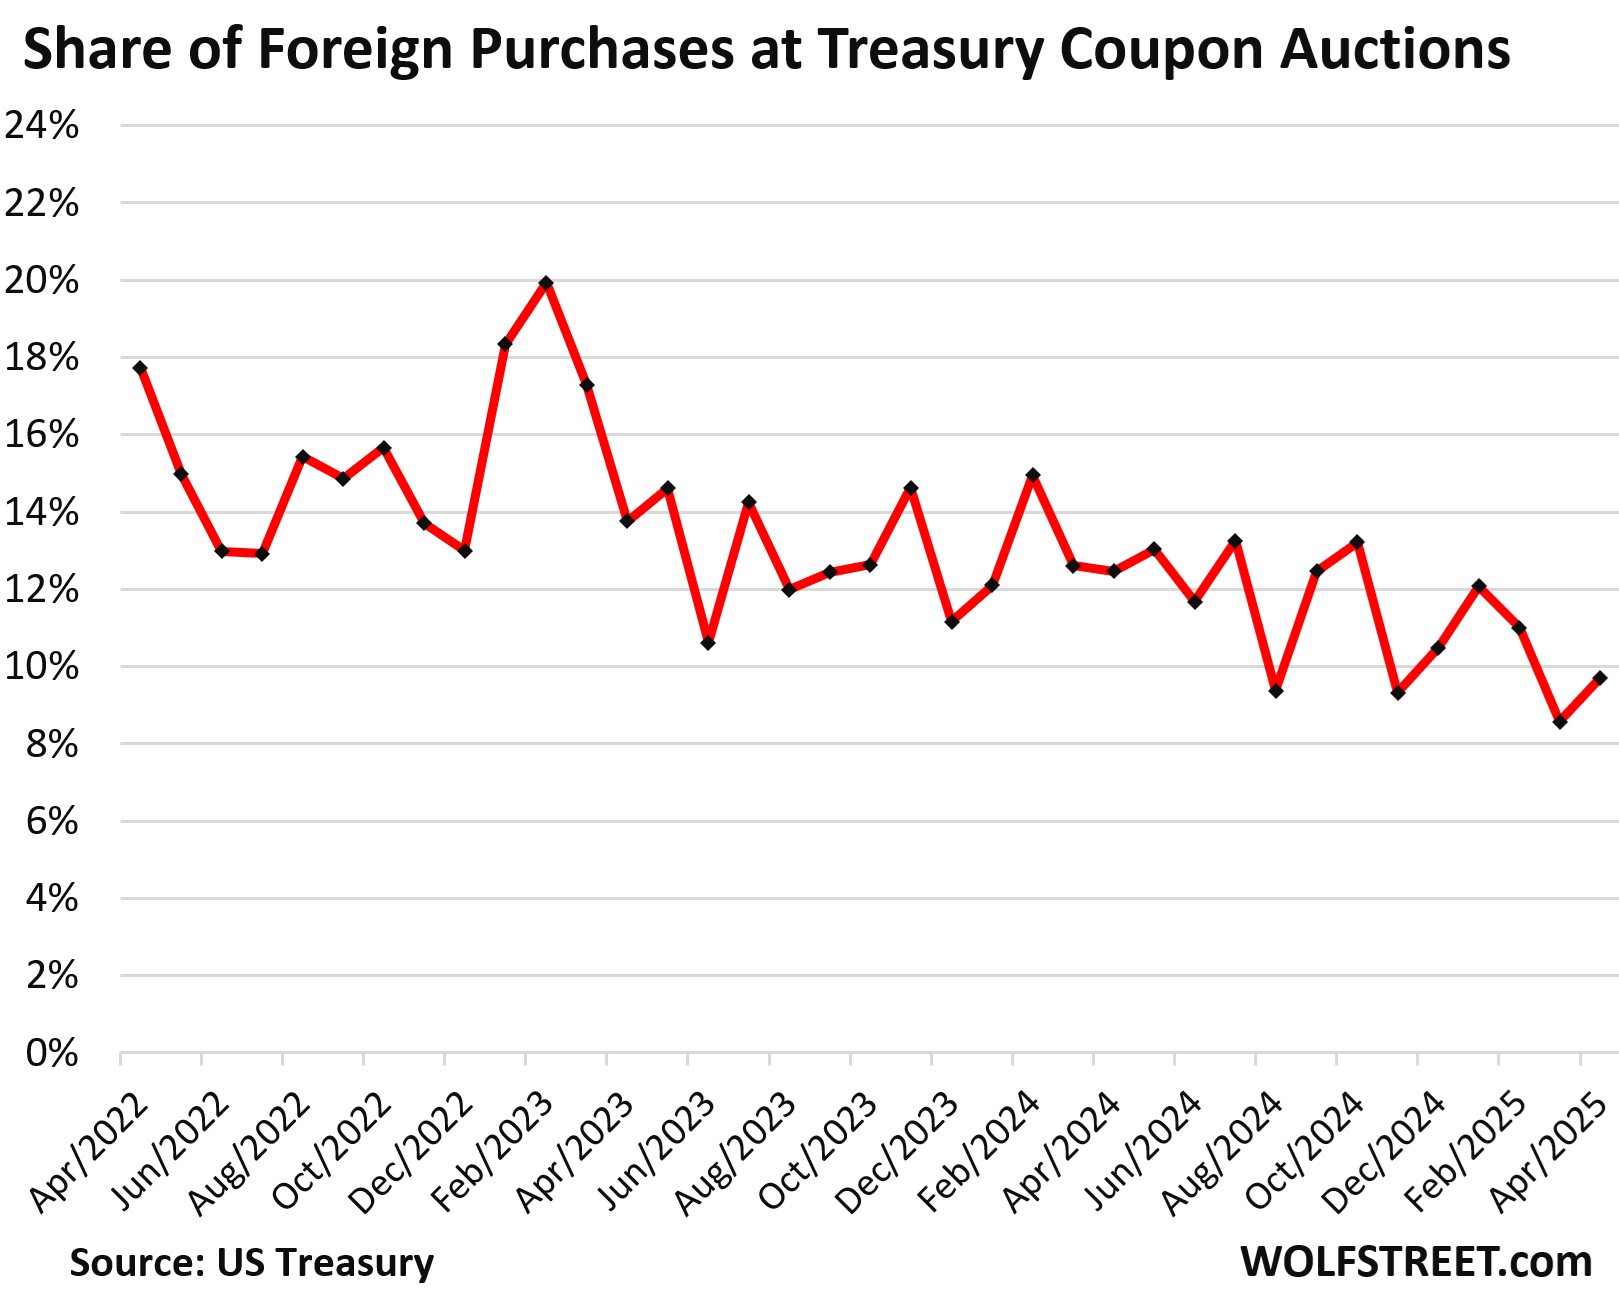
May 17, 2025 WolfST: Foreign Investors Loaded Up on Treasury Securities in March Despite all the Turmoil in the Media
And in April, their purchases of long-term securities at Treasury auctions increased.
… The buying was across the major holders, except for China and Hong Kong combined, and for Ireland. Of particular note: Canada’s holdings of Treasury securities spiked majestically in February and March, despite the tariffs and the ultra-sour mood in Canada about US-anything.
Over the years, foreign holdings have increased in dollar amounts as the above chart shows, but the US debt has ballooned even faster than foreign investors have added to their holdings, and so their share has declined over the years, while US domestic buyers stepped in and loaded up. The low-point of the share of foreign holdings was in October 2023, when it dropped to 22.2% of total US Treasury securities. Then the share of foreign holdings increased again…
… As domestic buyers have to pick up a greater share, higher yields may be needed to make the securities attractive enough to pull in an ever-larger body of domestic buyers.
… The six largest financial centers are rocking and rolling: They added $85 billion in Treasury securities in March (+3.3%!), and $332 billion over the past 12 months, to a record $2.69 trillion. Since 2019, their holdings have nearly doubled. Since 2012, their holdings have nearly quadrupled!
These countries specialize in handling the financial holdings of global companies, individuals, and governments. Ireland is a favorite for US Big Pharma and Big Tech to store their profits. Belgium is home to Euroclear, which has $40 trillion in assets under custody for companies, governments, and wealthy individuals, and a sliver of that is in US Treasuries. The United Kingdom here means the “City of London,” one of the top financial centers in the world.
So a portion of the holdings at these financial centers are actually held by US entities.
Ireland was the only one of the six financial centers to book a month-to-month decline. Luxembourg’s holdings were essentially unchanged (+$12 million).
Increases in March, and total Treasury holdings:
United Kingdom: +$29 billion, to $779 billion
Luxembourg: unchanged, at $412 billion
Cayman Islands: +$37 billion to $455 billion
Ireland: -10 billion to $329 billion
Belgium: +$7 billion to $402 billion
Switzerland: +$21 billion to $312 billion.
Wolf ALSO on Moody’s …
May 16, 2025 WolfST: Moody’s Cuts US Government Credit Rating due to Deficits & Debt, Blames “Successive US Administrations and Congress”
US government kisses its last triple-A credit rating goodbye. Downgrade to “junk” would have been more appropriate?
Finally, a couple / few things from ZeroHedge which I believe need to be reiterated and read IF you, like ME, missed them …
ZeroHEDGE: UMich Survey Suggests Women, Democrats, & Low-Income Americans Are Out Of Their TDS-Addled Minds
Having embarrassed themselves with their TDS-driven cognitive dissonance over the past few months, Democrat-voting UMich respondents (and women, and low income Americans) in the preliminary May survey (a month after Liberation Day and also post-Pause and the massive meltup in stocks) turned the TDS-terror dial to '11'.
Consumer Expectations are now at their lowest since - drum roll please... May 1980...
Tariffs were spontaneously mentioned by nearly three-quarters of consumers, up from almost 60% in April; uncertainty over trade policy continues to dominate consumers’ thinking about the economy…
Friday, May 16, 2025 - 09:05 PM ZeroHEDGE: Moody's Downgrades USA Credit Rating From Aaa
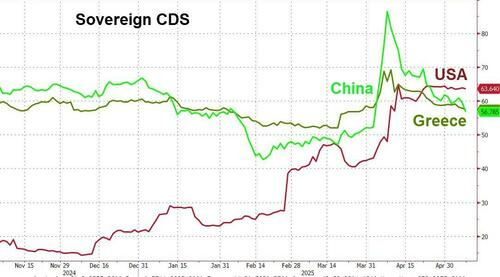
Earlier this week, we noted that short-dated USA sovereign CDS were trading wider than China and Greece as trade policy uncertainty and the debt ceiling 'X-date' loomed...
...well, it appears Moody's Rating Agency noted it too... because they just downgraded the Government of United States of America's (US) long-term issuer and senior unsecured ratings to Aa1 from Aaa and changed the outlook to stable from negative.
The one-notch cut comes more than a year after Moody’s changed its outlook on the US rating to negative, with Moody's joining Fitch Ratings and S&P Global Ratings in grading the world’s biggest economy below the top, triple-A position.
This one-notch downgrade on our 21-notch rating scale reflects the increase over more than a decade in government debt and interest payment ratios to levels that are significantly higher than similarly rated sovereigns.
Successive US administrations and Congress have failed to agree on measures to reverse the trend of large annual fiscal deficits and growing interest costs.
We do not believe that material multi-year reductions in mandatory spending and deficits will result from current fiscal proposals under consideration.
Over the next decade, we expect larger deficits as entitlement spending rises while government revenue remains broadly flat.
In turn, persistent, large fiscal deficits will drive the government's debt and interest burden higher.
The US' fiscal performance is likely to deteriorate relative to its own past and compared to other highly-rated sovereigns.
The stable outlook reflects balanced risks at Aa1.
The US retains exceptional credit strengths such as the size, resilience and dynamism of its economy and the role of the US dollar as global reserve currency. In addition, while recent months have been characterized by a degree of policy uncertainty, we expect that the US will continue its long history of very effective monetary policy led by an independent Federal Reserve.
The stable outlook also takes into account institutional features, including the constitutional separation of powers among the three branches of government that contributes to policy effectiveness over time and is relatively insensitive to events over a short period.
While these institutional arrangements can be tested at times, we expect them to remain strong and resilient.
The US' long-term local- and foreign-currency country ceilings remain at Aaa.
The Aaa local-currency ceiling reflects a small government footprint in the economy and extremely low risk of currency and balance of payment crises.
The foreign-currency ceiling at Aaa reflects the country's strong policy effectiveness and an open capital account, reducing transfer and convertibility risks.
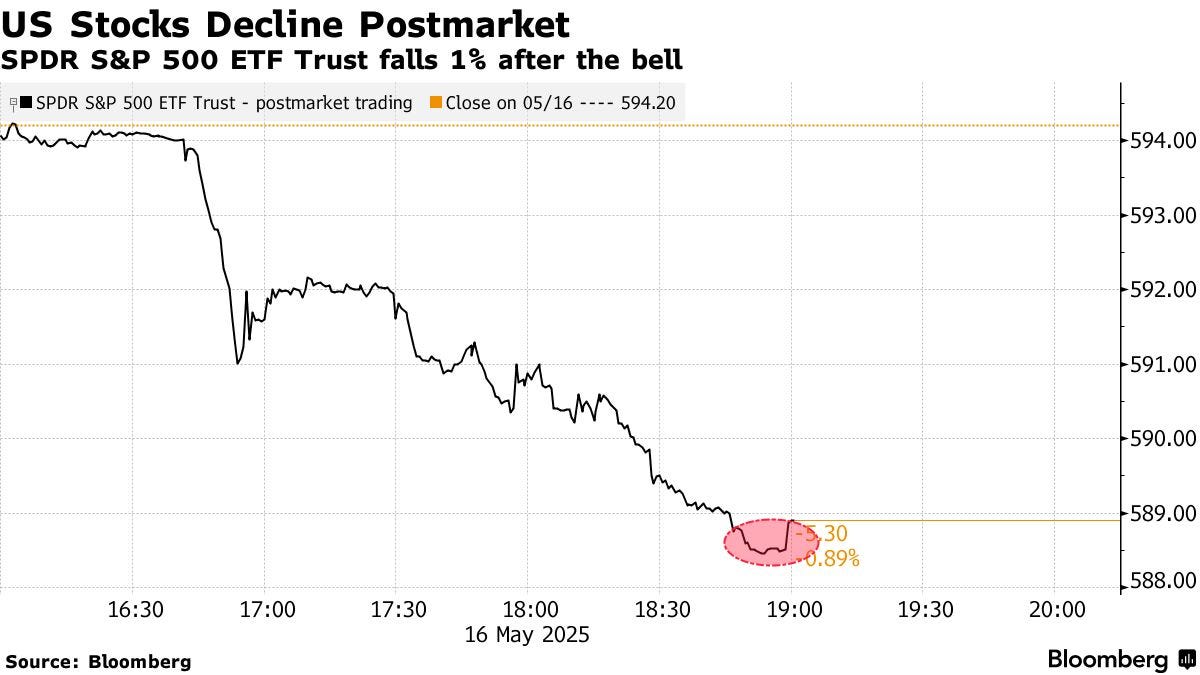
… The timing is exceptional, as Republicans try to get Trump's 'big beautiful bill' out of committee... and as everyone knows, there's no such thing as a coincidence in Washington.
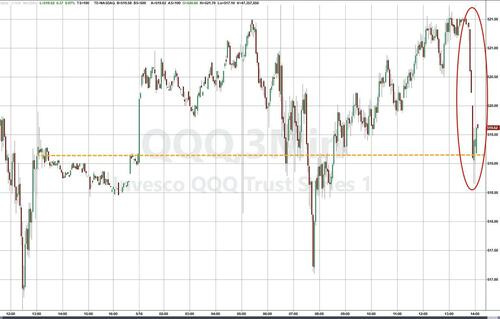
US equity markets are trading down after hours on the news:
Trump's gonna be pissed!!
… AND for any / all (still)interested in trying to plan your trades and trade your plans in / around FUNduhMENTALs, here are a couple economic calendars and LINKS I used when I was closer to and IN ‘the game’.
First, this from the best in the strategy biz is a LINKthru TO this calendar,


Thanks for the historical context.....
I needed that....
Hope Moody's move puts fear into the RINOs and Moderate Republicans...
WE NEED MORE SPENDING CUTS AND WE NEED THEM NOW...THIS FISCAL YEAR.
NOT IN 10 YEARS.....
https://x.com/CitizenFreePres/status/1923872202371346891
Interest on the U.S. national debt is now 20% of total federal revenue and rising -- We borrow every dollar just to pay interest.
4 stunning (and painful) charts from Dave Brat.