Good morning / afternoon / evening - please choose whichever one which best describes when ever it may be that YOU are stumbling across this weekends note…
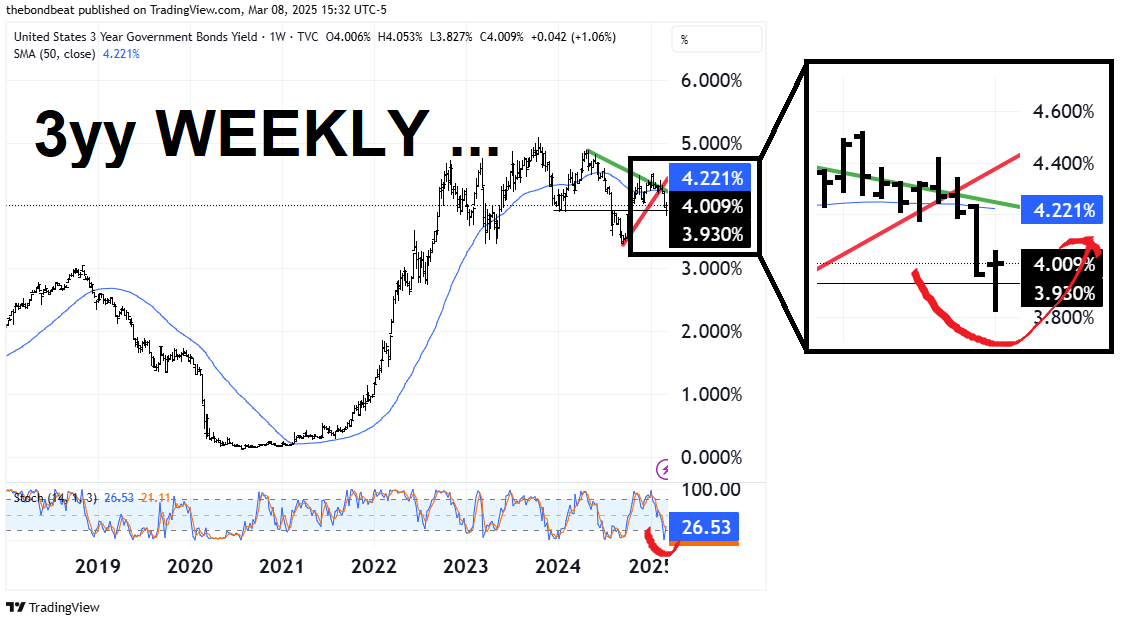
3yy WEEKLY: 50wMA up nearer 4.22 (support) while we closed right AT psychologically important round number of 4.00 after a very brief visit down ‘round 3.93 (lows from ‘24) …
… momentum here looks to be overBOUGHT and crossing BEARISHLY in favor of higher yields (aka concession, in some circles) but clearly 3s are extremely official rate path dependent …
10yy WEEKLY: following up DAILY noted HERE, closing back up above TLINE and interestingly right at 50wMA (4.28) which darned near close to psychologically important round number of 4.25% …
… with WEEKLY momentum crossing more bearishly …
30yy WEEKLY: 4.50% is ~50wMA (4.496%, blue) and is resistance along with TLINE (red) …
… as momentum approaches extreme (overBOUGHT) levels …
These visuals are NOT to suggest ‘all is lost’ but rather some give and take within current downtrend is 100% completely NORMAL.
I’d simply note others on Global Wall (see below, BMO, MS) are all buyin’ / stayin’ long HERE and now.
I’m not nearly as smart as they are so I’ll just thank my lucky stars am NOT in that sorta seat any longer … narratives change couple times a day at moment.
Seems to ME that rates are where they should / ought / MAY be and awaiting some other push or pull. Global WALL has to put forth a view and reco whereas I don’t.
I AM thinking about all the very same inputs and could see that widely expressed view (of lower rates) come to fruition and even MORE so if various equity models (NOTED HERE) are right.
Stocks are RICH. Bonds are a safety valve. Still. And those suggesting the death of 60/40 (or opting for some other model) have been doing so for as long as I can remember…
POINT BEING that IF (big IF there — John Boehner used to say that IF ‘ifs ands and buts were candy and nuts, every day would be xmas’) stocks are rich and to the point where they are as rich as they were back in 2000 (see THE FED MODEL) THEN they sell off and bonds enjoy F2Q bid.
For some further reasoning, refer TO the pros (BMO, MS) below …
For now, though, I’ll move along to a couple / few NFP recaps, resources, links and snark — driving the price action and creating narratives / soundtrack TO the visuals just above …
ZH: "Not As Bad As Feared": US Adds 151K Jobs In February As Unemployment Rate Rises To 4.1%
… Commenting on the report, Lindsay Rosner, head of multisector fixed income investing at Goldman Sachs Asset Management, weighs in:
“To sum it up: Today’s print wasn’t as bad as feared. The payrolls growth surprised slightly to the downside and the unemployment rate ticked up, justifying the momentum that’s been building for a resumption in the Fed’s cutting cycle.”
Others such as Adam Crisafulli of Vital Knowledge, agreed, saying nothing in the report really changes their view on the world.
“Growth is still slowing (at the least), Washington remains a huge source of uncertainty (Trump’s pain threshold is high, and 151K def. doesn’t surpass it), and the Fed isn’t coming to the rescue (the market is already pricing in 75bp of cuts vs. the dot plot guidance of 50bp – even if Powell blesses the former number, that won’t come close to offsetting tariffs).”
… Bloomberg rate strategist Ira Jersey writes that “On first read, the report doesn’t do much either way for the Federal Reserve or Treasury market outlook. A lot of February layoffs were following the survey week for the month, so the next report may be a better indicator health of the labor market. But for now, Treasuries may remain in recent ranges.”
As Bloomberg's Enda Curran summarizes, "this set of data has an "as you were" feeling to it. The numbers were broadly as expected, perhaps some hints of softening (in, say, labor force participation) but otherwise the numbers are in line. However, we know the fast-moving events of recent weeks won’t have been captured in February’s data. The real test for how public spending cuts, federal government layoffs and the impact of tariffs will become clearer in the months ahead."
ZH: Payrolls Post-Mortem: Rearview Data At Its Worst
Bonddad: February jobs report: weak employment gains, but some 3+ year highs in unemployment metrics
CalculatedRISK: February Employment Report: 151 thousand Jobs, 4.1% Unemployment Rate
Glassdoor: February jobs report: Calm before the storm
WolfST: Federal Government Layoffs & Quits Begin to Show up in the Jobs Data, Barely Dent Solid Labor Market - Civilian employment at the federal government accounts for less than 1.9% of total payrolls.
… Alrighty, then. In as far as how the cookie crumbled by days / weeks end …
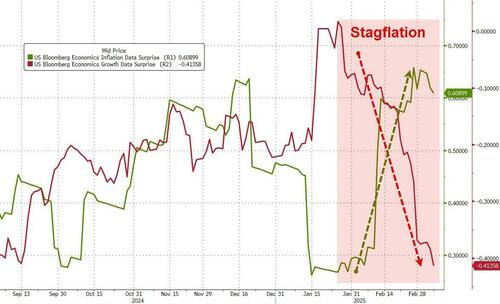
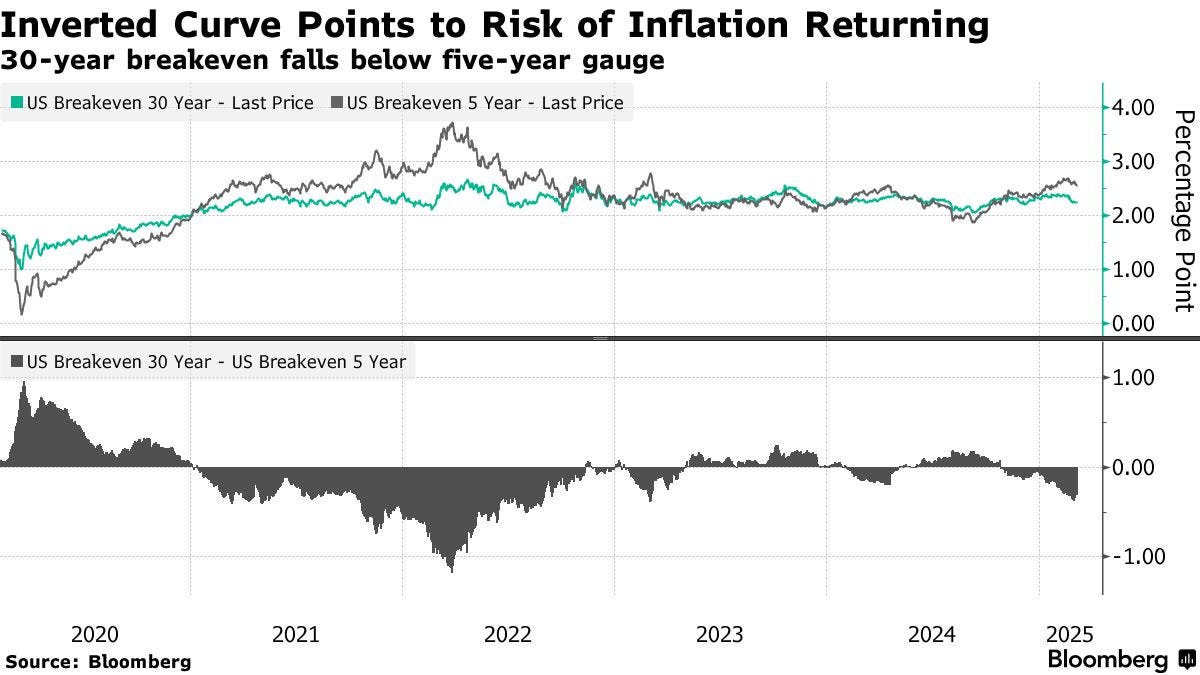
… ...suggesting the equity market is fearful of far more than some marginal tariff tensions. Macro data this week broadly speaking reinforced the growth scare (red line below) but worse still for the more PhDs in The Eccles Building is that inflation anxiety is back way up - stagflation is back bitches...
Source: Bloomberg
Treasury Secretary Bessent echoed the sentiment of President Trump and Elon Musk who have both recently warned of some short-term pain...
“The market and the economy have just become hooked, and we’ve become addicted to this government spending,” Bessent said.
“There’s going to be a detox period.”
As Bloomberg's Ed Harrison noted, that’s good news for bond investors, but bad news for stock investors because it suggests a calibrated risk strategy to get the “bad stuff” out of the way first via tariffs and government spending cuts before any deregulation or tax cuts kick in.
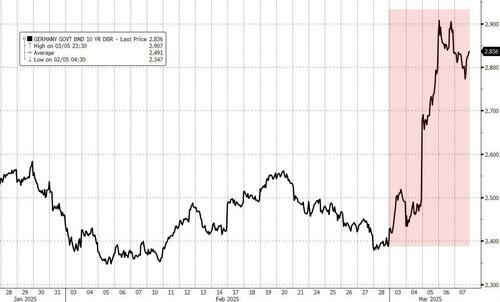
But, the timing is tricky and not helped by the fact that the German bond market blew up this week...
Source: Bloomberg
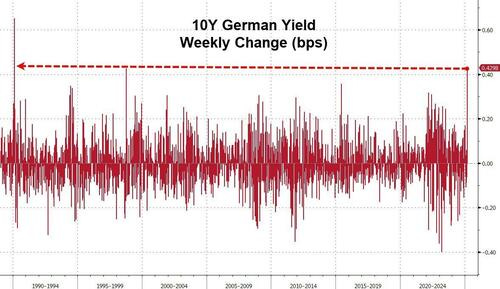
...and likely trigger VaR shocks around the rest of the world...
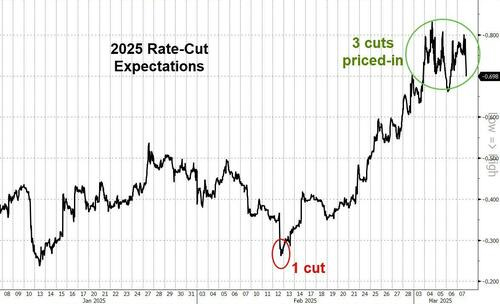
… And despite Fed Chair Powell playing down any need for speed to move on rates anytime soon, markets moved expectations significantly more dovish this week (now pricing in 3 full 25bps cuts by year-end)...
Source: Bloomberg
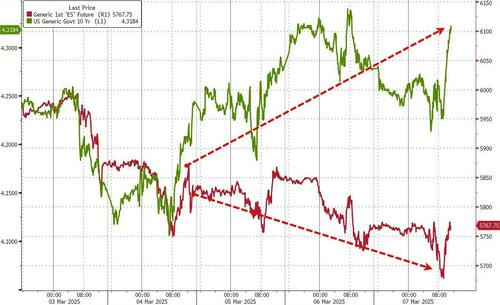
Quite a disconnect between bonds and stocks this week (both clubbed like a baby seal)...
I’ll move on TO some of Global Walls WEEKLY narratives — SOME of THE VIEWS you might be able to use. A few things which stood out to ME this weekend from the inbox
NFP recaps and victory laps time of the month SO lets jump right in …
… a large UK shop …
Barclays: US Economics: February employment: Soft around the edges
February's nonfarm payroll gains were fairly solid, at 151k, with limited effects from DOGE layoffs. That said, details showed some signs of softening, including slowing payroll income growth and an increase in the underemployment rate amid a rise in part-time workers, making possible a May Fed cut.
US policy volatility has intensified, contrasting an uneventful NPC in China. High uncertainty is likely to slow US growth, even if payrolls remain solid for now. In Europe, the US's foreign policy change has sparked a paradigm shift towards more strategic spending. Next week, we watch US CPI…
…US Outlook Uncertainty is the only certainty Trump briefly implemented 25% tariffs on Mexico and Canada this week before kicking the can down the road until after the April 1 conclusion of its trade investigation. Although incoming data were mostly comforting, the experiment hints at a willingness to undermine growth that poses downside risks.
Headlines from February's employment report remained fairly solid, with payroll employment moving up 151k amid only modest declines in federal jobs and an uptick in the unemployment rate to 4.1%. Details show signs of softening that may put a May FOMC cut in play if they gather momentum, including a jump in underemployment and a notable slowing in payroll income.
Other indicators were mixed, but generally suggest that the economy held up fairly well through February, with initial claims normalizing following an earlier jump, ISM headlines still in resilient territory, and auto sales rebounding. Markets are more inclined to focus on negative indicators, including this week's February jump in the noisy layoff indicator from Challenger.
Although the administration eventually pushed off most of its 25% tariffs on Canada and Mexico, the aborted attempt demonstrates some willingness to inflict pain on equities and activity that surprised markets. Pre-blackout communications by Powell and others surprised by making no mention of a potential shift to cuts, though more convincing data may well shift their thinking.
Headline payrolls came in at 151k in February vs. 160k consensus and 125k prior. Private-NFP gained 140k vs. 145k expected, while Jan was revised down to 81k vs. 111k anticipated. Manufacturing jobs were +10k vs. -5k prior and +3k forecasted. The Unemployment Rate unexpectedly gained by 0.1 pp to 4.1%, while the Labor Force Participation Rate slipped by 0.2 pp to 62.6% -- making the increase in the UNR all the more troubling. On an unrounded basis, the UNR ticked up to 4.139% vs. 4.011% prior. Moreover, we also saw the Underemployment Rate jump to 8.0% vs. 7.5% prior -- the highest since October 2021. As for wages, AHE matched expectations at 0.3% MoM, but January was revised down to 0.4% vs. 0.5% initial. YoY nominal wage growth is 4.0% vs. 3.9% prior. Overall, the data was close to expectations with some troubling details.
Treasuries rallied into the event, cheapened on the headlines, and has since rallied back. From here, we'll be monitoring the incoming Fedspeak with special attention to Powell's midday comments…
In the week ahead, attention will shift to the inflation data with the combination of CPI and PPI poised to set the tone for the Treasury market ahead of the March 19th FOMC decision. The Fed isn’t expected to change rates (in either direction), as reflected by the 96% odds of an unchanged outcome being priced into the futures market. The more potentially pivotal revelations will come from the SEP and dotplot. The futures market is pricing in ~70 bp of rate cuts by year-end, and in the event that the FOMC simply marks to market the dotplot (which has been the recent trend), we expect this will be read dovishly and further contribute to the steepening move that has already brought 2s/10s above 35 bp. The upcoming 10- and 30-year auctions will also contribute to the steepening bias – although we’re all too cognizant that the performance of risk assets could ultimately set the tone in financial markets more broadly. With the S&P 500 down >2% on the year, concerns about a further unwind of the Trump-inspired risk rally have become more topical…
…The February Employment Situation report offered data points for both the bond bulls and the bears. While technically nonfarm payrolls at 151k missed the consensus of 160k, the headlines from Washington DC related to downsizing the federal government left investors wary of a more disappointing print. Said differently, NFP was well within the range of acceptability for the market to retain the perception that US employment conditions remain strong. Those looking for reasons to worry took solace in the increase in the underemployment rate, which jumped to its highest level since October 2021 at 8.0%. This shift was driven by a drop in fulltime employment and gains in part-time work as revealed in the household survey. The unanticipated increase in the UNR was also concerning, particularly when coupled with the drop in labor force participation.
…On the supply front, the market will be tasked with underwriting $58 bn 3-year notes on Tuesday, $39 bn 10-years on Wednesday, and $22 bn long bonds on Thursday. Each of the auctions will clear at significantly richer levels than they did in February, and it will be interesting to see a snapshot of the demand profile for Treasuries following the broader repricing to a lower rate plateau. One unique factor that we'll take into consideration for the 10- and 30-year offerings is the bearish underpinning of the German bond rout on the nation's historic spending plans for defense and infrastructure. While the Treasury market hasn't (yet) been dragged down with European bonds, our recent client survey indicated that a large contingent of the market sees significant potential for US long-end rates to be pulled higher by the weakness in Bunds…
…Returning to our long bond position, we’ve set our initial target at 4.40%, just below the year-to-date low yield mark of 4.42%. Overhead, our stop out is set at 4.72%. There are a handful of key technical barriers that must be traded through in the path toward this level. The list includes the 100-day moving-average (4.626%), the local yield peak of 4.633%, an opening gap from 4.653% to 4.655%, and a series of key weekly opens/closes from February in the 4.68-4.70% zone. Below, initial resistance comes in at 4.50% before the 200-day moving-average (4.465%)…
Nonfarm payrolls at 151k points to solid labor demand through February – easing concerns that the US economy might hit a hard stop in Q1 2025 – but cannot fully negate worries that a slowdown from business uncertainty may be forthcoming.
The rise in the unemployment rate and drop in household survey employment measure were softer spots.
We think the result is strong enough to allow the Fed to signal it will stay on hold for now, as it assesses trade-offs between looming inflation risks from tariffs and downside risks to the economy emanating from tariffs and other policy changes out of Washington.
… strategist from MS has in past couple mos gone to large French institution and some thoughts on SUPPLY worth a look …
BNP: No coupon increases through 2027? | US Rates Insights
Guneet Dhingra, Timothy High, Sebastian Mauleon KEY MESSAGES
Treasuries and TIPS: Treasury yield curve was steeper over the week – all of the steepening occurring in overnight trading – we think Treasury markets reacted much more to changing supply/demand dynamics, rather than growth concerns.
We think another type of “debt brake” needs to be considered by investors – where the US Treasury has the option to put a “brake” on raising coupon increases – which they could pursue through 2027 – way longer than investors expect. We stay in 2s10s curve flatteners and long 10y TIPS.
Money markets: SOFR has exhibited signs that liquidity is transitioning closer to "ample" conditions, with SOFR expected to settle within a new 10-15bp range above the RRP rate by H2. We remain short July 1m SOFR/FF futures contracts.
Volatility: After the fall in yields, negative convexity concerns appear to be creeping into markets, most evident in the move higher in gamma receiver skew.
… The other attributed reason for steepening was the market pricing more rate cuts amid “growth concerns”. While growth data has been weaker, a combination of cold weather depressing activity, and seasonality issues mean it is difficult to extrapolate recent growth data. Additionally, we think Fed chair Powell has not ratified or contradicted growth concerns in his latest communication – so the market pricing of additional rate cuts (see Figure 2) may not be durable.
… same shop, different group looking ahead to CPI …
We anticipate that the initial effects of tariffs may start to appear in February CPI data. We estimate a 0.20pp increase in core goods inflation and a corresponding 0.05pp impact on core CPI from Trump’s initial 10% tariff hike on China.
We saw evidence of residual seasonality in January, albeit less pronounced than in the last couple of years. If past is prologue, we expect to see some related upside in February as well.
We forecast 0.3% m/m gains in both headline and core CPI, with risks roughly balanced.
A rather large German institution with a chartbook recap of jobs …
DB: US Economic Chartbook - February jobs: Steady gains keep Fed on sidelines
…In summary, the February employment report showed more of the same with respect to underlying labor market trends. Indeed, as Chair Powell noted in a speech shortly after the release, "Many indicators show that the labor market is solid and broadly in balance." We would agree, and as long as that remains the case, the Fed is likely to remain on hold this year, which has been our long-standing call.
…Feb headline payrolls (151k) below the 6-month average but still solid
… and same shope on (equity)flows and positions …
DB: Investor Positioning and Flows - Now Slightly Underweight
What stood out this week: Equity positioning has continued to slide and is now slightly underweight for the first time since the short-lived dip last August; a full decline to the bottom of its historical range, as we saw during the trade war in 2018-19, could drag the S&P 500 lower by about 8% to 5300; while overall implied volatility has risen, it is not extreme, and the vol premium versus realized vol is about average; implied correlations between S&P 500 stocks likewise have also risen but are not yet at extremes seen in prior large selloffs; with another $4bn going in, flows into European equity funds over the last 4 weeks have jumped to levels last seen in 2015, i.e., when excitement was sparked by the ECB’s first QE announcement; given the extent of the rotation of equity flows just after the election into the US and out of the rest of the world, there is plenty of room for continued strong inflows into Europe and other regions.
AND … another recap / victory lap from a shop that is 15x smaller than Vanguard YET earns as much … hmmmm ….
Nonfarm payrolls increased 151,000 in February, narrowly lagging the consensus expected 160,000. Payroll gains for December and January were revised down by a total of 2,000, resulting in a net gain, including revisions, of 149,000.
Private sector payrolls rose 140,000 in February but were revised down by 16,000 in prior months. The largest gain in February was in health care & social assistance (63,000). Manufacturing rose 10,000 while government increased 11,000.
The unemployment rate ticked up to 4.1% in February from 4.0% in January.
Average hourly earnings – cash earnings, excluding irregular bonuses/commissions and fringe benefits – rose 0.3% in February and are up 4.0% versus a year ago. Aggregate hours increased 0.1% in February and are up 0.6% from a year ago.
Implications: … Meanwhile, average hourly earnings rose 0.3% in February and are up 4.0% in the past year. The Fed would probably like to see that annual gain closer to 3.5% before it’s comfortable with the path toward 2.0% inflation. Notably, federal government payrolls (excluding the Post Office) declined 7,000 in February, the largest drop for any month since 2022. Given the Trump Administration’s goal of reducing the federal workforce, we expect more of this in the months ahead, potentially much more. That may cause some short-term pain for the US economy, but we expect long-term gains from reducing the size and scope of the federal government, including more jobs gains in the private sector.
We’re Americans and we can and will prevail, passing whatever tests come our way …
ING: Resilience of US job creation set to be tested
The US economy added 151k jobs in February, but with DOGE’s influence increasingly being felt on the economy the risk is that we start to see renewed softness in the months ahead
AND yet another NFP recap … from former BAML, Barclays economist now …
MS: U.S. Economics: February Employment: Solid payrolls, but expect slowing ahead
Bottom Line: Solid payrolls, but a hint of new weakness in the household survey. This report tells us little about coming months, as changing fiscal, trade, and immigration policy, along with increased uncertainty, are likely to weigh on the labor market.
Key takeaways
Solid payroll growth but a hint of new weakness in the higher unemployment rate and decline in labor force participation.
Payrolls rose 151k despite a drag from federal employment.
The unemployment rate rose a tenth to 4.1% but would have risen to 4.4% except for lower LFPR.
This tells us little about coming months as changing fiscal, trade, and immigration policy, along with increased uncertainty are likely to weigh on growth.
… along with THE best in the biz, there are others out there positioning for LOWER YIELDS just ahead … and as they say that (at least in the title) they are getting OUT of long 5s but then buying them vs 2s30s
MS Stay Positioned for Lower Yields During the Detox Period | US Rates Strategy
Treasury Secretary Bessent suggested the US economy would go through a "detox period" and that the "Trump put" did not exist. Investor growth expectations should deteriorate further as long as tariffs, related threats, and austerity continue. Stay positioned for lower yields, short TIPS breakevens.
Key takeaways
10y Treasury yields might be 36bp lower than Friday's closing levels – bringing the yield below 4.00% – if the EU Defence Summit ended differently.
10y Treasury yields might be 25bp higher than Friday's closing levels if investor concern about the negative growth impact of tariffs didn't increase this week.
A more two-sided US Treasury market today suggests investors should prioritize carry and expected roll down if they want to remain positioned for lower yields.
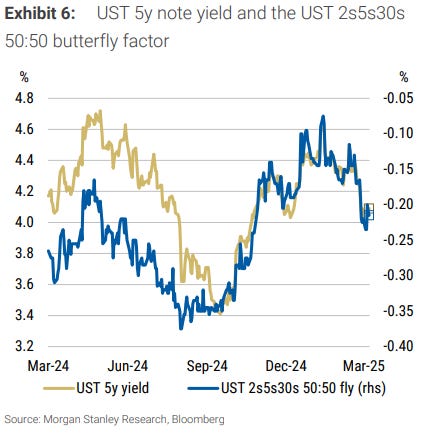
Stay positioned for lower yields via the 2s5s30s butterfly, short 10y TIPS breakevens, long 2y TIPS, long May fed funds futures, and M5/Z6 flatteners.
Outside of tariffs, growth expectations remain at risk of a further decline – at least temporarily – if the US government shuts down after March 14.
…The level of 5y yields and the level of the 5y yield relative to the combination of half the 2y and half the 30y yield correlate positively (see Exhibit 6 ).
… SAME SHOP noting if things are so bad and everyone’s runnin’ scared in TO MMFs, what we supposed to do …
MS: MMF AUM at Record High; Time to Play Defense? | US Rates Strategy
Record-high MMF AUM has occurred amid more downside volatility in risk assets, indicating a more defensive posture. A more uncertain macro environment may have prompted the strong retail inflows in February. Amid growth and funding risks, stay in SFRM5Z6 flatteners and short SERFFJ5.
Key takeaways
Money market fund (MMF) assets under management (AUM) made a record high when total AUM hit $7.366tr on March 6, perhaps a surprise to some investors.
An increase in the pace of retail inflows this year suggests that a more uncertain macro environment has investors adopting a more defensive posture.
Increased investor concern about downside risks to the growth slowdown – which our economists expect – supports further inflows into MMFs.
… As shown in Exhibit 6 , MMF AUM tends to increase leading up to and during a recession.
Given risk asset sensitivity to lower growth expectations, we maintain SFRM5Z6 flatteners and see markets trading with a "fewer cuts now, more later" mantra.
Funding has moved away from soft conditions after year-end, with dealer balance sheets now showing the impact of sizable coupon issuance; stay short SERFFJ5.
… A higher earnings yield (lower P/E multiple) signals equities are possibly undervalued; a lower earnings yield (higher P/E multiple) signals equities are possibly overvalued. We compare the S&P 500 earnings yield to the average 7-day yield offered by MMFs to assess the relative attractiveness of equities compared to cash over time (see Exhibit 7 ).
… thinkin’ ates vol ‘bout to decline, then this next note is for you …
We recommend investors tactically sell rates volatility given current Fed guidance and a sparse data calendar. We see value in bullish listed option structures targeting deeper Fed cut pricing.
Key takeaways
We recommend fading this week's vol rally by selling 1m5y straddles vs. 1m30y straddles, both legs delta-hedged.
A sparse economic calendar over the coming weeks and current Fed guidance warrant playing for a normalization of tail-switches.
Moreover, recent Fed-speak implies growth-induced volatility could manifest via outsized back-end moves.
We recommend buying the SFRM5 96/96.25/96.5 call butterfly for 2.26ticks.
We think SFRM5 pricing could increase as long as tariffs, related threats, and austerity continue.
…All in, today's jobs data by themselves are unlikely to move the needle very much from a policy perspective, but obviously there's a laundry lists of downside risks in coming months that official will be closely focused on. Fed Chair Powell will speak on the "Economic Outlook" today at 12:30 EST. We suspect he will reiterate no sense of urgency to act and signal the Fed is in a "wait and see" mode. Our own forecast shows with so much uncertainty around the outlook and inflation staying elevated this year, the Fed will have difficulty doing anything this year. While we think the hurdle for a near-term rate cut is high, we wouldn’t fully rule out any renewed action at some point down the road, but that may not happen until sometime in 2026. For more on our economic and monetary policy outlook, see …
US: Update to Fed call 28 Feb 2025 With so much in doubt, we’re taking rate cuts out
Summary: In light of growing uncertainty around the economic outlook and uncharted policy shifts by the new administration, we no longer expect the Fed to cut rates in 2025 and, for now, are not showing any moves (in either direction) from Fed officials. While we think the hurdle for a near-term rate cut is high, we wouldn’t fully rule out any renewed action at some point down the road, but that may not happen until sometime in 2026.
Our neighbors to the north would love to spin this as worst jobs report eva …
RBC: U.S. government policies weigh on job growth in ‘25
The Bottom Line: This report is reflective of government policies weighing on growth in 2025. Health care remained the primary driver as its growth held steady (we expect to see health care continue to grow with the aging of the U.S. population). But we saw job losses in the Federal government and leisure and hospitality. While the Federal layoffs should not be a surprise given the recent layoff announcements by DOGE, what is interesting is the drag seen in Food services – a sector that is likely facing a shortage of workers due to the slowdown in immigration. Looking ahead, we expect the uncertainty around tariffs will weigh on payroll growth in trade-related sectors and look for the DOGE layoffs to continue to subtract from headline growth. This trajectory poses upside risk to our unemployment forecast, which we currently have rising to 4.2% by year-end.
…Household survey details: unemployment rate ticks up …In our preview, we discussed the risks to the unemployment rate pertaining to federal government job cuts and the deferred resignation program. We would remind readers that people let go, and who say they do not expect to return to the same job, and are looking for work should be counted as unemployed. For the deferred resignation program, the classification would depend on whether they answer the questions as if they intend to return to that job at any point. Based on the terms of the agreement, we assume they would not, but the survey can have difficulty classifying short-term unemployment. In theory, individuals who did not work at all during the week, did not expect to return to their employer, and were looking for work should be counted as unemployed. In our preview, we also flagged the risks of a declining sample response rate for a shrinking share of the population. At this point, the sample is down to about 42K households representing 333 million people, and as such that could present challenges to capturing impacts of federal jobs cuts.
… We're at a stage where we're still very uncertain about what will be tariffed for how long, at what level. We're going to have to wait to see all of that. But the likelihood is that some of that will find its way. You know, it'll hit the exporters, the importers, the retailers, and to some extent, the consumers. And we'll see what that is. And in a simple case, where we know it's a one time thing, you know, the textbook would say, look through it. But … you would also want to be sure of a couple of things. One just is that if it turns into a series of things and it's more than that and … if the increases are larger, that would matter. What really would matter is what's happening with longer-term inflation expectations and how persistent are the inflationary effects… — Chair Powell, March 7
… and finally, a few words on the <economic> week ahead …
UBS: US Economics Weekly More tariffs, more uncertainty
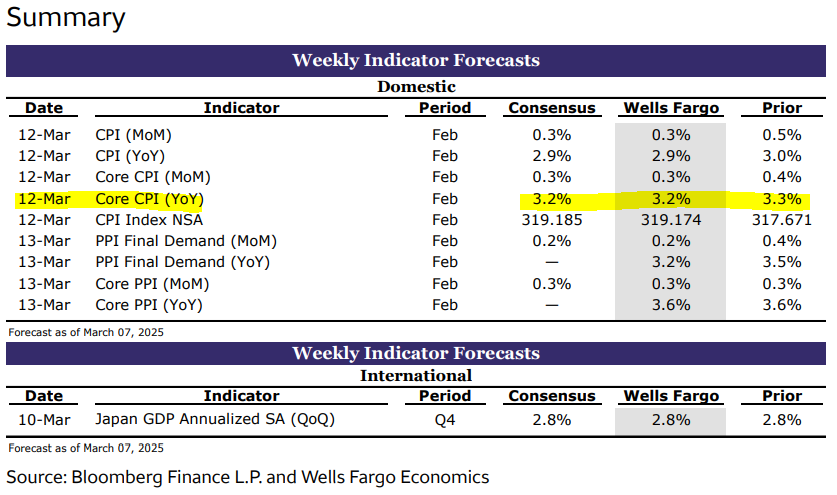
…The Week Ahead: inflation week Government funding is set to run out March 14, posing risk the government shuts down, or at least nonessential functions. A full shutdown we estimate would cost the economy roughly 2 basis points of real GDP a day, and partial shutdown some fraction of that depending on what is idled. Steel and aluminum tariffs are slated to go into effect March 12, we expect these to have limited incremental impact. Inflation data will help frame the March FOMC meeting and the Summary of Economic Projections. We expect core CPI climbed 0.28% in February, leaving core CPI inflation at 3.2%. See Alan's preview here. The PPI and import price data will round out the tracking for core PCE prices but currently we expect core PCE prices rose 0.24% in February, implying core PCE inflation at 2.6%. The JOLTS hiring estimates for January next week should offer another glimpse on the potential impact of the federal hiring freeze. The Flow of Funds data should show another increase in household wealth in Q4 and the University of Michigan Survey Research Center's preliminary March data on Friday will offer the next update on households' longer run inflation expectations …
Covered Wagon folks on NFP …
Wells Fargo: February Employment: At Equilibrium, but What Comes Next?
Summary Nonfarm payrolls increased by 151K in February, which was slightly below their recent trend and consensus expectations. Revisions to prior months' data were minimal on net. Federal government employment declined by 10K in an early sign of what is to come amid the new administration's efforts to reduce the federal workforce. That said, state and local government employment more than offset this decline, and private sector hiring broadened out in February. The data from the household survey were more lackluster. The unemployment rate rose by one-tenth of a percentage point to 4.1%, while the broader U-6 "under-employment" rate rose by 0.5 percentage point amid a spike in those working part-time but who would like to work full-time.
Chair Powell faces a difficult task at the upcoming FOMC meeting to be held on March 18–19. Optimism about a labor market acceleration has faded amid cooler economic data, deteriorating sentiment and the rising probability of a major trade war. When viewed in isolation, this argues for a dovish tilt from the Committee at its upcoming meeting. However, with inflation still 50 bps or so above target and tariffs threatening to raise both spot inflation and inflation expectations, the Committee may feel constrained in its ability to act preemptively to stave off further labor market softness. For now, we suspect the FOMC will be content to stand pat in March, signal that two rate cuts remain the base case for the year and stress that the Committee is well-positioned to adjust monetary policy in either direction, as needed.
United States: Tariff Turmoil The U.S. economy added 151K jobs in February accompanied by higher unemployment and lower labor force participation. Economic developments elsewhere reflected heightened uncertainty around trade policy, prompting a leap in imports, concerned industry comments and reports of higher input prices.
…InterestRate Watch: What to Make of the 10-Year Treasury Yield? The 10-year Treasury yield has fallen sharply to start the year. The yield on the 10-year note began 2025 around 4.6%, and it got as high as 4.8% in mid-January. But over the past couple of months, a more dour economic outlook amid an escalating trade war have pushed yields down to roughly 4.26% as we went to print. Have longer-term yields fallen too far, too fast?
From a near-term, cyclical perspective, falling long-term yields make sense in the context of significantly higher tariffs. As tariff rates go higher and become more widespread across America's major trading partners, the risk of an economic downturn ahead increases, in our view. Furthermore, tariffs are revenue raising and deficit-reducing, all else equal. If 25% tariffs on Canada and Mexico and a 20% tariff on China are continuously maintained for the next 12 months, the tariffs will raise between $100 billion and $200 billion of new tax revenue. Deficit reducing policies also should reduce longer-term interest rates on the margin, all else equal. Coming into 2025, we had higher tariffs baked into our economic forecast for this year, and this is one reason our year-end forecast for the 10-year yield has been 4.25% over our past couple of forecast updates.
What about from a longer-term perspective? Interestingly, the current spot rate on the 10-year yield (4.26%) is not too far from its average in 2024 (4.21%). The Federal Reserve's most recent Survey of Market Participants, a regular survey of major financial institutions' expectations for the economy and markets, found that the median forecast for the 10-year Treasury yield over the “longer-run” was 4.20%. We generally concur with this view. Our working assumption is that the neutral fed funds rate is in the lowto-mid three percent range, while estimates for the term premium generally are 50-100 bps. Stack them together and 4.00%-4.25% seems like a reasonable starting point for the 10-year yield's fair value over the longer-run.
Of course, in the short run, markets can deviate significantly from that value. If trade tensions escalate further or the new administration adopts material fiscal consolidation, expectations for future rate cuts from the FOMC will rise, and investors will seek safe haven assets like U.S. Treasuries. Conversely, if trade tensions deescalate or Republicans in Congress opt to pass a large, deficitfinanced tax cut package, yields may rise closer to where they were one month ago. Our forecast is for the 10-year yield to rise modestly in 2026 as the hit from tariffs fades gradually while the impact from new tax cuts comes into focus. But for now, longerterm yields seem to have found a home in the ballpark of their longer-run fair value.
We haven’t had to change our subjective probabilities for our three alternative economic scenarios for quite some time. We are doing so today and may have to do so more frequently in coming months or even coming weeks in reaction to the volatile nature of policymaking under President Donald Trump. The initial animal spirits of Trump 2.0 have been trumped by the uncertainty unleashed by Trump Turmoil 2.0. The administration has been in office for less than two months. The whirlwind of tariffs imposed on America’s major trading partners, federal job cuts implemented by the DOGE Boys, and the upending of the world order have been head spinning.
We held off changing our probabilities because we expected that the master of the art of the deal was going to get a deal with Canada and Mexico that would allow him to declare victory and bury his threat to impose 25% tariffs on America’s only two neighbors and biggest trading partners. In fact, on February 28, US Treasury Secretary Scott Bessent said Mexico proposed matching Washington’s tariffs on China and urged Canada to do the same—signaling a potential path for Mexico and Canada to avert levies on their own exports in the coming days.
“I do think one very interesting proposal that the Mexican government has made is perhaps matching the US on our China tariffs,” Bessent told Bloomberg Television. “I think it would be a nice gesture if the Canadians did it also, so in a way we could have ‘Fortress North America’ from the flood of Chinese imports,” he said….
… Moving along TO a few other curated links from the intertubes, which I HOPE you’ll find useful …
First up when the facts change, well, things CHANGE and figuring out what all else changes, thats how you make money — provided you figure it out before everyone else does and so …
Apollo: Adjustment Costs Associated with Changing Policies
There are adjustment costs associated with changing trade policy and changing the size of the government sector, see chart below. The immediate question for markets is how big the short-term pain will be, see chart below.
… PAIN and the question is if its short lived or otherwise. Lets HOPE for a pleasant SURPRISE … TO THE twittersphere …
at Robin_j_Brooks
The widely-followed Citi surprise index (black) is suspect. A few days ago, it painted a very negative picture and got lots of publicity, when a simple moving average of US data surprises (blue) says data are "in line." There's too much policy noise, but the US economy is fine...
Job days have seen market reversals in the S&P 500 since September of last year (with an October exception). Does the $SPX launch off the 200-dma from here?
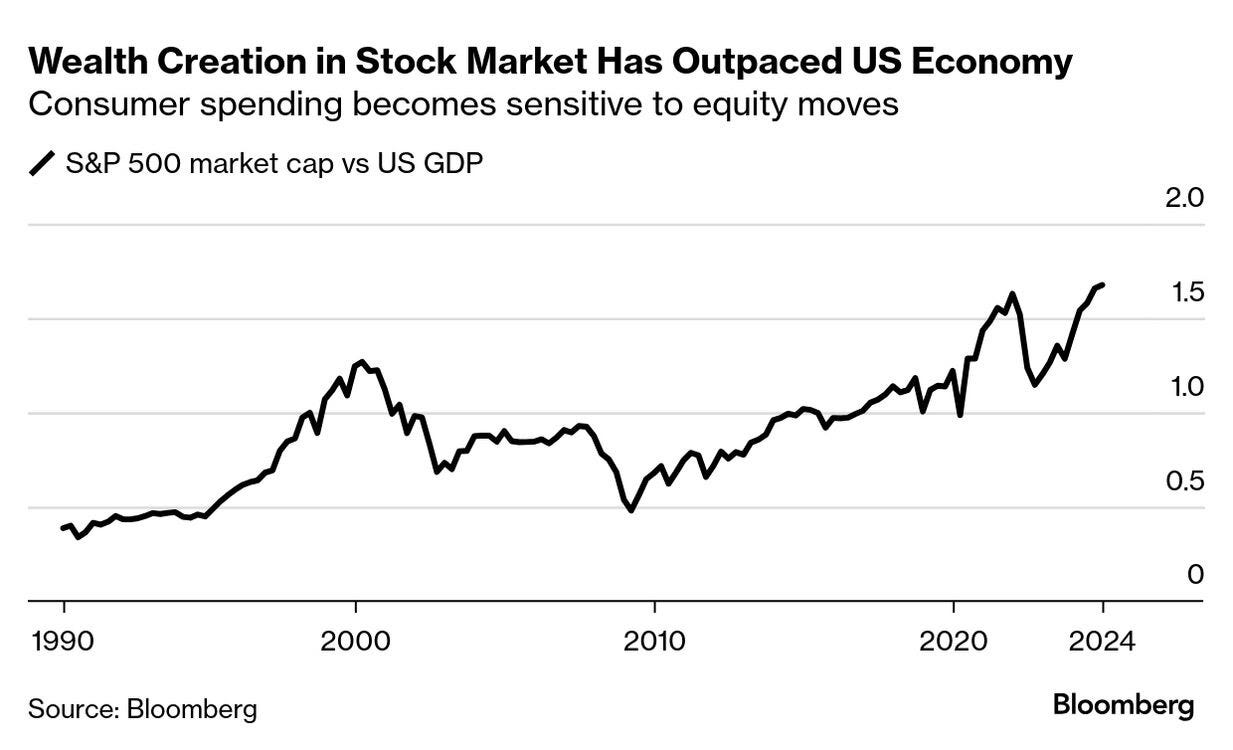
…Wall Street traders this week were hit by the biggest cross-asset losses since the Fed’s monetary-tightening campaign peaked in 2023. While we all know the reasons (see above), there’s cause to worry should the Washington-induced stock dive continue. Known as the “wealth effect,” people tend to spend when assets are buoyant and do the opposite when they’re not. While the scale of recent losses isn’t cause for panic just yet, the speed of the plunge is a reminder that markets themselves have the power to cause economic trouble should they continue to crater. “The wealth effect is a double-edged sword,” said Doug Ramsey, chief investment officer at Leuthold Group. “We doubt this economic expansion can survive a stock market correction of more than 12-15%.”
AND …
Bloomberg: Inflation-Linked Bonds Rebound on Trump Tariffs: Credit Weekly
(Bloomberg) -- Money managers are flocking to bonds that hedge against inflation amid uncertainty about tariffs and their impact on the cost of living…
…And looking deeper in bond markets, there are signs that investors are worried about price changes across the economy. Short-term inflation expectations have risen above longer-term ones.
Inflation-linked bonds are a “great option value” in case prices creep back up, Bridgewater Associates Co-Chief Investment Officer Bob Prince wrote in a note this past week. Bank of America Corp. strategist Mark Capleton, meanwhile, expects strong retail interest in shorter-dated Treasury Inflation Protected Securities funds because of the risks from tariffs and other policy uncertainties.
The bonds also typically have longer duration, which can help fuel gains if yields fall…
… away from The Terminal and TO wrap this up … Consumer Credit via …
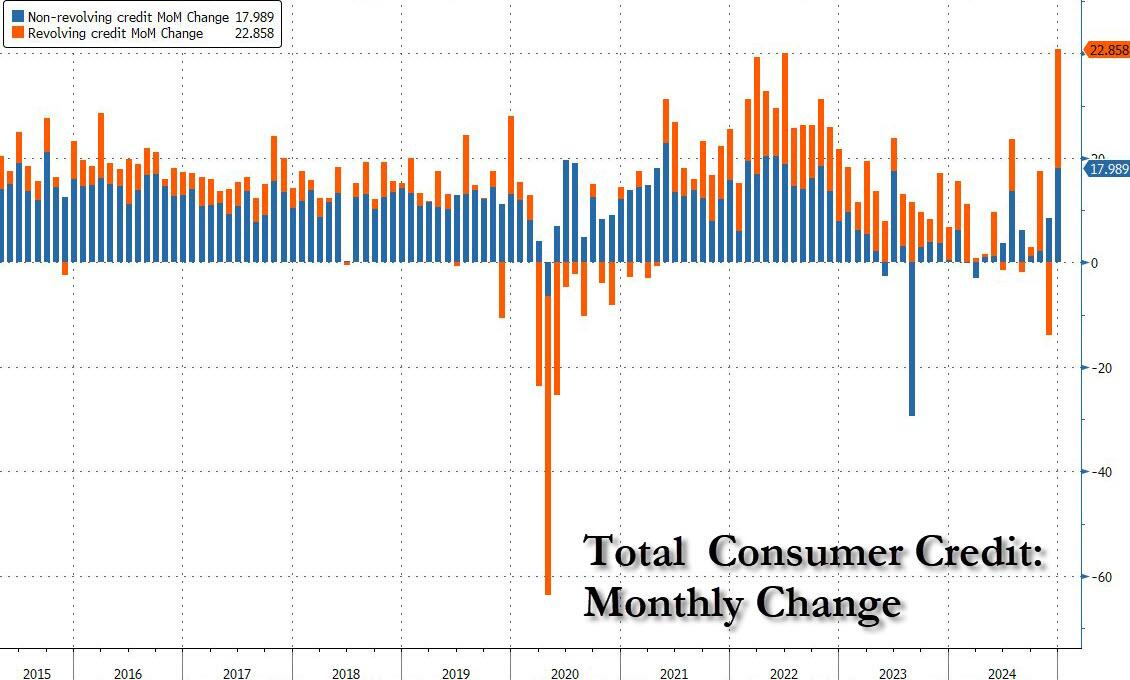
ZH: Consumer Credit Jumps More Than Expected In January, Back Over $5 Trillion
…... US consumers had no choice but to max out their credit cards in order to "extend and pretend" their moment of purchasing greatness, or as we called it three months ago, their last hurrah (see In "Last Hurrah", Credit Card Debt Explodes Higher Despite Record High APRs As Savings Rate Craters), a hurrah that would last very briefly as it was only a matter of months if not weeks before said cards were denied.
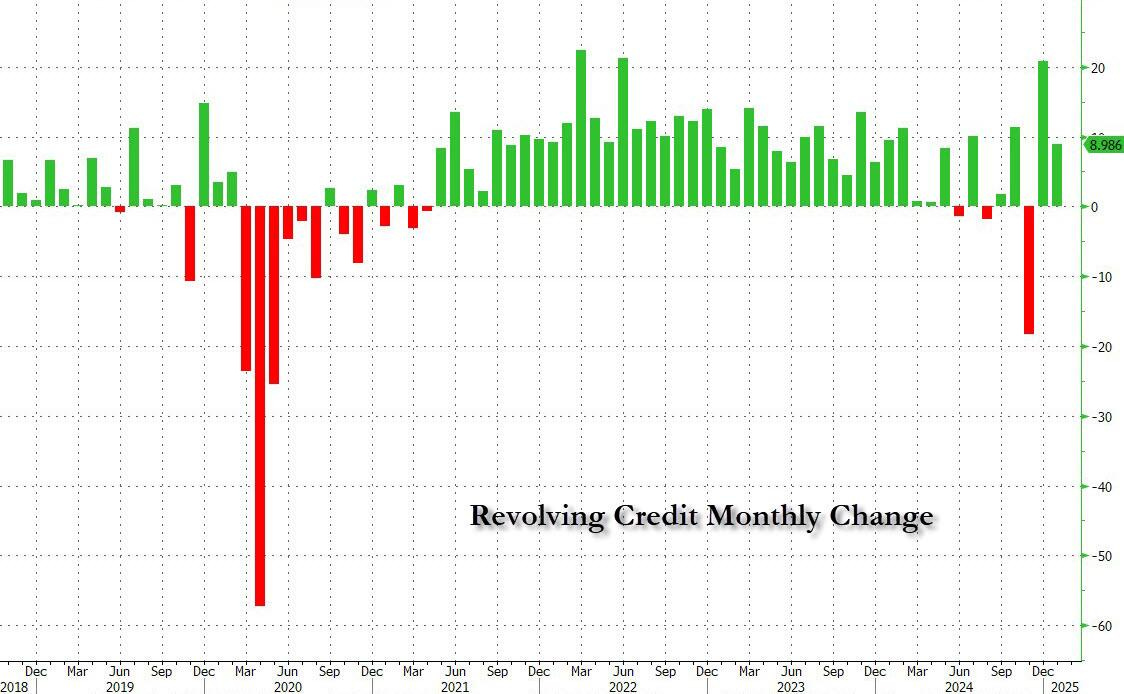
One month later, that's exactly what happened, when to our surprise, revolving credit cratered at the fastest pace since the covid crash, contracting a whopping $13 billion, an event which for a country that lives on debt - literally - is unheard of outside of a recession.
Commenting on the plunge, we said that "we don't know what sparked this sudden reversal in the favorite American pastime - i.e., to buy stuff one can't afford and hope to pay it back some time in the future for a modest 29.95% APR - but we know what didn't: falling rates... because they didn't." We then proceeded to show that the average interest rate on credit card balances were at the second highest on record ever though the Fed had already cut rates by 100 bps.
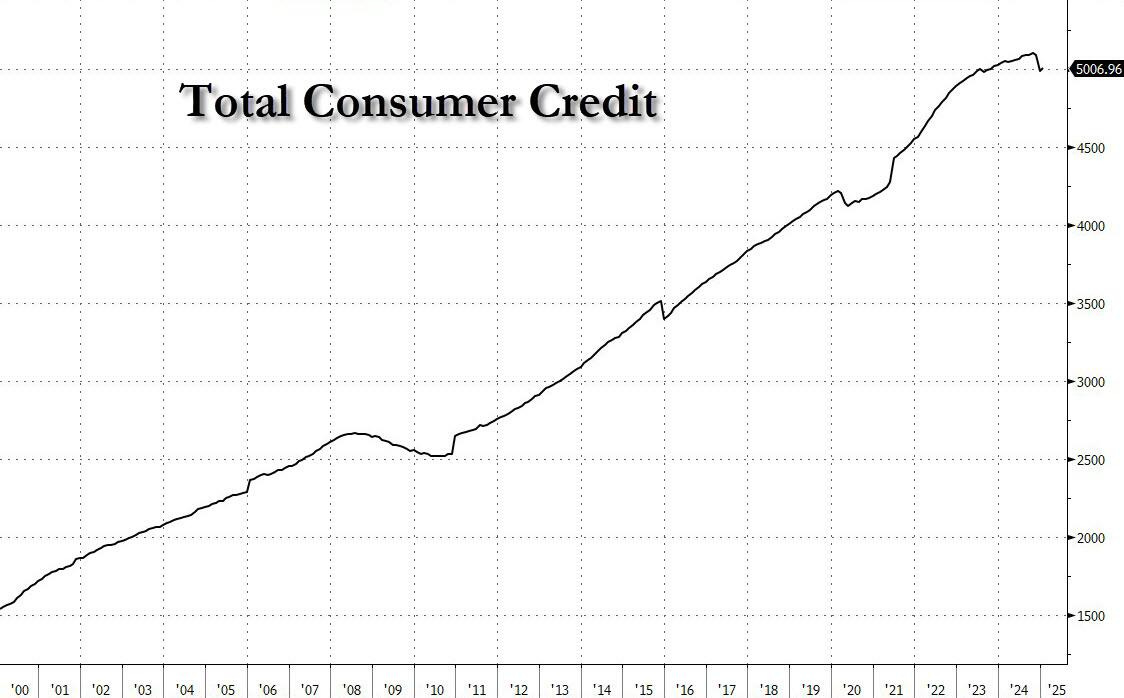
And while it would have been normal, if not expected, for credit card balances to continue declining with savings rates near record lows and with credit card rates at record highs, trust the US economy to do precisely the opposite of what is logical and according to the latest just released consumer credit data, US consumers exited 2024 with a bang after Consumer credit soared by a record $40.8 billion in December, a complete reversal of the November drop, and a month that sticks out like a sore thumb in the history of consumer credit as shown below.
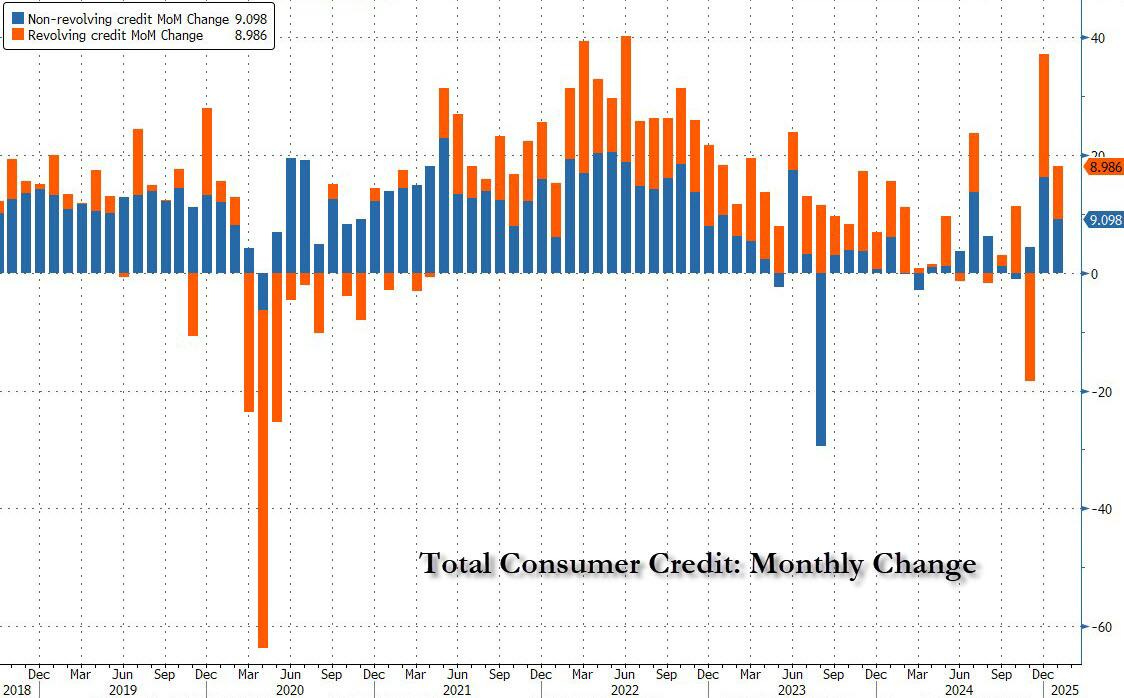
And while one would expect that the record December surge in credit would quickly reverse at the start of the year amid the ongoing drawdown in savings - and the lack of holiday spending - the US consumer has a habit of doing just the opposite of what is expected, and according to the latest NY Fed data, in January consumer credit surged again, rising by $18.084 billion (from a downward revised $37.1 billion vs $40.8 billion previously), and the third highest monthly increase since June 2023...
... which sent the total back over $5 trillion.
Taking a closer look at the number, revolving credit - i.e., credit card debt - increased by $9 billion or roughly half of the near record $21 billion surge in December.
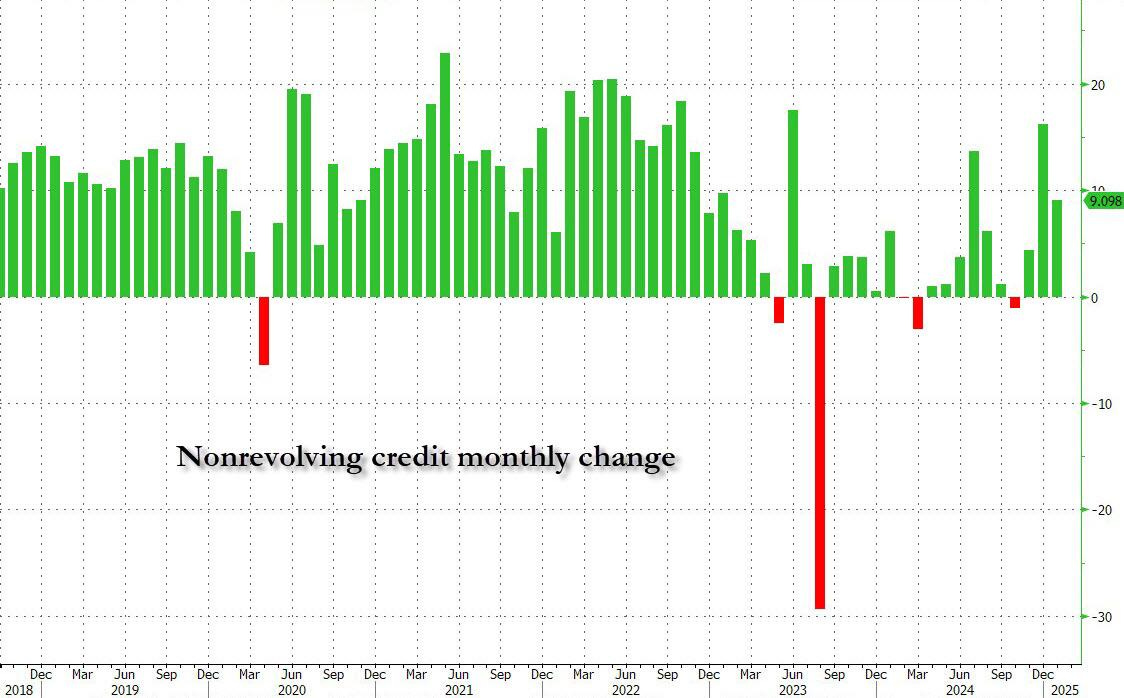
Non-revolving debt (i.e. student and auto loans) rose almost by the same amount, up $9.1 billion and also down from the $16.2 billion the previous month.
… AND for any / all (still)interested in trying to plan your trades and trade your plans in / around FUNduhMENTALs, here are a couple economic calendars and LINKS I used when I was closer to and IN ‘the game’.
First, this from the best in the strategy biz is a LINKthru TO this calendar,
Before hitting SEND and on The Fed Model (referenced above) …
I’m certain there’s more ‘out there’ and I’ll continue to scour inbox and chat with friends … IF anything further worth a look I’ll angle to send something out before Sunday evening markets open. If NOT, then … Enjoy whatever is left of YOUR weekend …