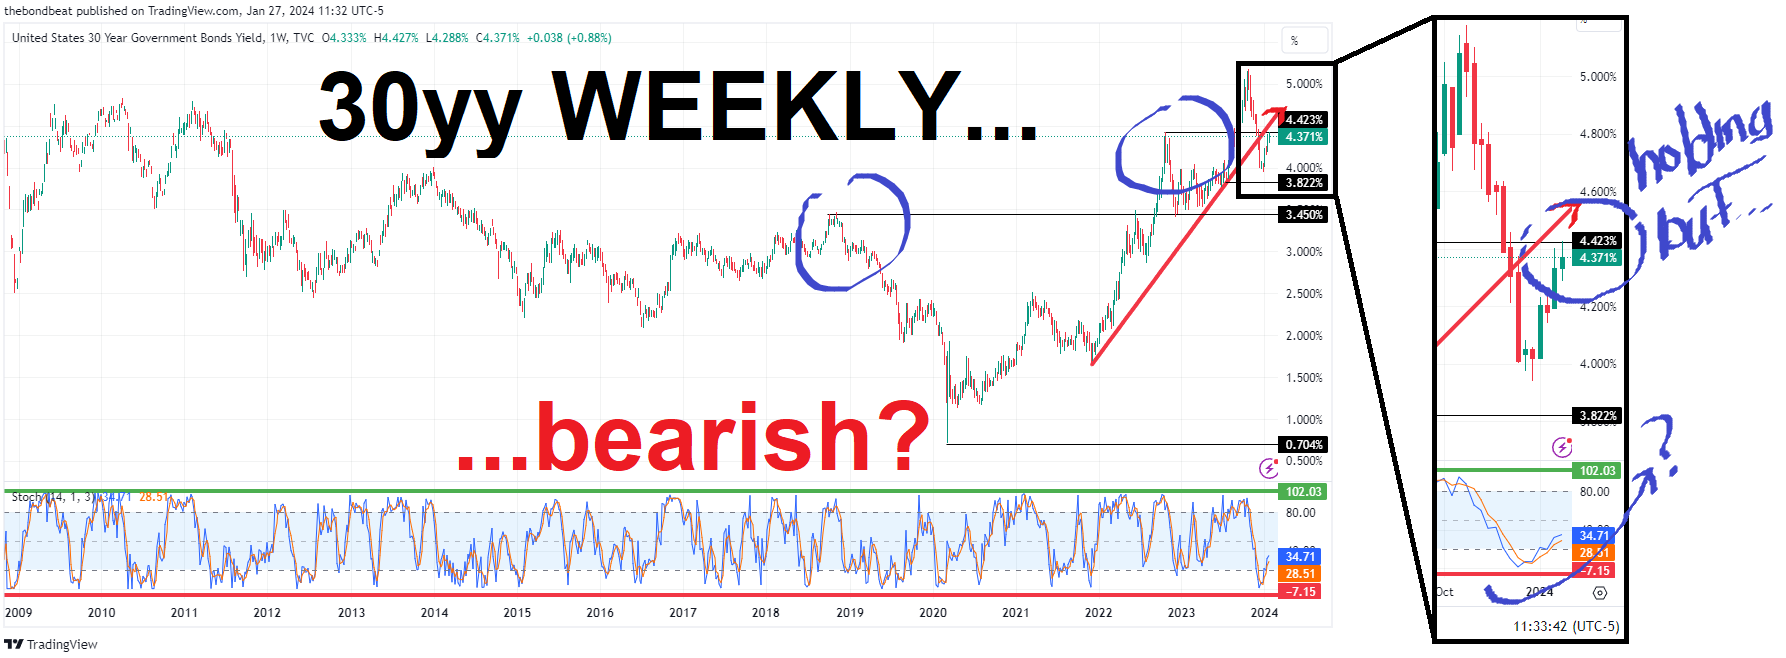
Good morning / afternoon / evening - please choose whichever one which best describes when ever it may be that YOU are stumbling across this weekends note…
… momentum setup BEARISH (for more / bullish look see note / visual YEST or RenMAC look at DAILY just below).
I’m torn here and would simply think the week ahead — WEDNESDAY specifically with QRA (reFUNding) and FOMC poses lots of EVENT RISK (pick a direction and a time frame) and the economic slowdown expected to be on FULL DISPLAY Friday (NFP). Rates DROP Friday, I’d suppose I’d lean on weekly and look to lighten up / book profits / get short-duration.
It IS to be the year of the steepener, again, right?
Widows and orphans should feel comfy buying 2s, right? NOT MY ADVICE — i’m NOT in that game — please refer to Convexit MAVEN (aka Mr. MOVE) below.
I’ll quit while I’m behind — as my dad once said if yer gonna get out of a hole, first step is you gotta stop diggin’.
NEXT lets deal with a data from yesterday …
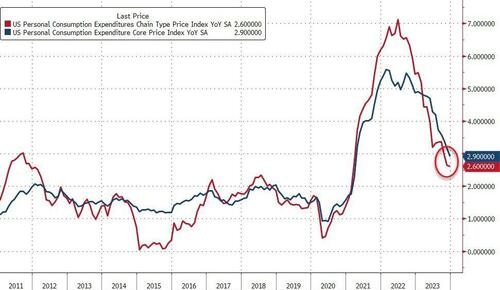
ZH: Savings Rate Slumps As Fed's Favorite Inflation Signal Hits 2 Handle (unequivocally good news for Camp Rate Cuts BUT … as always, there’s some DEVILS in details …)
One of The Fed's favorite inflation indicators - Core PCE Deflator - tumbled to +2.9% YoY in December (below the 3.0% exp and down from 3.2% in November) - the lowest since March 2021.
Headline PCE Deflator rose 0.2% MoM, holding at +2.6% YoY in December ...
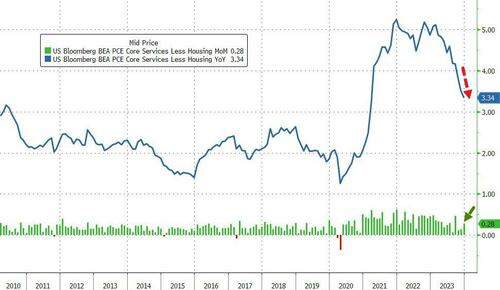
… Even more focused, from The Fed's perspective, is Services inflation ex-Shelter, and the PCE-equivalent shows that it has broken down from its 'sticky' levels to its lowest since March 2021 (thanks in larg epart to base effects). But, we did see a 0.3% MoM jump, considerably bigger than the last few months increases....
Source: Bloomberg
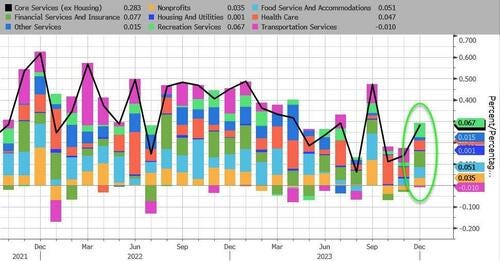
Under the hood, SuperCore PCE inflation indicators are all ticking back higher MoM...
Source: Bloomberg
… the DATA has FED the narrative of rate CUTS — not IF but when — and I’m reminded of one of the old ‘rules of trading’ — whether they are GARTMANS or TRUE legend — Bob Farrell — rules (via StockCharts.com HERE) where Rule #9 is
… 9. When all the experts and forecasts agree – something else is going to happen.
Translation: This rule fits with Farrell's contrarian streak. When all analysts have a buy rating on a stock, there is only one way left to go (downgrade). Excessive bullish sentiment from newsletter writers and analysts should be viewed as a warning sign. Investors should consider buying when stocks are unloved and the news is all bad. Conversely, investors should consider selling when stocks are the talk of the town and the news is all good. Such a contrarian investment strategy usually rewards patient investors.
EVERYONE EVERYWHERE is WHEN not if … THAT in and of itself SHOULD be reason to pause and think about the WHAT IFS …
Ok I’ll move on AND right TO the reason many / most are here …some UPDATE WEEKLY NARRATIVES … some of THE VIEWS you might be able to use. This weekend is as much FOMC and QRA (Quarterly ReFUNding)PRECAP as ever … so NEXT weekend will be post op NFP victory laps … meanwhile, THIS WEEKEND, a couple / few things which stood out to ME this …
… We came into this cycle operating under the assumption the Fed was not only likely to trigger a meaningful economic slowdown and risk a recession, but that Powell was comfortable doing so…
DB: A marathon not a sprint (on RATES and THE LONGEST OF LONG GAMES and arguably a very BULLISH — ie rates gotta drop down TO 10yr avg — see the chart)
… 10yr US yields usually hug their 10yr moving average quite closely over time. However, at the moment they’re nearly 200bps above it. It’s similar in terms of distance from the 5yr moving average. The only period where they were further away was during the 1970s…
JEFF weekly “ ‘Mis’-Leading Indicators (following last weeks updated econ call)
… Former Fed Vice Chairman and self-styled Fed historian Alan Blinder, has identified 5 soft or "softish" landings in the 11 tightening cycles since 1965. However, these analyses depend heavily on the subjective definition of a "soft landing", and our standard is a bit tighter than Mr. Blinder's. The issue lies more with what is defined as a "landing" more so than whether or not it is "hard" or "soft". For example, the hiking cycles in 1965-66 and 1984 did not cause recessions, but it is debatable whether they actually tamped down inflation sufficiently …
Moving along and away FROM highly sought after and often paywalled and Global Wall Street narratives TO a few other things widely available and maybe as useful from the WWW
AllStarCharts: Tracking the Bounce in Interest Rates (for short version see ‘toon below)
High-yield bonds are printing fresh highs relative to US Treasuries – signs of a healthy risk appetite.
And interest rates are trending lower since peaking last October.
But looking ahead to next month, we could see rates correct higher.
The US 10-year yield tends to rise in February – more so than any other month of the year except April:
It would make sense for this seasonal trend to continue.
The 10-year yield dropped more than 100 basis points during Q4 last year.
The Fed’s hiking cycle has desensitized many to the large swings in treasury yields. Nevertheless, that’s a significant move for the US benchmark.
A retracement in the coming weeks compliments a more prolonged decline over the coming months and quarters as yields don’t move in a straight line.
A near-term rise in the 10-year also fits with the recent US dollar strength.
So, how far will rates rise in the coming months?
The 4.25 area seems reasonable:
It coincides with the October 2022 peak and the 38.2% retracement of the recent decline.
The 10-year yield hovers roughly 15 basis points below that level today.
I want to give the US benchmark rate extra room to recover from last quarter’s decline, re-evaluating the intermediate downtrend if the 10-year rips above 4.50. It’s a run-of-the-mill correction until then.
February likely brings sideways action for all the major asset classes – stocks, bonds, and commodities. Don’t let the choppy action throw you off course.
If the Fed cuts in March, it will be eight months after the last Fed hike, which is exactly the average of all previous Fed hike cycles, see chart below.
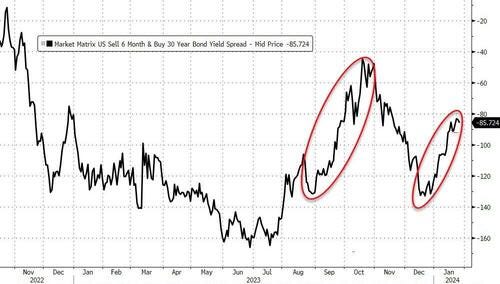
Bloomberg (via ZH): Watch Yield Curve For Clues On Treasury Refunding
… In the August report, longer-duration auction sizes were increased, driving the bond sell-off seen through September and October. It was around that time the Fed, notably Chair Powell, highlighted rising term premium as a concern.
In the run-up to the November announcement, the market was anticipating another large increase in the issuance of longer-maturity bonds, keeping yields on a rising track.
The curve was bear steepening, as often happens when term premium rises during a hiking a cycle (it was not yet clear the Fed was done raising rates).
The Treasury, perhaps mindful of this suboptimal environment, did increase longer-dated auction sizes, but not by as much as expected.
Yields fell through the rest of the year.
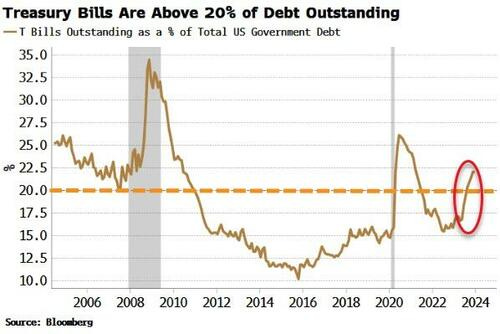
The Treasury has motivation to increase longer-term auction sizes as bill issuance is already above the 20% ratio to total debt outstanding it has generally preferred to keep it below.
Nonetheless, even though yields are still lower than they were last October, they have been rising again while the curve is bear steepening.
Term premium is rising again too. If this trend persists, then it may deter the Treasury from swinging too much back towards issuing longer-duration debt for now.
If, on the other hand, yields and term premium were to fall between now and the announcement next Wednesday (on softer-than-expected data for example), it might give the Treasury more confidence to increase auctions sizes, and thus risk bonds selling off.
at BOBEUNLIMITED (interesting look and reminder ahead of QRA Wed)
The QRA is the most important policy announcement next week. While there are lots of guesses on debt profile, unless you've got a tipster in Treasury you likely have no edge predicting the composition. It is much better to respond rather than front run the policy…
CERITY PARTNERS: Foreign-Born Labor Force on the Rise (read this as it offers some creedence to an idea floated by ZH and noted HERE Friday)
… The Fed watches the unemployment rate closely, which is currently at 3.7%. It’s been below 4.0% since January 2022. The last time it had a run of two years under 4.0% was from 1968 to 1970, and inflation grew from 3.8% to 6.0%. If the labor market is too tight, employers compete for workers and wages rise. But we don’t think the labor market is too tight this time.
Unemployment rises in two ways. One is that the workforce stays the same and people lose their jobs. The other is for the workforce to increase and the number of jobs to remain the same. We’d rather see the second. Taking more time for new entrants to find a job seems healthier than big job losses.
Recently, we’ve seen an increase in the labor force and particularly among foreign-born employees.
Since the low of 2020, the foreign-born labor force (blue line) grew by 36% to 30 million compared to growth of 2% or 3 million for the rest of the workforce. It’s now at an all-time high of 19% of the workforce. That’s a big surge and counts for most of the labor force growth in the last year.
The Office of Homeland Security (OHS) only published 2022 data on the number of people obtaining permanent status in November of 2023. It showed 1,019,349 people, up 40% from the prior two years. The record was 1.3 million in 2006.
The largest sources of immigration are India (12%), Mexico (11%), and China (6%). After that, no single country is 5%. Where do they go? California (18%), Florida (11%), New York (10%) and Texas (10%), with the remainder broadly in line with state populations.
The foreign-born cohort of the labor force has a higher participation rate of 67% compared to 61% for the rest of the labor force, and lower unemployment at 3.2% versus 3.9% for the remainder. It’s younger, with 75% in the 18- to 64-year-old range compared to 59% for the native-born population. And while the foreign-born component of the work force is at an all-time high of 19%, the foreign born share of the population is 13.6% and flat for 20 years. Around 47% of immigrants have a university education or higher, compared to 35% for the rest of the population.
Industries with the highest number of foreign born participants include hotels (31%), science and technology (26%), construction (25%), and health services (24%).
We’d expect the number of foreign-born participants in the labor market to grow. It has little to do with the border crossings. Half the growth is just a change in residency status and half from new arrivals. We won’t know the official numbers for a while but we’d guess that the foreign-born labor force will continue to grow, which should ease pressure on unemployment and wages. ..
the Convexity Maven: “Sharp Curve Ahead” (an intriguing quote caught MY attn)
… Presently, I have no problem suggesting that widows and orphans buy the UST two-years at 4.35%, which in California and New York is close to a 5.00% “gross” yield once the State and Local tax exemption is included…
ING: Weak inflation and strong growth underscore the Goldilocks US economy
The US economy continues to confound expects with US inflation getting close to target despite strong consumer growth. This spending is still being fuelled by savings and credit and surely can't continue running at these sorts of growth rates, but for now the consumer refuses to lie down. Fed rate cuts are coming, but March still looks too early
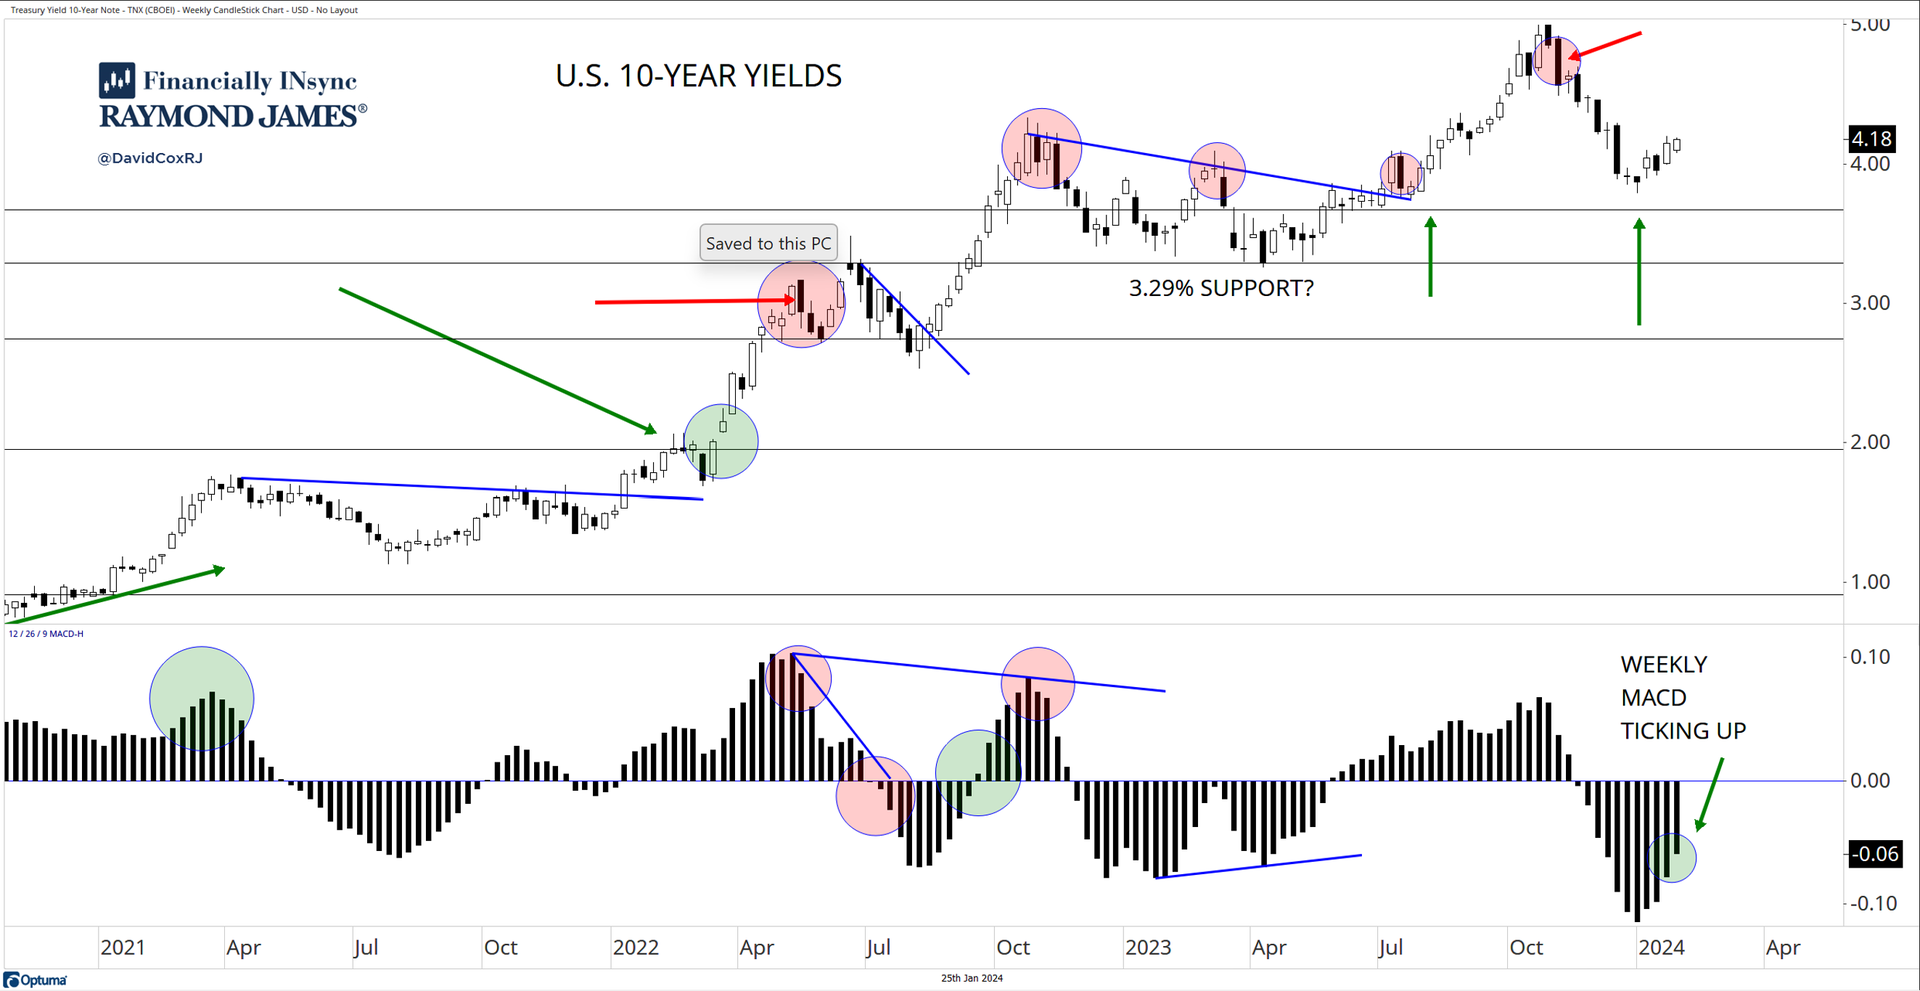
10-Year Yields Analysts and economists failed to forecast the significant rise in yields and yet now, we hear them tell us that rates are going to come back down and they’re certain. Here’s the chart of U.S. 10-year U.S. yields. It looks like consolidation to me after a strong rally. I like to use the Moving Average Convergence Divergence (MACD) histogram to point in the direction to lean from an investment and expectation standpoint. What does the histogram show? Most investors (that are familiar with the MACD) would use the signal line itself as the tool, but the difference between the two MACD lines can be viewed in histogram form (as below), and essentially provide a means of gauging if the short-term trend is moving faster or slower than the longer-term trend. The weekly histogram has been ticking upwards for several weeks now, and continues to do so. This helps me gauge and set my own expectations and certainly means piling into bonds is not on our current action list (since yields are inversely related to bond prices).
LongView Economics: Bonds, Energy & What’s Contrarian? (answer: BULLISH)
… in October, the evidence was mostly clear and facing one way. Bonds were oversold; sentiment had become bearish; there was panic about fiscal discipline in Congress (reflected in bond pricing); and, from a technical/price action perspective, yields had entered a ‘blow-off top’ phase, as we highlighted at the time, e.g. see quote above.
FIG 1: US 10 year Treasury yield (%), with 50, 90, & 200 day moving averages
With the sharp rally from October to December, though, those arguments have largely gone away and, anecdotally, there’s less conviction in markets on bonds (e.g. from client meetings)…
… In our view, and as we lay out in this week’s note, the risk is that yields fall to and overshoot their 3.5% anchor. That should be driven by both lower real yields and lower breakeven inflation rates …
… Because M2/GDP also serves as a leading indication for stock price movements, I thought it would be natural to compare the Manheim Used Vehicle Value Index to the SP500:
… I doubt that this divergence can persist forever, given the strength of the positive correlation before 2023. So that means that 2024 is probably a good time to buy a used car, or sell stocks, or perhaps both.
at RENMAC (tweetin’ 10s bullish and while this looks right on DAILY — what then of a WEEKLY — longer-term — renmac oscillation?)
10-year yields had a dark cross yesterday, suggesting path of least resistance should be lower, not higher for rates. That's already happened to most European yields, while equities and $SPX saw golden crosses almost a year ago now.
WolfST: On the Surface, PCE Inflation Is Encouraging, But Beneath it, Core Services Accelerated, Housing Stuck at 5.7% for Six Months
ZH: Government Worker Wage Growth Hits Record High As Fed's Favorite Inflation Signal Slows
… AND for any / all (still)interested in trying to plan your trades and trade your plans in / around FUNduhMENTALs, here are a couple economic calendars and LINKS I used when I was closer to and IN ‘the game’.
First, this from the best in the strategy biz is a LINKthru TO this calendar,
… In as far as AllStarCharts tracking the move in rates cuz, you know, there’s just nothing moar bullish stonks than … lower rates (despite economic signal - RECESSION - of said lower rates) …
… IF anything further hits inbox BEFORE NFL playoffs I might very well have another update but if not … well, yer on yer own!!
THAT is all for now. Enjoy whatever is left of YOUR weekend …


Fascinating article!!!
Lots to think about..
Go Chiefs! Otherwise SB is going to be a Blowout imo. Another great post thanks.