Good morning … BoE raises rates and says more hikes may be needed BUT the good news is they now see,
… a much shallower projected decline in output than in the November Report forecast…
Ok GREAT! Back to THIS side of the pond where markets still digesting the FOMC and specifically, in the presser, Chair Powell said,
“… I will say that it is gratifying to see the disinflationary process now getting under way, and we continue to get strong labor market data …”
HEREis the transcript via the WSJ AND … the rest is, as they say history
… here is a snapshot OF USTs as of 705a:
… HEREis what another shop says be behind the price action overnight…
… WHILE YOU SLEPT Treasuries are slightly higher (belly outperforming) but notably underperforming the Gilt market (UK 10's 11.5bp richer to US) even after the BOE hiked to 4%. At 7am: *BOE RAISES KEY RATE BY 50BPS TO 4%; EST. 4.000% and *BOE SAYS INFLATION RISKS `SKEWED SIGNIFICANTLY TO THE UPSIDE'- BBG. DXY just after 7am is little changed while front WTI futures are slightly lower (-0.2%). Asian stocks were mixed, EU and UK share markets are mostly higher (DAX +1.45%) while ES futures were showing +0.4% at 7:00am sharp. Our overnight US rates flows saw a pick-up in volumes during Asian hours after the FOMC with the curve pressed flatter on apparent selling pressure in the front-end. London's AM hours saw a quiet post-Fed and pre-BOE and ECB session. The desk did mention that carry trades remain a feature in their hours- on the back of the descent on vol. Overnight Treasury volume was decent at ~140% of average overall with 30yrs (174%) seeing the highest relative average turnover overnight.
… our first attachment shows the monthly chart of Treasury 10yrs going back 24 years. In the lower panel is monthly momentum (14,3,3 Slow Stochastics for those who'd like to keep score) and I've placed a vertical line at each of the prior five, monthly-close-confirmed bullish turns in momentum filtered for the kind of 'oversold' (80 or above in %K) levels seen today. You may disagree with, or eschew, technical analysis but you have to respect the new macro signal, right? And the next question might be: where could this new bull signal go wrong? Well, in recent week's we've mentioned that a bearish breakout in Treasury 2's above their multi-month bull channel would likely be a bad sign for bonds since it might mean that the recent bull correction was just, say, a flag in a Bear Flag continuation pattern. That channel is shown in our next attachment, updated post-FOMC. Secondly, look closely at the price action in 10's in 2006 and 2007 in our first attachment. We got the close-confirmed bull turn in momentum in August 2006 but by June of 2007, 10yr yields had rotated back higher and to 5.32%- above 2006's move high of ~5.25% while tracing out Bullish Divergence in doing so. Only then did rates fall and never look back, as you can see... The point is: 1) The multi-year bear phase in bonds has likely ended/reversed and 2) Nothing in life is free or easy (see 2006/2007 analog) so we'll guide you through what's likely to be a multi-year bull move in bonds via these pages, via chats, via meetings... whatever.
… and for some MORE of the news you can use » IGMs Press Picks for today (2 FEB— and STILL SPORTING THAT NEW LOOK!!) to help weed thru the noise (some of which can be found over here at Finviz).
From some of the news to some VIEWS you might be able to use. Global Wall St SAYS — and clearly today after yesterday’s FOMC (quote above), there’s lots to say and so:
… During Chair Powell’s press conference, equities started turning higher when the Chair said that the, “disinflation process has started.” Chair Powell also did not actively talk down risk markets when asked if financial conditions were too easy, by saying that the focus is “not on short-term moves but on sustained changes.” Powell also did not push back on markets pricing in rate cuts this year, saying that it reflects views that inflation will ease faster than the Fed expects. So whether it was Powell's intention or not, the market takeaway was biased towards the Fed being relaxed about loosening financial conditions and that cuts could happen if inflation behaved as the market expects it too. See our economists' review of the FOMC here. They still expect two more 25bps hikes in March and May, with the latter being a little more debatable.
By the close, the S&P had rallied 2.0% off the day’s lows to finish up +1.05% after trading in a 2.7% intraday range … Those moves took the S&P 500 and Nasdaq to their highest levels since late September. US 10yr yields fell -9.0bps to 3.417% (with yields remaining fairly stable overnight) while the more policy-sensitive 2yr yields were down -9.5bps on the day after being up +5.4bps on the FOMC statement release before rallying as the press conference began. In terms of fed futures, the market is pricing in a terminal rate of 4.89% in June, which was down -2.4bps on the day, as well as 41.1bps of rate cuts by the January ‘24 meeting, down around 8bps from the previous day.
The Federal Reserve did what was expected, raising rates by 0.25 percentage points (pps) yesterday. Fed Chair Powell offered a confused set of signals, even by the confused standards of Powell's ordinary commentary. For instance, rates would continue to rise but the Fed was not going to challenge the markets' dovish expectations. Since the June policy errors trashed forward guidance, markets have been inclined to emphasize the Fed's actions rather than words.
The Bank of England is expected to raise rates by 0.5pps. Markets' focus will likely be on the nature of the bank's divisions. The monetary policy committee sometimes resembles an Oxford college’s senior common room, engaged in an intensely passionate debate that is perhaps slightly detached from thoughts of real world consequences. The peak of UK rates is near.
The European Central Bank is also expected to raise rates by 0.5pps, and here the risk is of a longer period of tightening (into the second quarter). This is perhaps less a function of economics, and more due to the ECB's factional divisions under weak leadership…
From Paul and his perch at large Swiss operation we’ll turn to a large British bank
February FOMC: We've got a long way to go The FOMC affirmed expectations by boosting its policy rate 25bp and offering guidance that additional 25bp hikes are likely in March and May. Powell's press conference sent mixed messages, reiterating that the committee's work is not done, but showing reluctance to lean against easing financial conditions.
… Our Fed call: Based on the latest FOMC meeting, we are maintaining our Fed call unchanged. We continue to expect the FOMC will raise the funds rate target range 25bp in March and 25bp in May. We expect it to pause afterwards and maintain its 5.0-5.25% target range through much of the year. However, by the end of the year, with inflation at more moderate levels, we expect the FOMC recalibrate its policy stance and cut 25bp in both November and December. This would prevent the real policy rate (after adjusting for inflation expectations) from becoming increasingly elevated in the face of slowing growth, a weakening labor market and a rising unemployment rate.
… t the Committee made it clear that it sees further hikes as fine-tuning, and we took the overall message as consistent with our forecast of two more 25bp hikes in March and May … Our forecast of a peak funds rate of 5-5.25% remains slightly more hawkish than market pricing, which fell 3bp today to 4.93%.
We all read the same words and heard the same press conference and while I may not typically agree with much outta First Trust, well,
… While markets have rallied to start the year, we expect the party to end once they realize how much the economy will slow due to the decline in the M2 measure of the money supply since early last year. That economic medicine, while bitter, is part of the price we pay for the policy mistakes in 2020-21. And we are still amazed at how little attention the Fed and journalists give the money supply.
AND from this perspective, Wells
FOMC Hikes Rates and Signals Yet More to Come As universally expected, the FOMC raised its target range for the federal funds rate by 25 bps at the conclusion of its policy meeting today. But the tightening cycle likely is not over yet as the FOMC noted that "ongoing increases in the target range will be appropriate."
OK so maybe this was / was NOT the penultimate hike (or maybe it was). Seems to me ONE thing is clear … It’s too early to tell. Jeff,
… The market is now pricing in just one more hike, and a likely pause at the May meeting. Underpinning this view is an assumption that the economy will enter a recession in Q2 and that inflation will continue to slow sharply in the coming months. We believe it will take a bit longer to break labor demand, and inflation won't slow quite as rapidly as it has over the past three months. This is why we are still leaning toward two more hikes.
Ah, ok then — its the beginning of the end? Perhaps it is simply too early to tell (and clearly lots of smart people on either side of this one, some putting their money where others mouths are) … MS
March SEP Holds the Key The FOMC delivered a 25bp rate hike and will make a "data dependent" decision at the March meeting. The disinflationary process is underway and combined with a weaker labor market, we expect the Fed to pause. Our strategists maintain short USD, long 5s, 7s30s steepeners, and SFRH3H4 flatteners.
… The data are key
… Between now and the March meeting, there will betwo moreinflation and job prints.The February 3 payroll release will provide important information on how well job gains are withstanding policy lags. We look for 175k in netnew jobs and see the potential for backward revisions pointing to a more pronounced slowing in the labor market. A stronger print would pose upsiderisk to our call fora March pause, as the Fed would need to see both a lower level of payrollgrowth and a downward trend in the monthlygains between now and the March FOMC.
And finally (I cannot pass along more of this sellside drivel), from BBG … er, um, I mean a large French bank
… Our forecast for a 5.25% terminal fed funds rate is bolstered by the messaging around the February meeting. We continue to anticipate two more 25bp hikes, in March and May, followed by an extended pause through yearend.
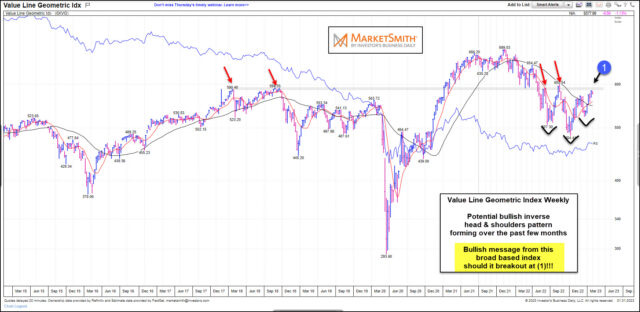
… Like other stock market indices, the Value Line Geometric Index declined sharply from its 2021 high. While bottoming over the past few months, however, this index formed a wide base in what could be an inverse head and shoulders pattern.
The neckline for this pattern comes into play at (1), and it made even more important when we consider that this level has been resistance on 4 prior occasions. So this won’t be an easy breakout… That said, this would also make a breakout a huge development for bulls…
Finally, as noted HERE YESTERDAY, the monthly performance review of January was one that saw both stocks and bonds ‘in the green’ and while one might like to annualize, well, Argus on FEBRUARY
… “We have studied the monthly, quarterly, and annual returns in the stock market since 1980. February is not one of the best months. On average, stocks rise only 0.1% in the month. Only the months of August and September have generated weaker average returns. There have been some strong Februarys, including 7% gains in 1986, 1991, and 1998, as well as a 5.5% surge in 2015. But there have been some clunkers as well: a 6% drop in 1982; a 9% plunge in 2001 during the "dot-com" bust; an 11% collapse near the bottom of the Great Recession and bear market in 2009; and, of course, the 20% bomb in February 2020, as the coronavirus began to spread around the world and the economy tumbled into a recession. Last year was nothing to write home about either, with a 4.9% drop in the month. This time around, investors are concerned about high interest rates, the risk of recession, slowing earnings growth, and geopolitical tensions. Indeed, the S&P 500 fell into a bear market in 2022, though 2023 started with a positive January. Given the challenges in the marketplace (and the fact that the Federal Reserve is still raising rates), we suggest that equity investors continue to focus on well-managed companies with clean balance sheets.”