(USTs modestly lower on STRONG volumes) while WE slept; while BAD = GOOD (meet the new narrative, same as the old one), a NFP precap (Falling hours = weaker payrolls) and a chart of GDI caught my eyes
Good morning … a funny thing happened on what was supposed to be a sleepy summer Tuesday morning ahead of Treasury Dept. liquidity event (known as 7yr auction …).
It can be summarized as this … BAD = GOOD. Said another way, meet the new narrative, same as the old narrative…
ZH: Stellar 7Y Auction Sees Blowout Foreign Demand As Yields Tumble
… But the clearest signal that buyers just couldn't get enough came from the Indirect bidders who took down 75.25%, well above the six-auction average of 68.4% and one of the highest foreign awards on record. And with Directs taking down 15.0%, the lowest since Oct 2020, Dealers were left holding on to 9.8%, also well below the recent average of 12.8%…
Good thing I didn’t suggest in any way / shape / form to be fancying 7yy at auction today. I’m so friggin smart suggesting charts NOT compelling … Remind me again why we are here … I’m scribbling thoughts down and yer reading? (rhetorical question, please don’t answer).
Where are we now? Looks to ME like we’re at some reasonable level or ‘resistance’ (nice that it ALSO lines up in / around 4.25%, dont you think?) with momentum that has gone from oversold to overbought … I present, long bonds
Now, from here … well we’ll need some help from data (ADP, NFP) in order for the bid to continue, at least in my humble opinion …
On the other hand, I did mention how a bit of a (bullish) pain trade ahead of NFP would not be of any wild surprise … and so, meet the new narrative, same as the old one where BAD = GOOD.
To this point, just a couple / few links to consider …
WolfSt- Massive Churn in the Labor Market Slows: Layoffs and Discharges, Voluntary Quits, Job Openings, and Hires Yardeni: Hooray! Job Openings & Quits Fall. ZH: Bonds, Big-Tech, Bitcoin, & Bullion Soar After JOLTS Weakness Sends Rate-Hike Odds Plunging ZH: Labor Market Implodes: Job Openings Crater, Prior Data "Unexpectedly" Revised Sharply Lower
With consensus expecting only a modest drop in the July job openings from 9.582 million to 9.5 million, what the BLS reported instead was a doozy: in July there were just 8.827 million job openings, the first sub-9 million print since March 2021. It was also the 3rd biggest miss on record!
These market machinations provided a reverse / inverse concession robbing The Street of any ability to ‘buy dip’.
Not all is lost or so bad things are good. OR, how to say it … maybe some things ARE in fact GOOD (so, that makes them bad, right?)
Take, for example, house prices which are rising almost as much / fast as mortgage rates … so, we’ve all got THAT going for us, right?
ZH: US Home Prices Rose For 4th Straight Month In June, Case-Shiller Data Shows
Assuming a $3,000 monthly budget... -2.65% mortgage rate in Jan 2021 could have bought you a home worth $641k. -7.23% mortgage rate today could buy you a home worth $434k. That's a $207k (32%) decline in purchasing power.
Nevermind … Lets face it. It’s last week of summer and we’ve got the “B TEAM” here stratEgerizing and trading (present company included? sorry. not sorry) ahead of the upcoming long weekend. Make of it all whatever you will …
… here is a snapshot OF USTs as of 705a:
… HERE is what this shop says be behind the price action overnight…
… WHILE YOU SLEPT Treasuries are modestly lower but outperforming the German bund market after German state inflation readings came in a bit hotter than expected. DXY is little changed while front WTI futures are higher (+0.65%). Asian stocks were mostly and modestly higher, EU and UK share markets are mixed while ES futures are little changed here at 7am. Our overnight US rates flows saw an early uptick in Tsy prices during Asian hours before prices slumped on the German regional CPI data. Asian session volumes were pretty decent at 150% of ave. In London's AM hours we saw initial dip buying in intermediates (10's) before profit-taking from fast$, primarily around the 7y point. Overnight Treasury volume was ~120% of average overall.
… Our last attachment looks at the overlay of Treasury 7yr yields and USDJPY. The thought "co-dependency" comes to mind when looking at the correlation. This chart was inspired by a comment from the desk yesterday that linked intermediate performance to the currency pair. Well-spotted on their part.
Well spotted, indeed … and for some MORE of the news you can use » The Morning Hark - 30 Aug 2023 and IGMs Press Picks in effort to to help weed thru the noise (some of which can be found over here at Finviz).
From some of the news to some of THE VIEWS you might be able to use… here’s SOME of what Global Wall St is sayin’ …
One way to better understand the impact of BoJ YCC exit on Japanese demand for US Treasuries is to look at how much of the recent increase in US long-term interest rates has happened during Tokyo trading hours.
The chart below shows that since the BoJ YCC exit surprise in late July, the move higher in 10s has occurred almost entirely during New York trading hours.
This suggests that US rates are not driven higher by Japanese investors during Tokyo trading hours. And hence, BoJ YCC exit doesn’t seem to be the reason long rates have increased over the past month.
Instead, likely drivers of US rates over the past month are the US sovereign downgrade, fewer dollars for China to recycle in a falling exports environment, Fed QT, the significant budget deficit, the large stock of T-bills, and the Treasury’s intention to increase coupon auction sizes.
Job openings fell to 8.8mn in July, the lowest since March 2021, on the heels of a 417k downward revision to the June data. The ratio of vacancies to unemployed moderated to 1.5, the lowest since September 2021, and the quits rate also eased. The data add to evidence of an incremental easing in labor market conditions.
The July JOLTS job openings report was punctuated by data that touched fresh multi-year lows, in a sign that labor market conditions are easing, albeit from very tight levels. Not only did total job openings decline more than we had expected, the data for June were revised lower, and the job openings rate, vacancy per unemployed rate and quits rate all eased to their lowest levels in more than two years…
The FHFA and S&P CoreLogic CS 20-city measures of house prices both increased in June, with the FHFA index rising 0.3% m/m and the S&P index rising 0.92% m/m. Data from today's releases show the effects of resilient housing demand amid limited inventories nationwide.
The August pull-back was more due to buyers' strike than a broad de-risking. Positioning hasn't reduced much, but rotation to cash, bonds and Defensives means caution. As the consensus US soft landing narrative walks a fine line b/w peak rates and a weaker consumer, no one seems positioned for good news in Europe and China.
… Cash is king, but investors increasingly favour bonds to equities Despite the persistent volatility in rates, ytd flows from mutual funds remain skewed towards cash and bonds. As a result, their asset allocation looks more exposed to bonds than equities given the level of yields.
… At the same time, nominal yields have gone higher most recently although that has largely been a function of investors reassessing the growth outlook and pushing real yields higher (i.e. higher rates for the right reason). Indeed, as our rates strategists illustrate here, financial conditions remain less tight than last year despite higher yields, given the better expectations on growth. Meanwhile, fiscal largesse in the US appears to have woken up bond vigilantes which should end up keeping bond volatility higher, thereby relatively favouring equities over bonds, unless growth disappoints materially. In fact, most recent data has been on the soft side, with the US consumer showing signs of weakness, which has revived the peak rates narrative.
JOLTS job openings in July came in at their lowest level since March 2021 and significantly below estimates at 8827k vs. 9500k seen with the prior read revised lower to 9165k from 9582k. A very soft look at labor demand as outright job openings continue to slide in response to the increasingly evident lagged impact of higher policy rates. Within the details, the quits rate fell further to 2.3% from 2.4% as another sign of softer labor demand and this is the lowest since January 2021 as worker are less and less willing to resign.
Relatedly was Conference Board Consumer Confidence that disappointed at 106.1 vs. 116.0 expected and prior was revised lower as well to 114.0 from 117.0. Present situation dropped to 144.8 from 153.0 and expectations declined to 80.2 from 88.0. Most troublingly for NFP on Friday was the drop in the labor differential that fell to 26.2 from 32.4 -- the lowest since April 2021. Not a good look at the household outlook, and a print that should take the edge off consumption estimates for Q3.
Earlier this morning Case-Shiller for June surprised on the upside at 0.92% MoM vs. 0.80% MoM seen and May was revised to 1.04% MoM from 0.99% MoM in a strong (if lagged) looked at real estate prices. This brings the YoY pace to -1.17% compared to the -1.60% forecast with the prior revision to -1.73% from -1.70%. Not especially relevant to the forward looking outlook on housing after mortgage rates reached a 20 year high this week, but useful in framing the departure point if nothing else.
After selling off earlier in the session, Treasuries found a bid going into the data with 10-year yields dropping back to what's become a pivotal level at 4.20%. The combination the jobs data and consumer confidence has extended the rally significantly with 10-year yields down to 4.14% and the curve steepening as September and November hike odds have come down with the labor market increasingly showing evidence of softening. The response complicates the setup for this afternoon's 7-year auction, although the liquidity point could be viewed as an opportunity to join the rally.
A gradual deceleration in labor demand will likely keep pushing net hiring to new post-pandemic lows. In August, we project nonfarm payroll growth at 140k (down from 187k prior) and a steady unemployment rate at 3.5%.
A rise in bankruptcies – trucking firm Yellow Corp. filing for relief in early August is just one high-profile example – could add acute weakness to the recent trend. Transportation and warehousing jobs have been under pressure as consumer preferences shift towards services consumption.
Data suggest more cooling is in store for the tight job market. Americans are less willing to switch jobs (likely hinting that employers are less generous amid the uncertain outlook), openings are down and fewer consumers see jobs as plentiful.
We note that August payroll growth typically undershot the consensus estimate by about 30k over the pre-pandemic 2003-19 period, presenting downside risk to the consensus.
BNP - US rates: Buy the dip, sell receiver skew on yield reset (start talkin’ swaps and yer way above my paygrade — always was / will be — BUT to note the idea here is a buyer of the current ‘dip’ and so, the message is not lost, at least not completely so, on me)
The reset in yields has eroded the valuation headwind to owning US duration, in our view. We now view selloffs as an opportunity to add long exposure on more Fed-sensitive parts of the curve given cyclical considerations.
Receiver skew in the ULC remains expensive, we think. Realized vol moves in the sector have generally underperformed what is implied by skew in the last few months, particularly when yields fall.
We offer a series of swaption-based expressions that reflect our view….
DBDaily - Weak US data revives recession risk (the CoTD caught my attn)
…Big miss as well on US job openings, down to 8.8mn in July from a revised 9.2mn in June (previously 9.6mn). A 0.2ppt drop in the private quits rate, down to 2.5%, close to the 2019 average. The number of openings to unemployed - a metric favoured by Powell - is now at 1.5 versus 1.2 in 2019.
ING Rates Spark: Losing buoyancy (presented without comment)
Weaker data is eroding the US narrative that has helped push yields higher over the past week. A lower landing zone for the Fed also means a lower floor to long-end rates. There is still more data and volatility in store this week, with the US jobs data looming large. EUR markets will look to the inflation data key input for the upcoming ECB meeting
MSs - Charts That Caught My Eye (hopes for DEFLATION to help JPOW & Co, #WINNING — except for, well the other side of the coin … companies, you know, who bare the costs OF deflationary forces …)
Deflationary Pressure Weighs on Earnings - Report Link (thanks, China?)
Could China Export Deflation? - Report Link (thanks, China?)
Lost swagger in August has a lot to do with the cooling labor market. Multiple gauges of how consumer feel about jobs slipped to levels not seen in more than two years.
…Labor Differential Dips to a More Than 2-Year Low To say that it has been a strong labor market in recent years is an understatement. The unemployment rate earlier this year fell to lows not seen in well over a half-century. That gave consumers a degree of confidence that bordered on haughtiness. But consumer perceptions of the labor market took a hit in August, with the labor differential reaching its lowest rate in over two years (chart). Those viewing jobs as hard to get rose to 14.1% from 11.3% a month prior, its highest rate since April 2021. Further, those viewing jobs as plentiful fell to 40.3% from 43.7% a month prior, also the lowest since April 2021.
This lost swagger was evident in the separately reported Job Openings and Labor Turnover Survey also released this morning which showed far fewer people quitting their jobs. In fact, the quit rate fell to 2.3%, fully reverting to its pre-pandemic level.
In recent years, consumers have managed to stay upbeat and keep spending even in the face of high inflation, because for many workers, pay checks were getting bigger too. But the mood is shifting here as well. Income expectations decreased in August; a smaller share of consumers expect their incomes to increase when compared to last month. Similarly, 12.4% expect their incomes will decrease, up from 9.9% last month.
This deterioration in confidence does not materially change our view. We already anticipated some slowing in consumer spending. A loss of confidence does not always translate into a drop in spending, either. There was also a bit of good news in today's report as well. When asked about the likelihood of recession over the coming year, fewer respondents were concerned; in fact, it was the smallest share recorded thus far in 2023.
Today’s data calendar is dominated by inflation. Australian July consumer prices rose significantly less than expected—and while not a major focus for global investors, it reinforces the general disinflation narrative (and the idea that profit-led inflation is in retreat).
German and Spanish consumer price inflation for August is likely to show stable to modest disinflation tendencies. German import price data for July was more deflationary than expected— consumer durable goods have almost no inflation. This reflects the shift in demand patterns and the inevitable reversal of the 2021/22 transitory inflation episode.
US second quarter GDP will be revised (the data will still be revised a lot in the future). Markets tend not to focus on revisions too much, but the personal consumer deflators will likely attract some attention as investors try to understand the logic of the Federal Reserve’s policies (this may be a futile exercise).
Investors are likely to look at the mortgage lending numbers in UK credit data. The tightening of policy has raised mortgage interest rates sharply. However, this is something which affects the housing market more than it affects the general consumer. A sizeable majority of UK households have no mortgage, so changes in mortgage rates do not impact their spending power.
Wells Fargo - JOLTS: More Good News for the FOMC (bad = good = #winning)
The July JOLTS report showed clear signs of continued cooling in labor demand growth. Total openings fell to 8.8 million in July, a decline from the downwardly-revised 9.2 million openings in June and the lowest level since February 2021. Gross hiring growth kept slowing, but involuntary separations including layoffs remained in check, a sign that while demand for new workers is moderating, demand for existing workers is holding up.
AND a couple / few things from the intertubes which caught MY attention and I thought might hold some funTERtainment value …
Authored by Simon White, Bloomberg macro strategist,
There continues to be compelling signs that a US recession could be near at hand, a risk that stock markets are not reflecting.
This week we get a raft of US data that will shed further light on US recession risks. While some data points, such as the Atlanta Fed’s GDPNow growth estimate, are consistent with a robust economy, there are several other data points that continue to imply a recession is close (or not implausibly, even here now, if data is subsequently revised lower).
The Four P’s of recessions is that they are downturns that are persistent, protracted, pervasive and precipitate.
To capture these, I created the Recession Gauge, which is made up of 14 sub-components that cover a wide array of market and economic data. It has been in recession mode all of this year.
One of its sub-components is the Fed Regional Manufacturing Indicator (we’ll get one of its data points today with the Dallas Fed’s Manufacturing Index for August). The Fed regional banks’ indexes are notoriously volatile, however if we look at the percentage of them contracting, it gives a historically reliable foreshadowing of a recession, having only two false positives going back to 1970. The indicator is currently in recession mode.
This week we will also get claims, payrolls and ISM data.
Claims data by US state continues to be consistent with a near-term recession. ISM manufacturing remains in contraction territory. The new orders-to-inventory component is rising, pointing to some near-term upside for the headline index, but recent PMI data disappointed to the downside, intimating that the manufacturing recession is ongoing.
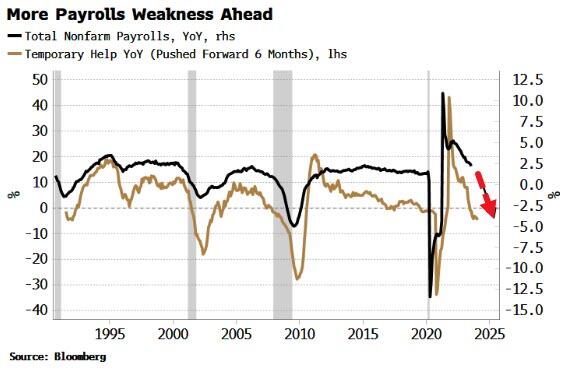
The labor market has been the most unexpectedly resilient part of the economy through the Fed’s hiking campaign. But weakness is becoming more apparent. Not only is, for example, payrolls data being revised lower (as is typical at turning points), leading jobs data shows payrolls growth should keep falling, and the unemployment rate soon start rising.
Employers tend to reduce employee hours and let temporary workers go before they start layoffs. Average hours worked has been falling, and growth in temporary-help employment has been contracting, pointing to much weaker growth in payrolls.
Stocks have been dancing to a different tune, however. Their path since the bear market began last year has not only exceeded previous bear markets that coincided with a recession, but is now clearly ahead of all prior bear markets going back to 1929.
Even though in this downturn – as one likely to be accompanied by high inflation – stocks are less likely to fare as badly (in nominal terms), they are still prone to a rude awakening from an economy that could precipitately look very recession-like.
Credit spreads, high yield and investment grade, are the major assets least reflecting a recession based on their behavior before previous downturns, with stocks not far behind.
Recession talk has gone out of fashion, replaced by soft-landing chatter (Tuesday’s weaker-than-expected JOLTS and consumer data just released might help change that though). But the underlying data has not changed significantly enough that we can all go back to sleep, ready to be awoken by the next boom.
Manufacturing is in recession, and services are turning down, based on both the ISM and PMI surveys. At their current rate of decline, each survey will be under the 50 contractionary level very soon.
GDI – gross domestic income – is consistent with a recession. Further, GDP and GDI have shown the largest discrepancy in over 20 years, with the average of the two close to 0%.
Moreover, my Recession Gauge – which captures when a whole swathe of economic and market data start to look recessionary at the same time – has been indicating a recession all year. Also, unemployment and continuing claims by US state are consistent with a near-term recession.
The Atlanta Fed’s GDPNow is one of the most positive indicators, currently expecting 3Q23 annualized real GDP to be 5.9%. But it’s worth noting that in its short 12-year history it has never been tested in a (non-pandemic) recession – precisely when data is often most wrong and has to be significantly revised.
Recessions tend not to happen gradually, bur precipitately. Hence the relative economic calm should not be taken as a sign to become less vigilant. That is doubly the case now when most assets are pricing in a low probability of a recession.
In this sort of environment, the costs of hedging recession risk are cheap(er) precisely because the risk has gone off most people’s radar. Thus even if the economy manages to skirt a slump, the opportunity cost of insuring against one is relatively low - unless of course risk takes off again, but liquidity conditions are becoming less conducive to that happening.
$TNX 10-year treasury index on a weekly basis with a bearish divergence in the RSI.
10-year yields made new highs at the end of last week while RSI is making lower highs.
Possible Double Top pattern forming?
With all this in mind, it’s good to know someone somewhere with an official sort of ‘account’ is watching all things going on here / now and how they may be impacting BANKS
FRBS St Louis: Economic Uncertainty, Rising Interest Rates Challenge Banks (Alfred E Newman visual comes to mind, ‘what, me worry’)
… What’s Ahead As we look ahead to the remainder of 2023, it is likely that bank funding costs will remain elevated. Recent data from the Federal Reserve’s Senior Loan Officer Opinion Survey also point to ongoing tightening in credit markets, and we’re seeing rising delinquencies on consumer loans. These data point to the need for continued vigilance by bankers and bank supervisors and highlight the importance of ensuring adequate access to contingency funding lines. Despite some positive market signals, there are still significant headwinds ahead.
Don't be so hard on yourself bud, the market makes fools of us all. All this 'softy' landing talk makes me self-reflect. I was so PROUD to get out of the market pre 2020 Covid crash. But I was wedded to the Continuing Crash mantra. Or better yet, Confirmation Bias. Meanwhile, 2 market men of worth, Marcro Tourist Kevin Muir, And Kuppy-Harris Kupperman, both called the 2020 March 23rd low. Muir even titled what was to come as MOAS-Mother of all Stimulus. The man knows his sh!t! I should've trusted my instincts, and allocated 10% to small caps, 10% value, 10% large cap, etc. Could've easily doubled my $$$. Buying the Bitcoin low then would've been tits Up too! Instead I waited in cash for the Continuing Crash. Hopefully I've learned, ok have your BIAS, but don't let it inhibit you from making Mo' MONEY!


Don't be so hard on yourself bud, the market makes fools of us all. All this 'softy' landing talk makes me self-reflect. I was so PROUD to get out of the market pre 2020 Covid crash. But I was wedded to the Continuing Crash mantra. Or better yet, Confirmation Bias. Meanwhile, 2 market men of worth, Marcro Tourist Kevin Muir, And Kuppy-Harris Kupperman, both called the 2020 March 23rd low. Muir even titled what was to come as MOAS-Mother of all Stimulus. The man knows his sh!t! I should've trusted my instincts, and allocated 10% to small caps, 10% value, 10% large cap, etc. Could've easily doubled my $$$. Buying the Bitcoin low then would've been tits Up too! Instead I waited in cash for the Continuing Crash. Hopefully I've learned, ok have your BIAS, but don't let it inhibit you from making Mo' MONEY!